| Param | Original file | Final file |
|---|---|---|
| Filename | modeM0/AS1C05_019T04_9000004162_29042cztM0_level2.evt | modeM0/AS1C05_019T04_9000004162_29042cztM0_level2_quad_clean.evt |
| Size (bytes) | 519,425,280 | 117,532,800 |
| Size | 495.4 MB | 112.1 MB |
| Events in quadrant A | 3,312,051 | 769,802 |
| Events in quadrant B | 3,563,793 | 786,573 |
| Events in quadrant C | 3,397,987 | 763,272 |
| Events in quadrant D | 4,965,487 | 736,158 |
| Mode SS | |||
|---|---|---|---|
| Quadrant | BADHDUFLAG | Total packets | Discarded packets |
| A | 0 | 146 | 0 |
| B | 0 | 146 | 0 |
| C | 0 | 146 | 0 |
| D | 0 | 146 | 0 |
| Mode M9 | |||
|---|---|---|---|
| Quadrant | BADHDUFLAG | Total packets | Discarded packets |
| A | 0 | 1 | 0 |
| B | 0 | 1 | 0 |
| C | 0 | 1 | 0 |
| D | 0 | 1 | 0 |
| Mode M0 | |||
|---|---|---|---|
| Quadrant | BADHDUFLAG | Total packets | Discarded packets |
| A | 0 | 14862 | 1 |
| B | 0 | 15562 | 1 |
| C | 0 | 15006 | 1 |
| D | 0 | 19845 | 1 |
| Quadrant | Total seconds | Saturated seconds | Saturation percentage |
|---|---|---|---|
| A | 7235 | 172 | 2.377332% |
| B | 7236 | 246 | 3.399668% |
| C | 7236 | 172 | 2.377004% |
| D | 7236 | 297 | 4.104478% |
Noise dominated data is calculated using 1-second bins in cleaned event files. If a bin has >2000 counts, and if more than 50% of those come from <1% of pixels, then it is considered to be noise-dominated and hence unusable.
| Quadrant | # 1 sec bins | Bins with >0 counts | Bins with >2000 counts | High rate bins dominated by noise | Noise dominated (total time) | Noise dominated (detector-on time) | Marked lightcurve |
|---|---|---|---|---|---|---|---|
| A | 7340 | 7235 | 0 | 0 | 0.00% | 0.00% | 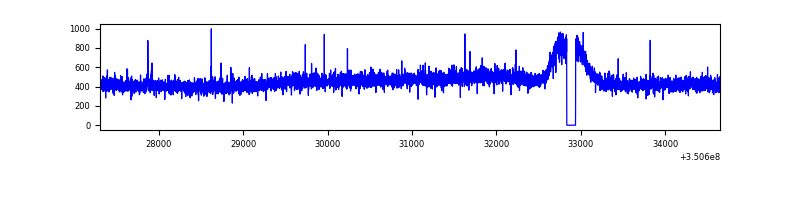 |
| B | 7341 | 7236 | 35 | 35 | 0.48% | 0.48% | 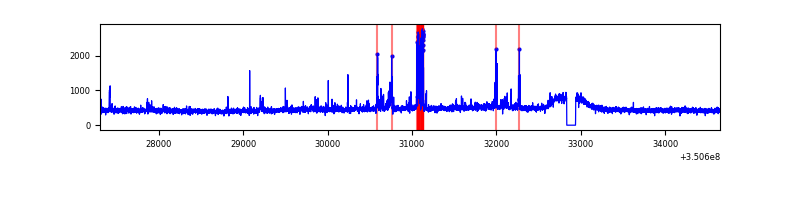 |
| C | 7341 | 7236 | 4 | 4 | 0.05% | 0.06% | 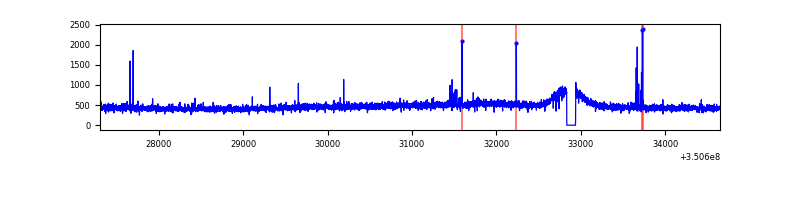 |
| D | 7341 | 7236 | 151 | 151 | 2.06% | 2.09% | 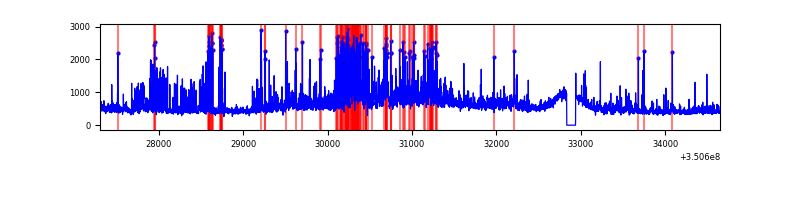 |
Top three noisy pixels from each quadrant. If the there are fewer than three noisy pixels in the level2.evt file, extra rows are filled as -1
| Pixel properties | Quadrant properties | ||||||
|---|---|---|---|---|---|---|---|
| Quadrant | DetID | PixID | Counts | Sigma | Mean | Median | Sigma |
| A | 13 | 254 | 12962 | 69.72 | 854 | 835 | 173.9 |
| A | 6 | 16 | 11930 | 63.79 | 854 | 835 | 173.9 |
| A | 3 | 137 | 8706 | 45.25 | 854 | 835 | 173.9 |
| B | 10 | 245 | 183760 | 1125.2 | 846 | 821 | 162.6 |
| B | 10 | 246 | 28072 | 167.61 | 846 | 821 | 162.6 |
| B | 12 | 111 | 20502 | 121.05 | 846 | 821 | 162.6 |
| C | 14 | 238 | 133347 | 689.07 | 819 | 823 | 192.3 |
| C | 2 | 16 | 37737 | 191.94 | 819 | 823 | 192.3 |
| C | 3 | 233 | 19709 | 98.2 | 819 | 823 | 192.3 |
| D | 1 | 52 | 1128025 | 5688.26 | 821 | 797 | 198.2 |
| D | 8 | 195 | 595957 | 3003.32 | 821 | 797 | 198.2 |
| D | 2 | 250 | 123174 | 617.54 | 821 | 797 | 198.2 |
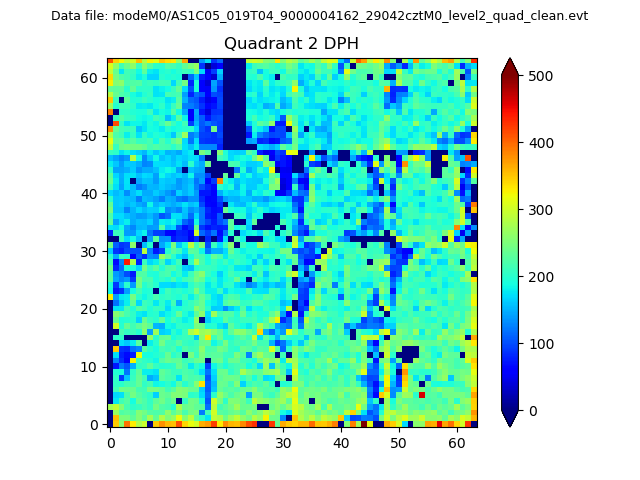
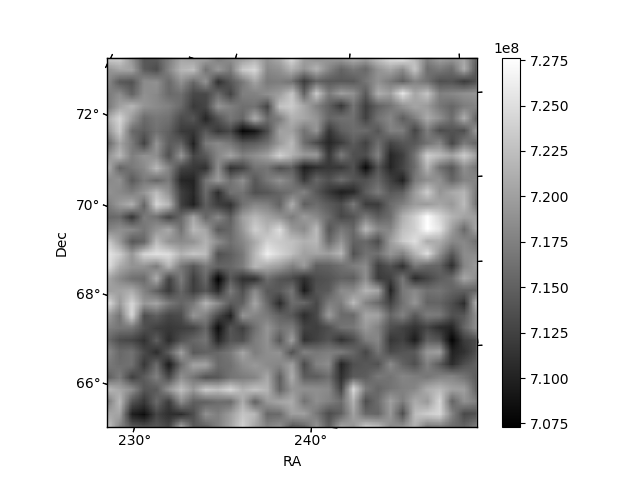
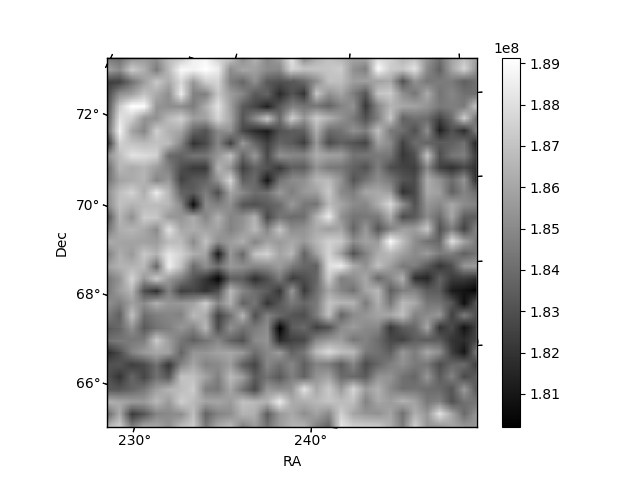
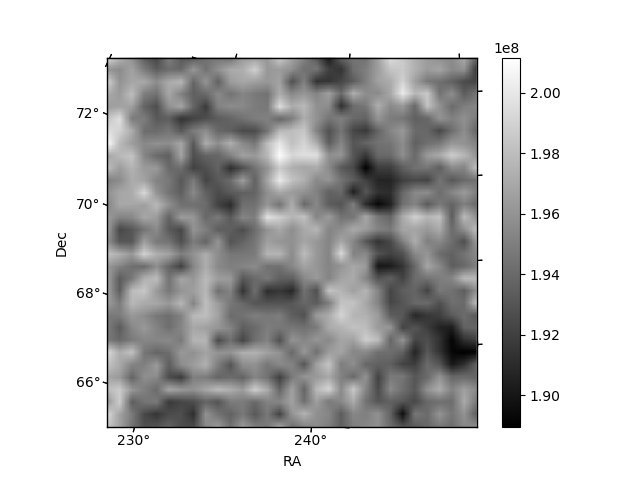
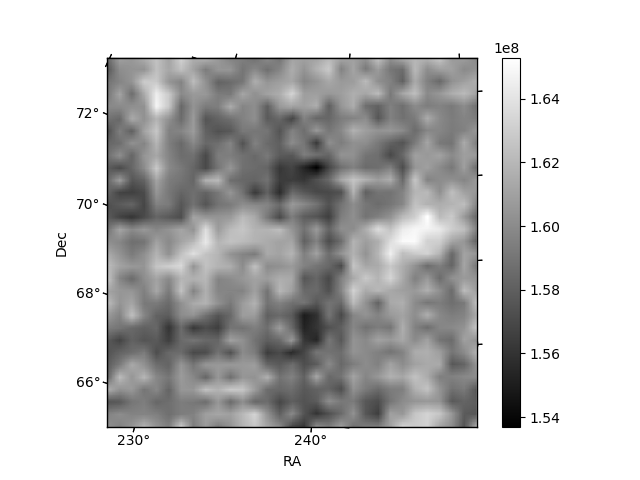
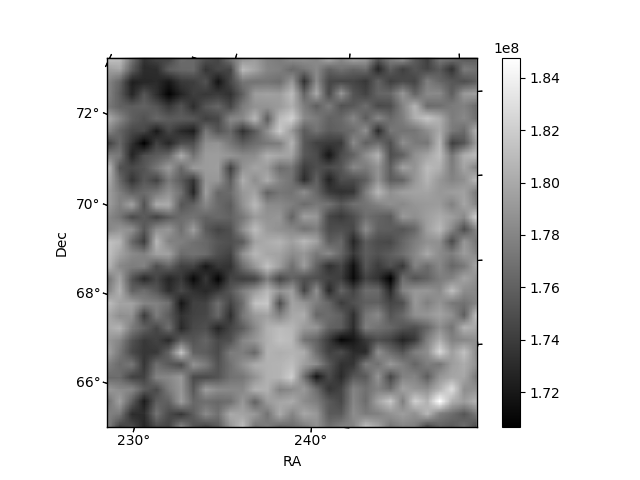
Histogram calculated using DETX and DETY for each event in the final _common_clean file
| Quadrant A | 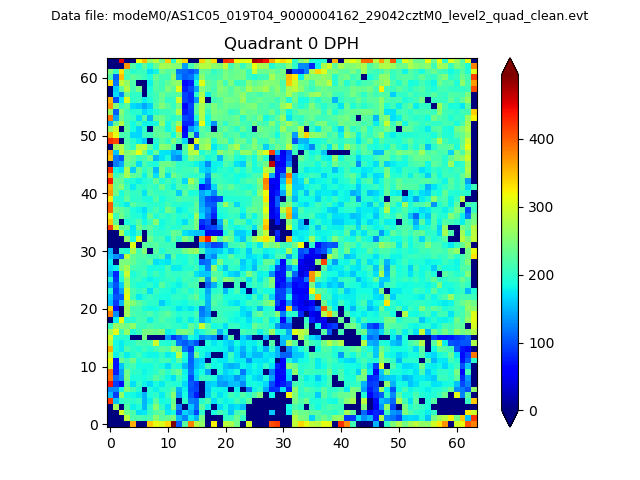 |
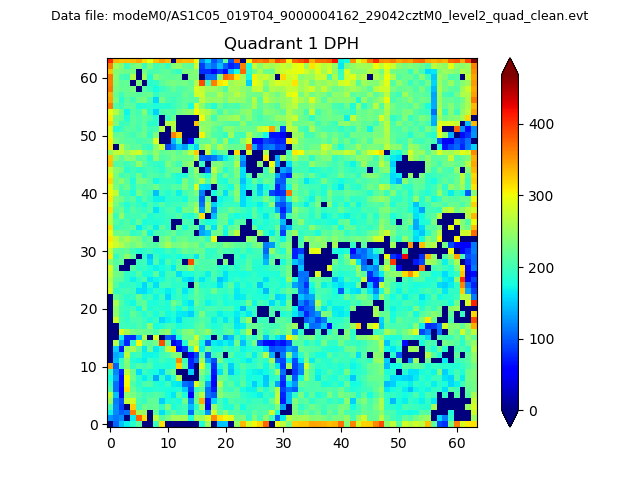 |
Quadrant B |
|---|---|---|---|
| Quadrant D | 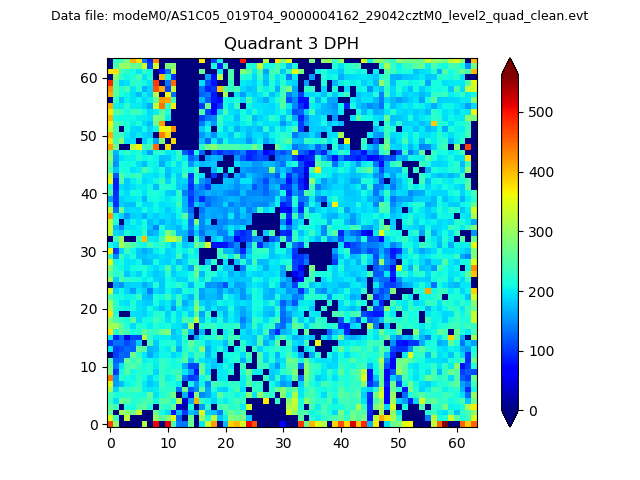 |
 |
Quadrant C |
| Plot type | Count rate plots | Images |
|---|---|---|
| Comparison with Poisson distribution Blue bars denote a histogram of data divided into 1 sec bins. Red curve is a Poisson curve with rate = median count rate of data. |
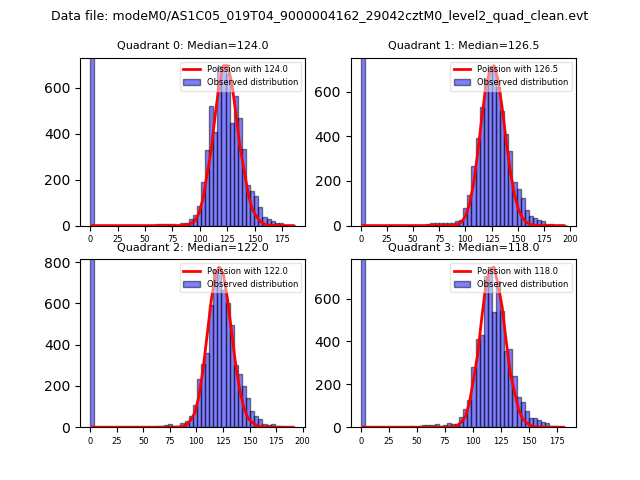 |
 |
| Quadrant-wise count rates Data is divided into 100 sec bins |
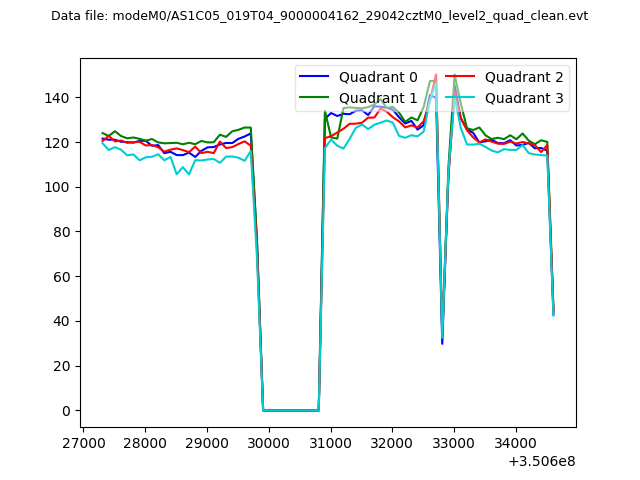 |
|
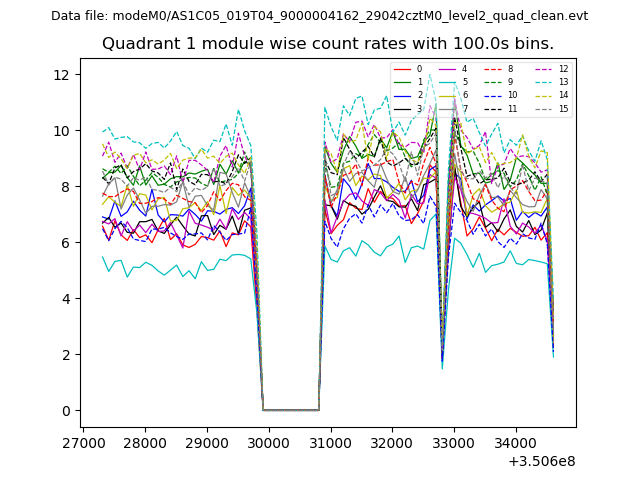
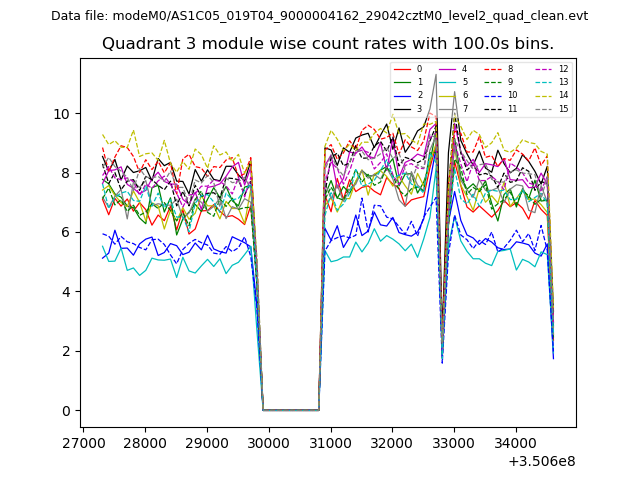
| Module-wise count rates for Quadrant A Data is divided into 100 sec bins |
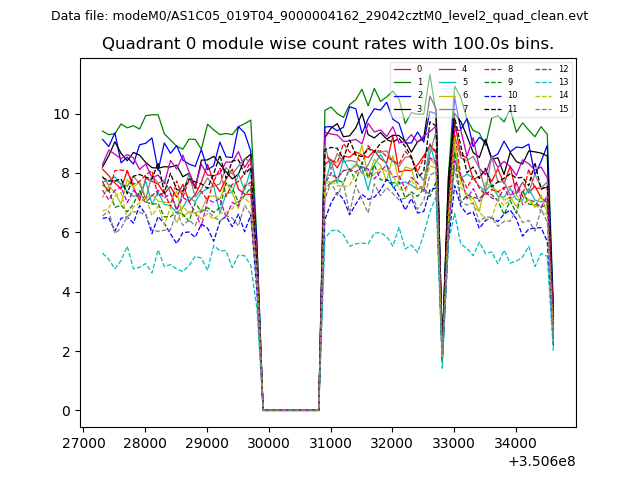 |
 |
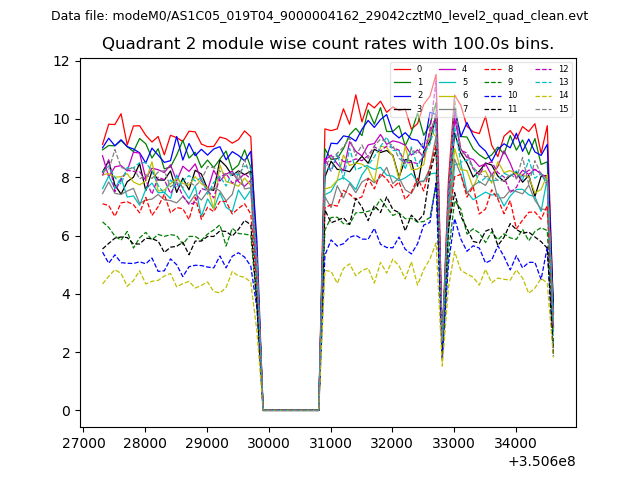
| Module-wise count rates for Quadrant B Data is divided into 100 sec bins |
 |
 |
| Module-wise count rates for Quadrant C Data is divided into 100 sec bins |
 |
 |
| Module-wise count rates for Quadrant D Data is divided into 100 sec bins |
 |
 |
| Parameter | Plot |
|---|---|
| CZT HV Monitor | 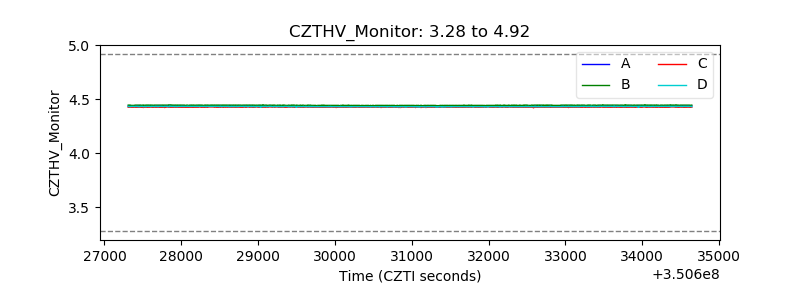 |
| D_VDD | 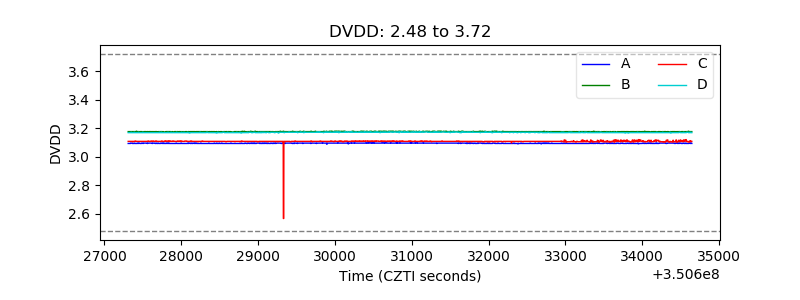 |
| Temperature 1 | 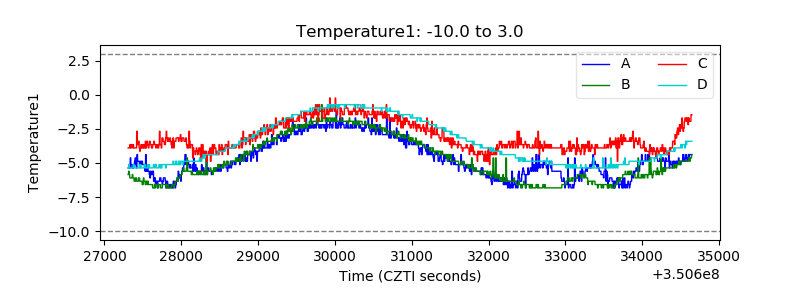 |
| Veto HV Monitor | 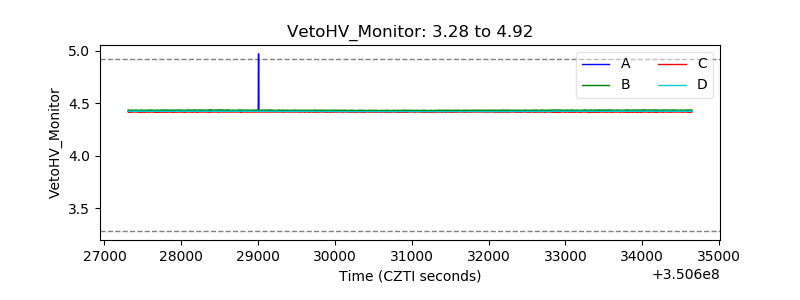 |
| Veto LLD | 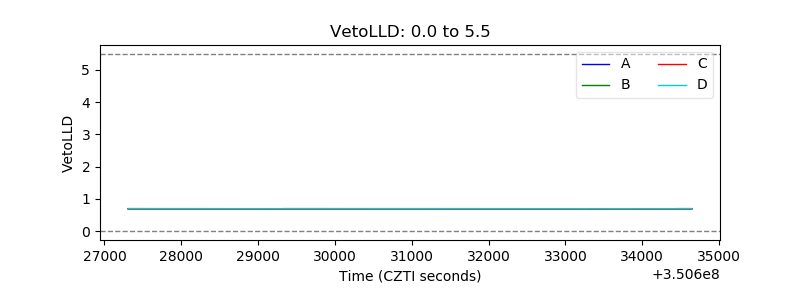 |
| Alpha Counter |  |
| _CPM_Rate | 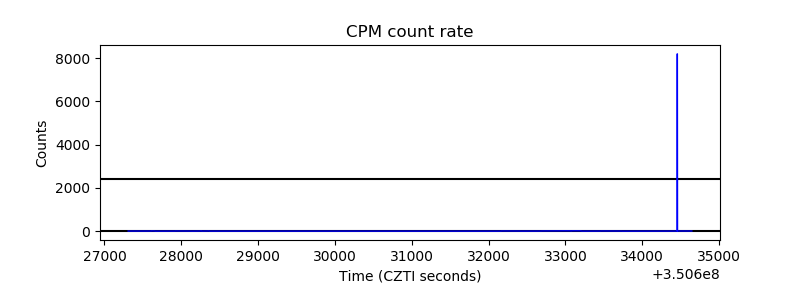 |
| CZT Counter | 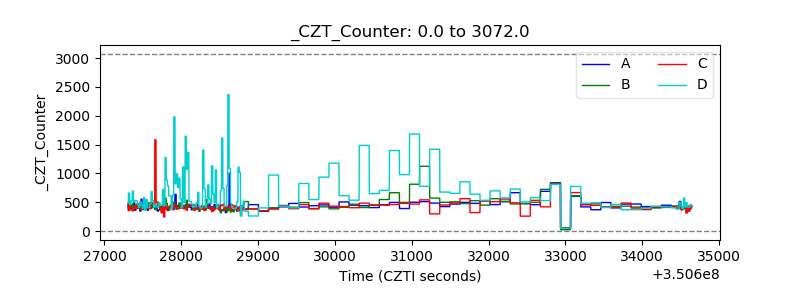 |
| +2.5 Volts monitor |  |
| +5 Volts monitor |  |
| _ROLL_ROT | 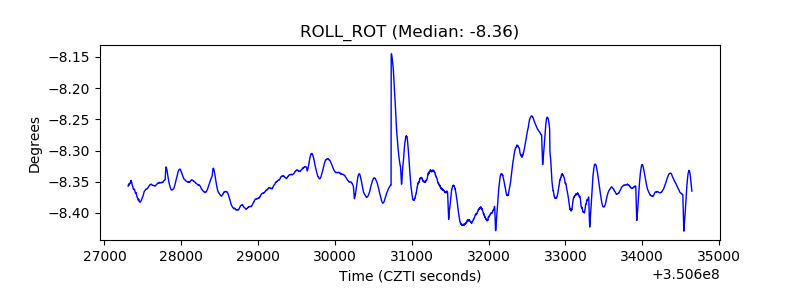 |
| _Roll_DEC | 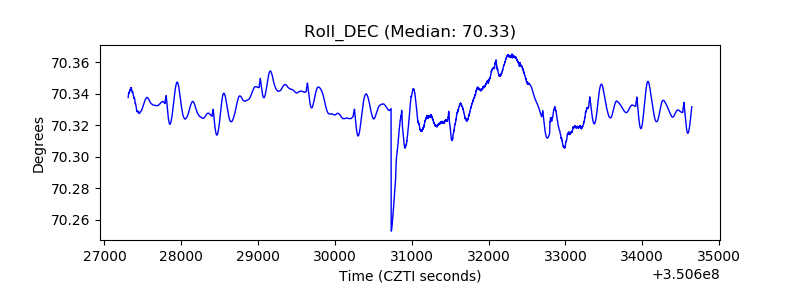 |
| _Roll_RA | 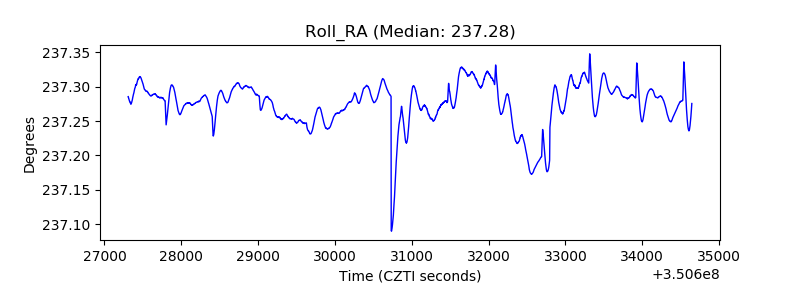 |
| Veto Counter | 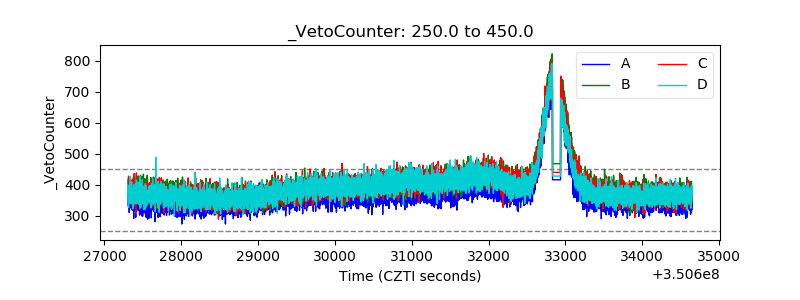 |