| Param | Original file | Final file |
|---|---|---|
| Filename | modeM0/AS1C05_019T04_9000004162_29045cztM0_level2.evt | modeM0/AS1C05_019T04_9000004162_29045cztM0_level2_quad_clean.evt |
| Size (bytes) | 1,280,954,880 | 280,347,840 |
| Size | 1.2 GB | 267.4 MB |
| Events in quadrant A | 8,222,607 | 1,839,066 |
| Events in quadrant B | 8,460,303 | 1,871,356 |
| Events in quadrant C | 8,398,527 | 1,805,547 |
| Events in quadrant D | 12,497,260 | 1,736,482 |
| Mode SS | |||
|---|---|---|---|
| Quadrant | BADHDUFLAG | Total packets | Discarded packets |
| A | 0 | 366 | 0 |
| B | 0 | 366 | 0 |
| C | 0 | 366 | 0 |
| D | 0 | 366 | 0 |
| Mode M9 | |||
|---|---|---|---|
| Quadrant | BADHDUFLAG | Total packets | Discarded packets |
| A | 0 | 18 | 0 |
| B | 0 | 18 | 0 |
| C | 0 | 18 | 0 |
| D | 0 | 18 | 0 |
| Mode M0 | |||
|---|---|---|---|
| Quadrant | BADHDUFLAG | Total packets | Discarded packets |
| A | 0 | 36376 | 3 |
| B | 0 | 36930 | 3 |
| C | 0 | 36503 | 3 |
| D | 0 | 49165 | 4 |
| Quadrant | Total seconds | Saturated seconds | Saturation percentage |
|---|---|---|---|
| A | 17977 | 146 | 0.812149% |
| B | 17978 | 163 | 0.906664% |
| C | 17978 | 196 | 1.090221% |
| D | 17977 | 596 | 3.315347% |
Noise dominated data is calculated using 1-second bins in cleaned event files. If a bin has >2000 counts, and if more than 50% of those come from <1% of pixels, then it is considered to be noise-dominated and hence unusable.
| Quadrant | # 1 sec bins | Bins with >0 counts | Bins with >2000 counts | High rate bins dominated by noise | Noise dominated (total time) | Noise dominated (detector-on time) | Marked lightcurve |
|---|---|---|---|---|---|---|---|
| A | 19807 | 17977 | 0 | 0 | 0.00% | 0.00% | 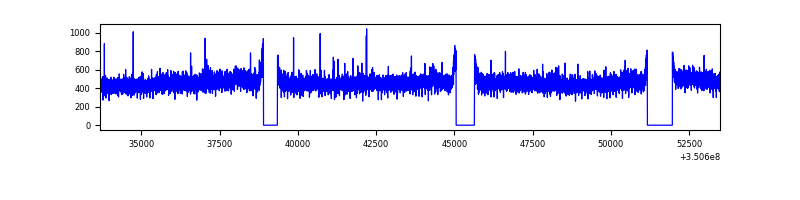 |
| B | 19808 | 17978 | 15 | 15 | 0.08% | 0.08% |  |
| C | 19808 | 17978 | 4 | 4 | 0.02% | 0.02% |  |
| D | 19807 | 17977 | 381 | 381 | 1.92% | 2.12% | 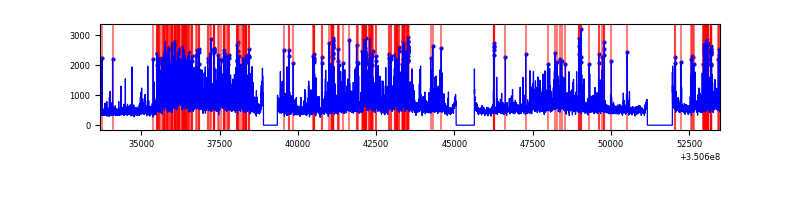 |
Top three noisy pixels from each quadrant. If the there are fewer than three noisy pixels in the level2.evt file, extra rows are filled as -1
| Pixel properties | Quadrant properties | ||||||
|---|---|---|---|---|---|---|---|
| Quadrant | DetID | PixID | Counts | Sigma | Mean | Median | Sigma |
| A | 6 | 16 | 46824 | 105.35 | 2114 | 2066 | 424.8 |
| A | 13 | 254 | 31535 | 69.36 | 2114 | 2066 | 424.8 |
| A | 3 | 137 | 21214 | 45.07 | 2114 | 2066 | 424.8 |
| B | 10 | 245 | 103756 | 257.01 | 2099 | 2043 | 395.8 |
| B | 12 | 111 | 49968 | 121.1 | 2099 | 2043 | 395.8 |
| B | 11 | 111 | 45441 | 109.66 | 2099 | 2043 | 395.8 |
| C | 14 | 238 | 327619 | 688.21 | 2025 | 2034 | 473.1 |
| C | 3 | 233 | 91167 | 188.41 | 2025 | 2034 | 473.1 |
| C | 2 | 16 | 42877 | 86.33 | 2025 | 2034 | 473.1 |
| D | 1 | 52 | 2916563 | 6070.14 | 2021 | 1960 | 480.2 |
| D | 8 | 195 | 1510672 | 3142.14 | 2021 | 1960 | 480.2 |
| D | 2 | 250 | 216269 | 446.33 | 2021 | 1960 | 480.2 |
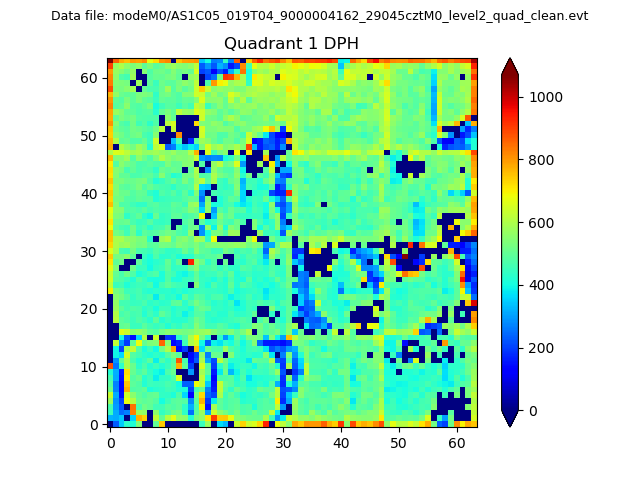
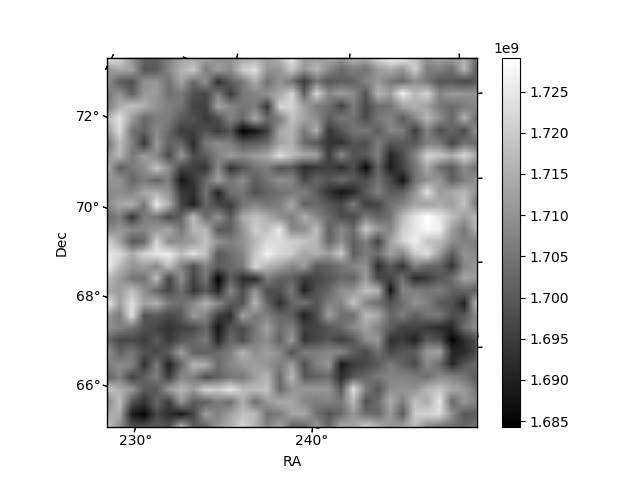
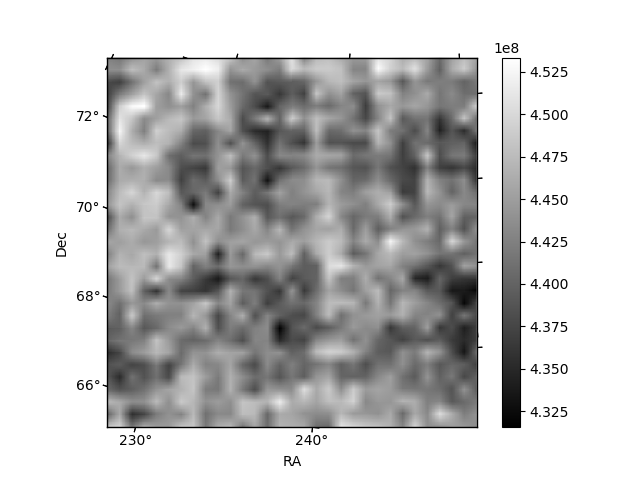
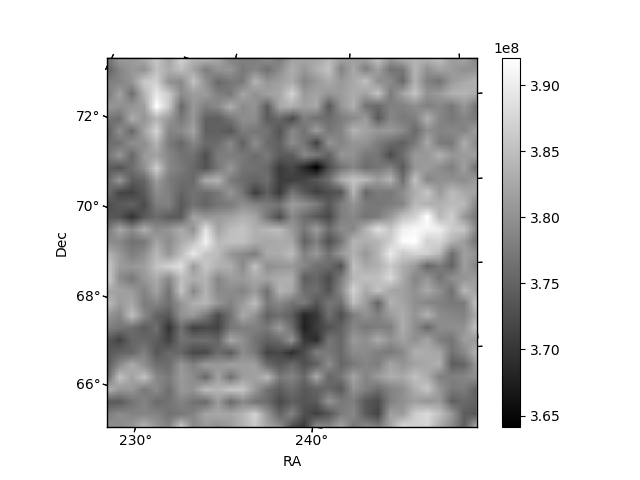
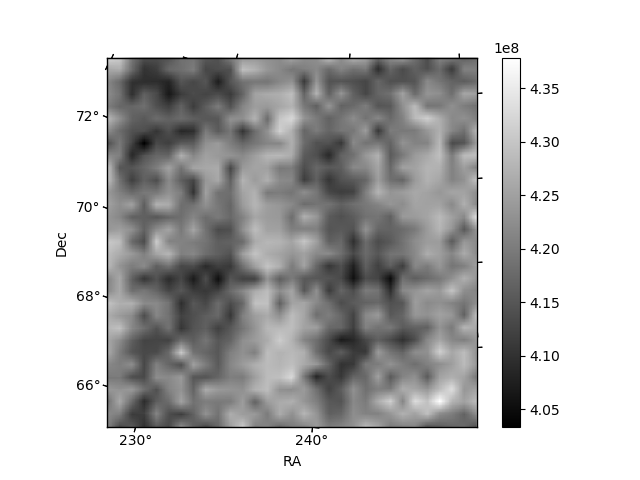
Histogram calculated using DETX and DETY for each event in the final _common_clean file
| Quadrant A |  |
 |
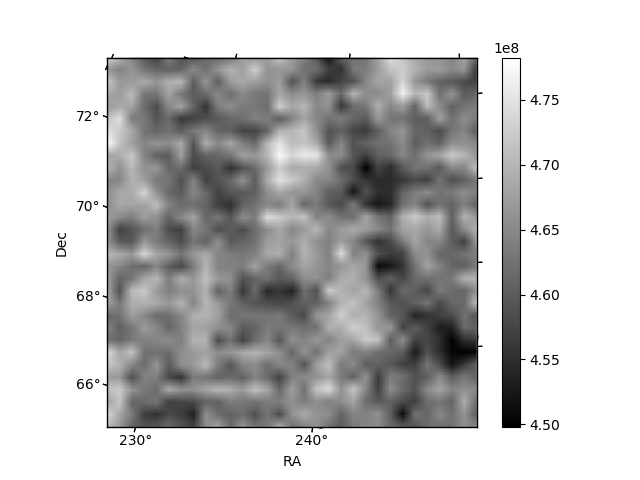
Quadrant B |
|---|---|---|---|
| Quadrant D | 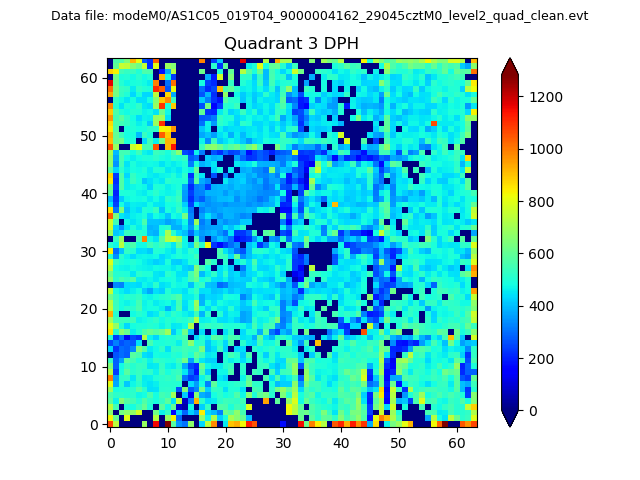 |
 |
Quadrant C |
| Plot type | Count rate plots | Images |
|---|---|---|
| Comparison with Poisson distribution Blue bars denote a histogram of data divided into 1 sec bins. Red curve is a Poisson curve with rate = median count rate of data. |
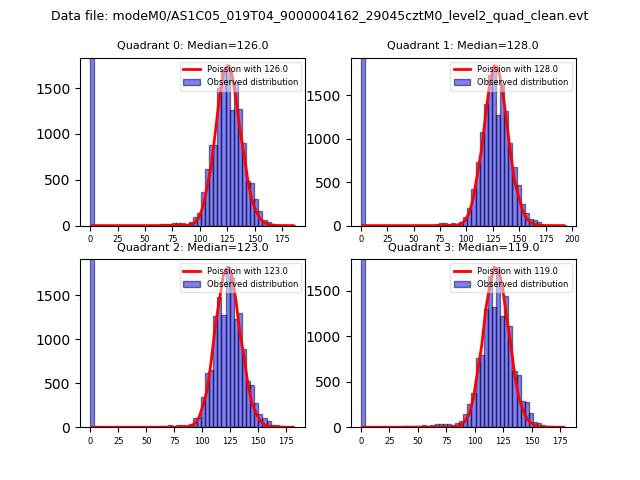 |
 |
| Quadrant-wise count rates Data is divided into 100 sec bins |
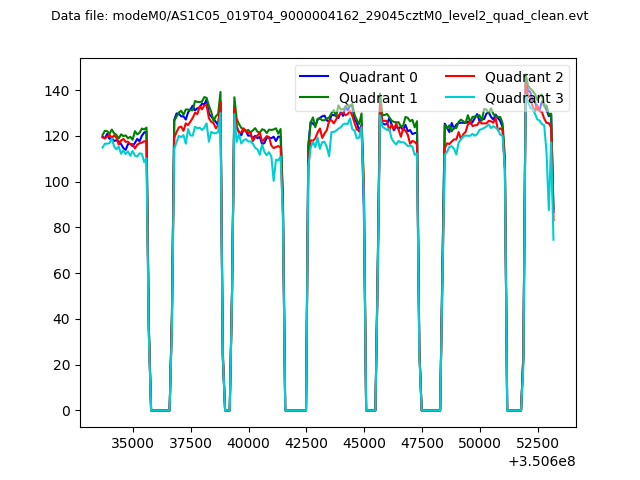 |
|
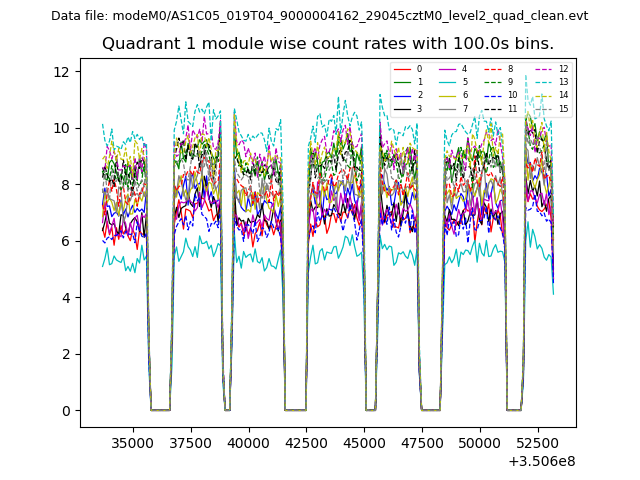
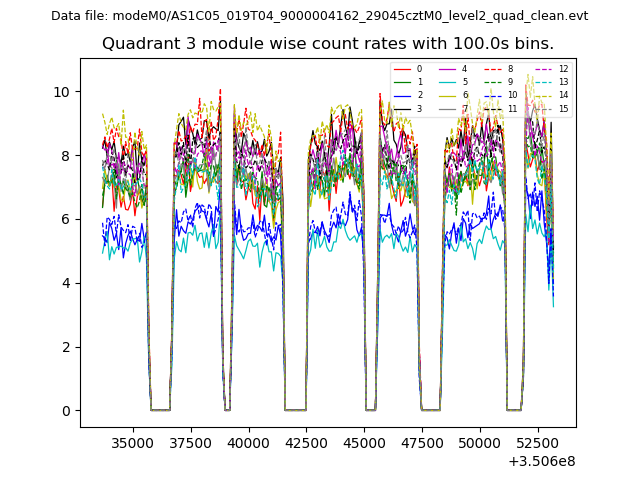
| Module-wise count rates for Quadrant A Data is divided into 100 sec bins |
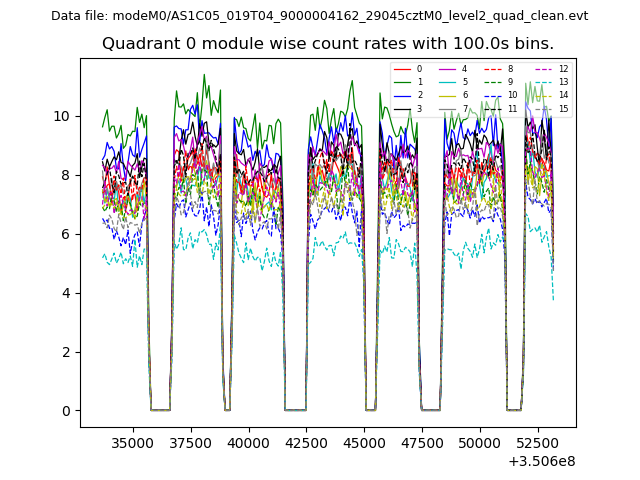 |
 |
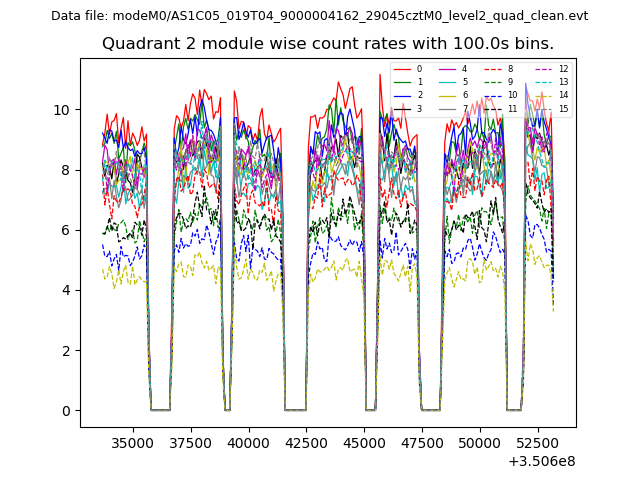
| Module-wise count rates for Quadrant B Data is divided into 100 sec bins |
 |
 |
| Module-wise count rates for Quadrant C Data is divided into 100 sec bins |
 |
 |
| Module-wise count rates for Quadrant D Data is divided into 100 sec bins |
 |
 |
| Parameter | Plot |
|---|---|
| CZT HV Monitor | 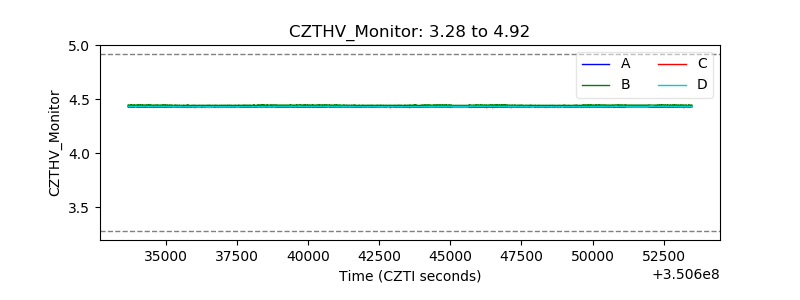 |
| D_VDD | 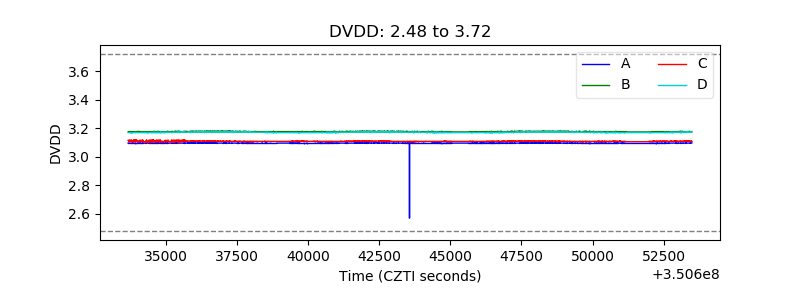 |
| Temperature 1 | 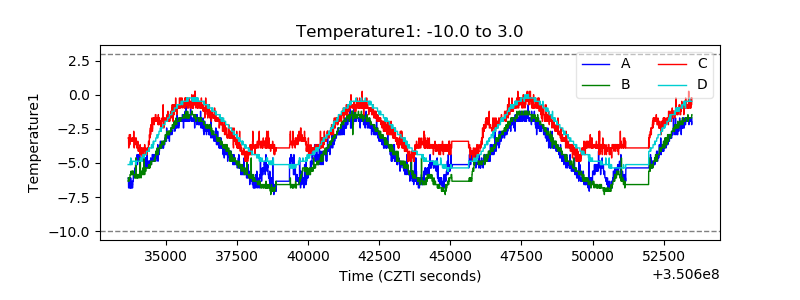 |
| Veto HV Monitor | 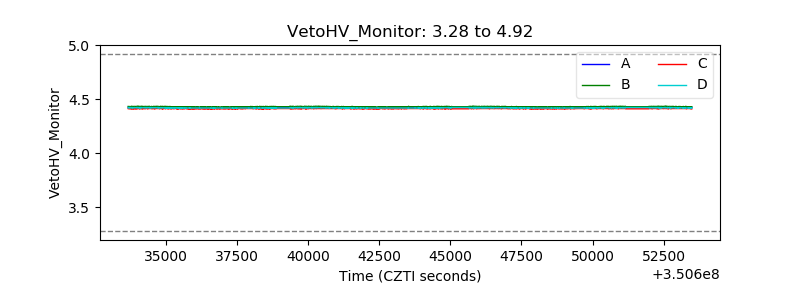 |
| Veto LLD | 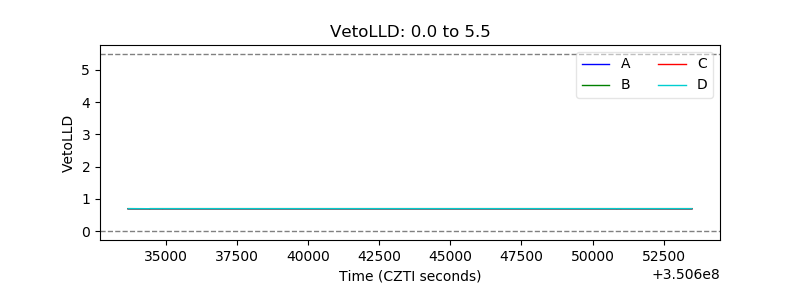 |
| Alpha Counter | 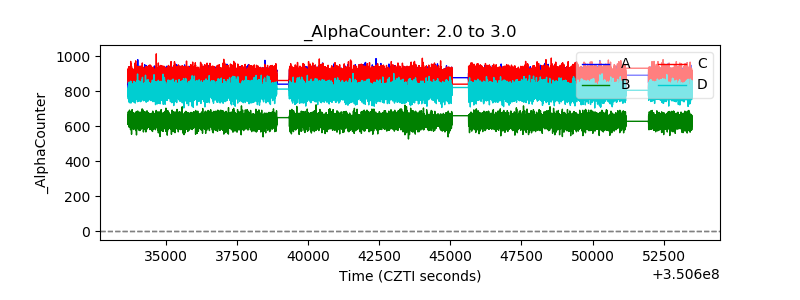 |
| _CPM_Rate | 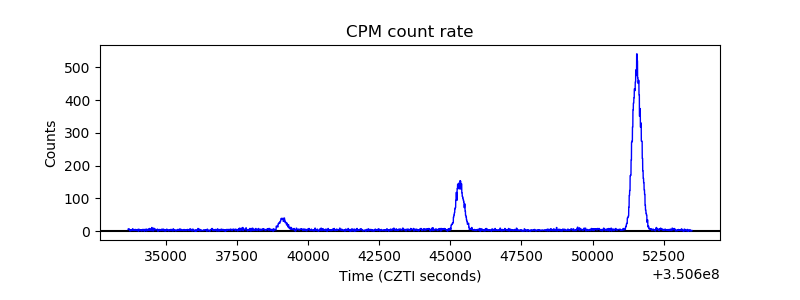 |
| CZT Counter | 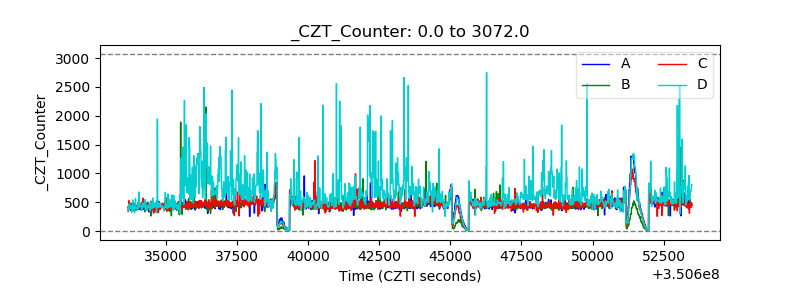 |
| +2.5 Volts monitor |  |
| +5 Volts monitor |  |
| _ROLL_ROT | 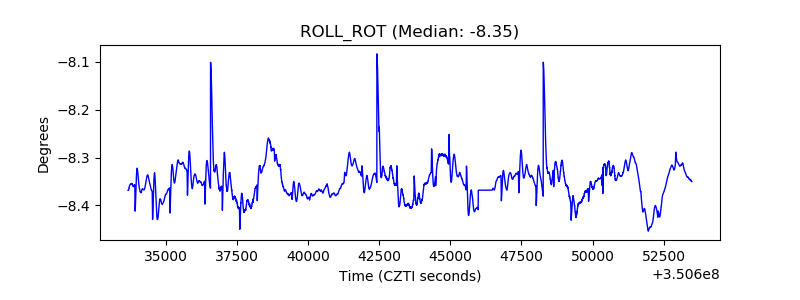 |
| _Roll_DEC | 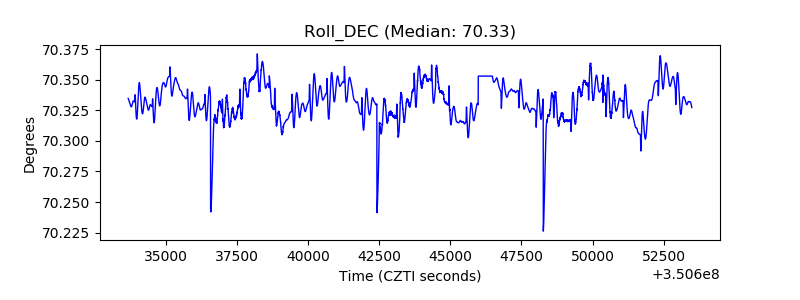 |
| _Roll_RA | 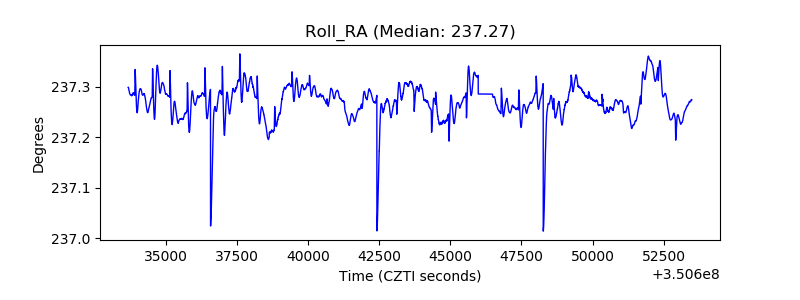 |
| Veto Counter | 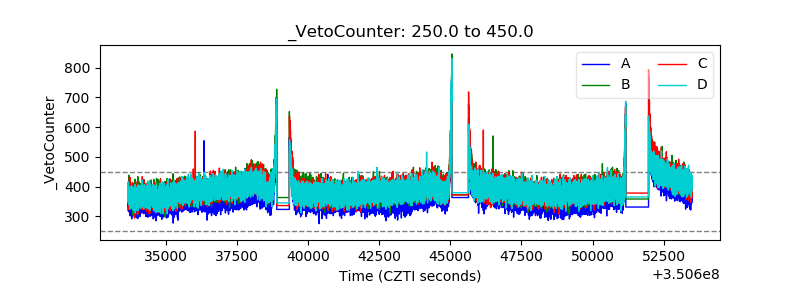 |