| Param | Original file | Final file |
|---|---|---|
| Filename | modeM0/AS1C05_019T04_9000004162_29049cztM0_level2.evt | modeM0/AS1C05_019T04_9000004162_29049cztM0_level2_quad_clean.evt |
| Size (bytes) | 492,048,000 | 94,870,080 |
| Size | 469.3 MB | 90.5 MB |
| Events in quadrant A | 3,299,516 | 614,639 |
| Events in quadrant B | 3,420,133 | 624,072 |
| Events in quadrant C | 3,378,523 | 606,923 |
| Events in quadrant D | 4,375,387 | 587,042 |
| Mode SS | |||
|---|---|---|---|
| Quadrant | BADHDUFLAG | Total packets | Discarded packets |
| A | 0 | 130 | 0 |
| B | 0 | 130 | 0 |
| C | 0 | 130 | 0 |
| D | 0 | 130 | 0 |
| Mode M9 | |||
|---|---|---|---|
| Quadrant | BADHDUFLAG | Total packets | Discarded packets |
| A | 0 | 12 | 0 |
| B | 0 | 12 | 0 |
| C | 0 | 12 | 0 |
| D | 0 | 12 | 0 |
| Mode M0 | |||
|---|---|---|---|
| Quadrant | BADHDUFLAG | Total packets | Discarded packets |
| A | 0 | 14216 | 2 |
| B | 0 | 14413 | 2 |
| C | 0 | 14305 | 2 |
| D | 0 | 17392 | 4 |
| Quadrant | Total seconds | Saturated seconds | Saturation percentage |
|---|---|---|---|
| A | 6305 | 57 | 0.904044% |
| B | 6306 | 93 | 1.474786% |
| C | 6306 | 120 | 1.902950% |
| D | 6305 | 105 | 1.665345% |
Noise dominated data is calculated using 1-second bins in cleaned event files. If a bin has >2000 counts, and if more than 50% of those come from <1% of pixels, then it is considered to be noise-dominated and hence unusable.
| Quadrant | # 1 sec bins | Bins with >0 counts | Bins with >2000 counts | High rate bins dominated by noise | Noise dominated (total time) | Noise dominated (detector-on time) | Marked lightcurve |
|---|---|---|---|---|---|---|---|
| A | 7535 | 6305 | 0 | 0 | 0.00% | 0.00% | 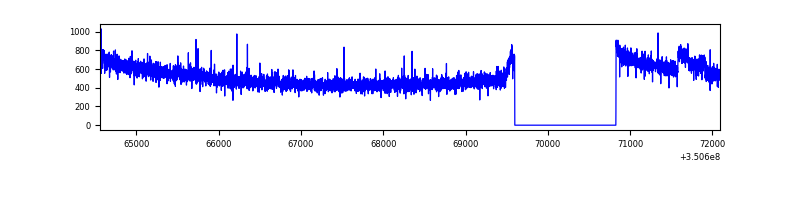 |
| B | 7536 | 6306 | 7 | 7 | 0.09% | 0.11% | 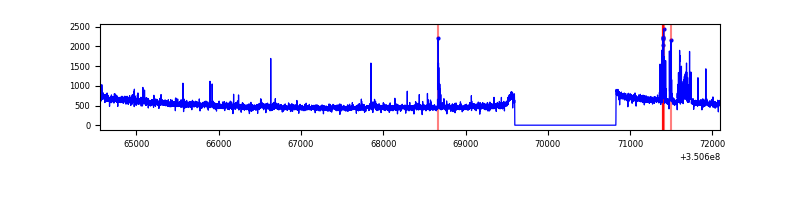 |
| C | 7536 | 6306 | 0 | 0 | 0.00% | 0.00% | 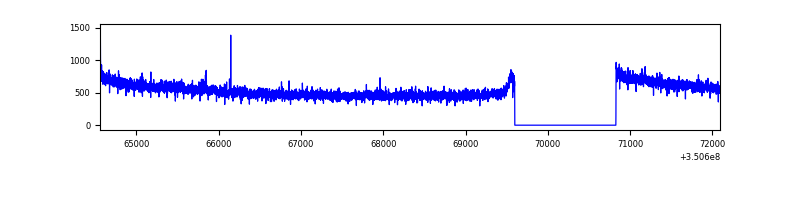 |
| D | 7535 | 6305 | 37 | 37 | 0.49% | 0.59% | 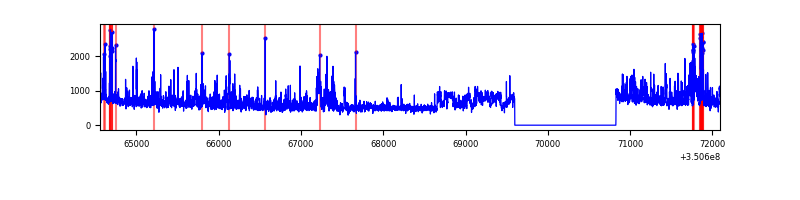 |
Top three noisy pixels from each quadrant. If the there are fewer than three noisy pixels in the level2.evt file, extra rows are filled as -1
| Pixel properties | Quadrant properties | ||||||
|---|---|---|---|---|---|---|---|
| Quadrant | DetID | PixID | Counts | Sigma | Mean | Median | Sigma |
| A | 15 | 174 | 43565 | 255.09 | 841 | 823 | 167.6 |
| A | 13 | 254 | 10803 | 59.56 | 841 | 823 | 167.6 |
| A | 3 | 137 | 7348 | 38.94 | 841 | 823 | 167.6 |
| B | 10 | 245 | 126780 | 822.04 | 835 | 817 | 153.2 |
| B | 12 | 111 | 17864 | 111.25 | 835 | 817 | 153.2 |
| B | 11 | 111 | 16435 | 101.92 | 835 | 817 | 153.2 |
| C | 14 | 238 | 133976 | 708.91 | 819 | 827 | 187.8 |
| C | 3 | 233 | 26790 | 138.23 | 819 | 827 | 187.8 |
| C | 2 | 114 | 15663 | 78.99 | 819 | 827 | 187.8 |
| D | 8 | 195 | 866253 | 4464.17 | 822 | 802 | 193.9 |
| D | 1 | 52 | 218219 | 1121.48 | 822 | 802 | 193.9 |
| D | 2 | 250 | 101099 | 517.35 | 822 | 802 | 193.9 |
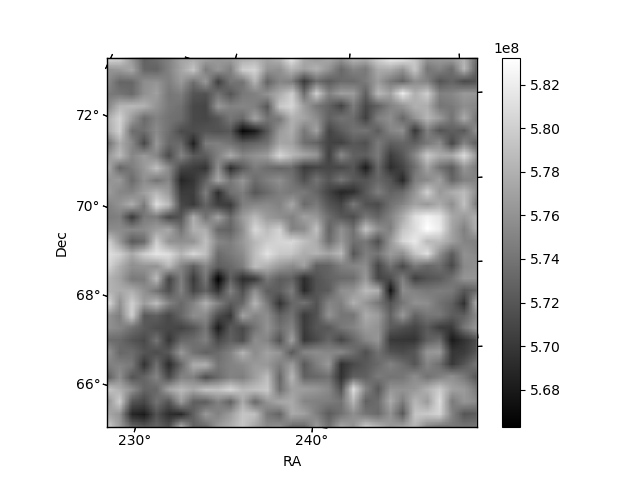
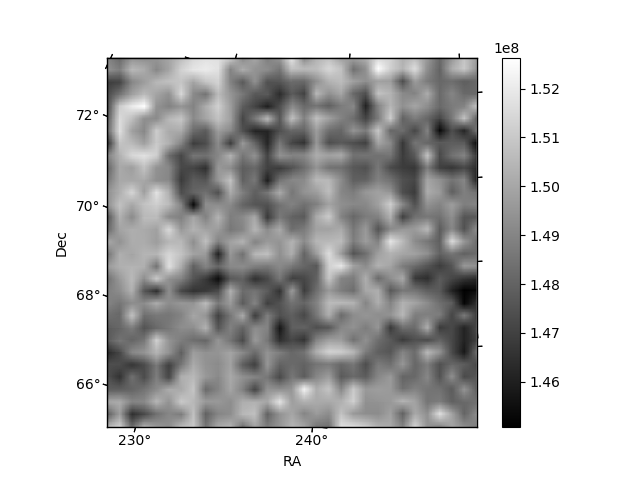
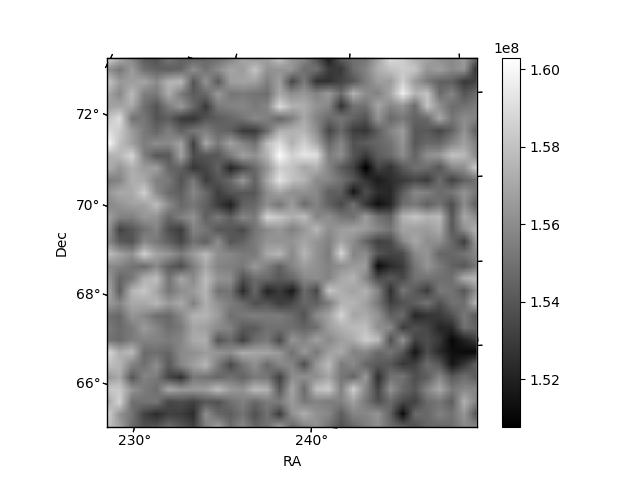
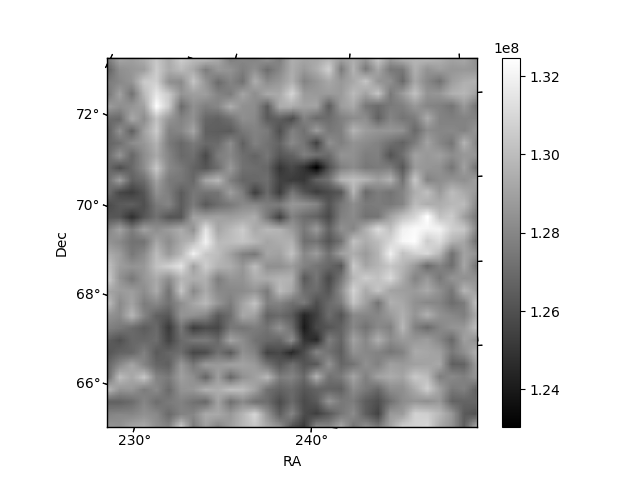
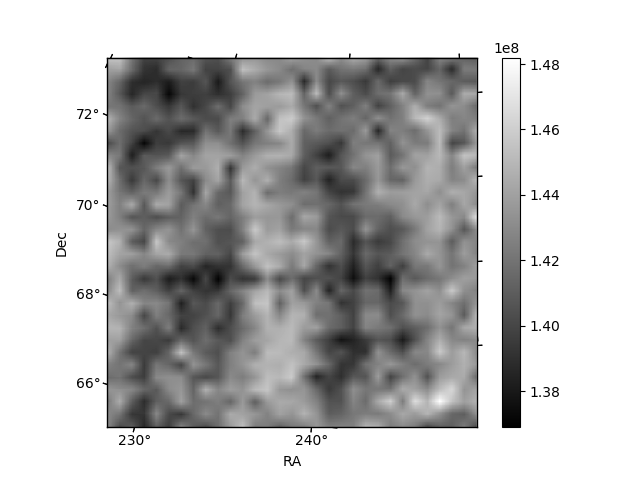
Histogram calculated using DETX and DETY for each event in the final _common_clean file
| Quadrant A | 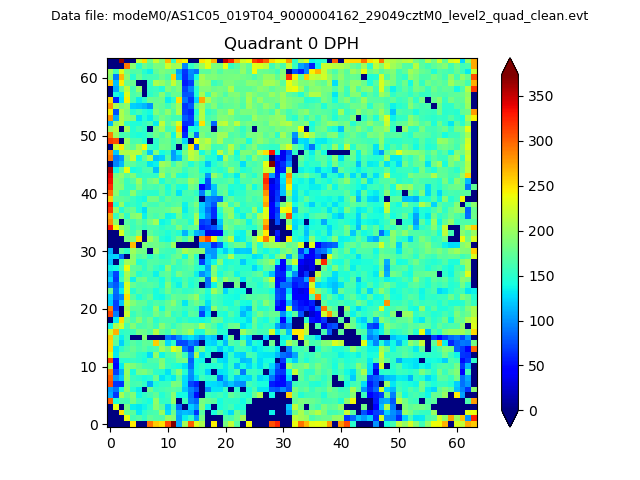 |
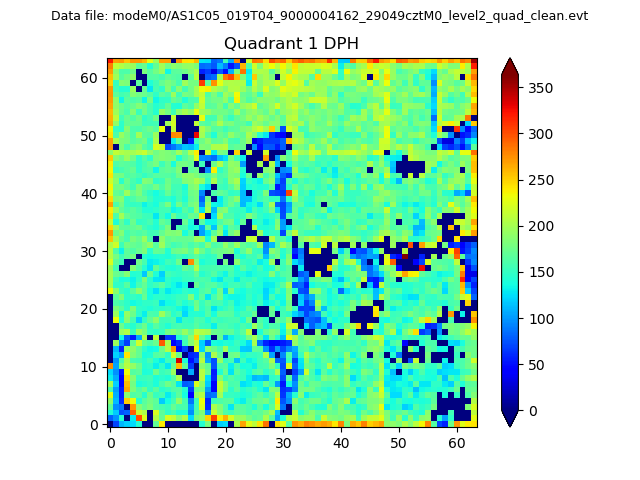 |
Quadrant B |
|---|---|---|---|
| Quadrant D | 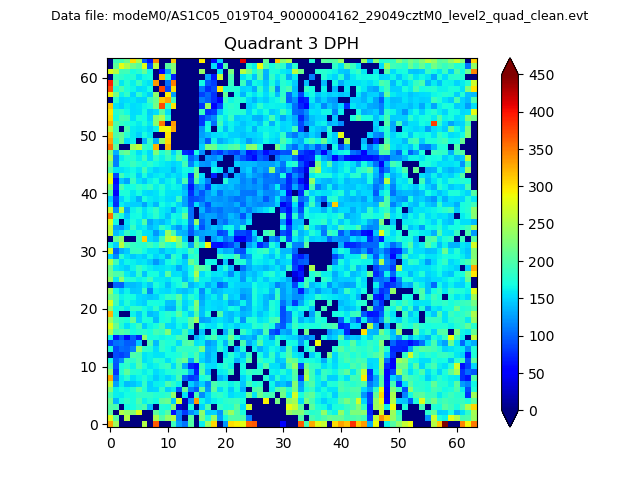 |
 |
Quadrant C |
| Plot type | Count rate plots | Images |
|---|---|---|
| Comparison with Poisson distribution Blue bars denote a histogram of data divided into 1 sec bins. Red curve is a Poisson curve with rate = median count rate of data. |
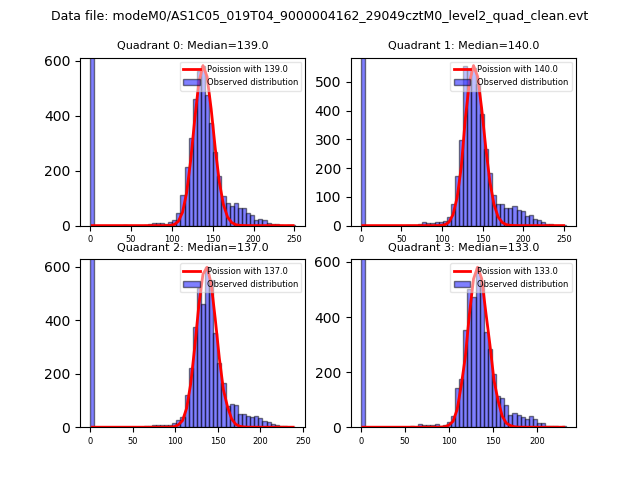 |
 |
| Quadrant-wise count rates Data is divided into 100 sec bins |
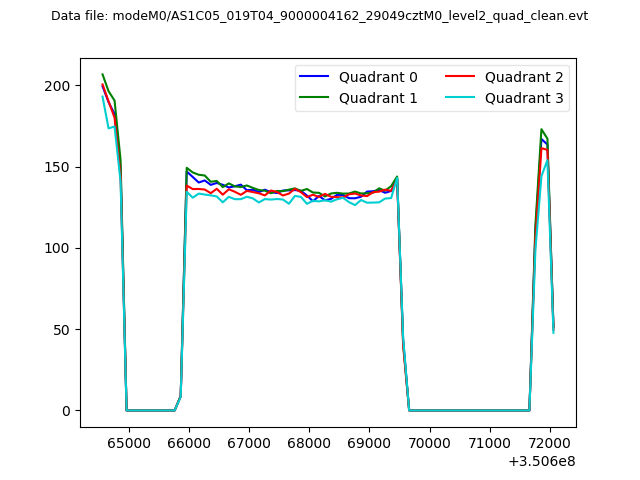 |
|
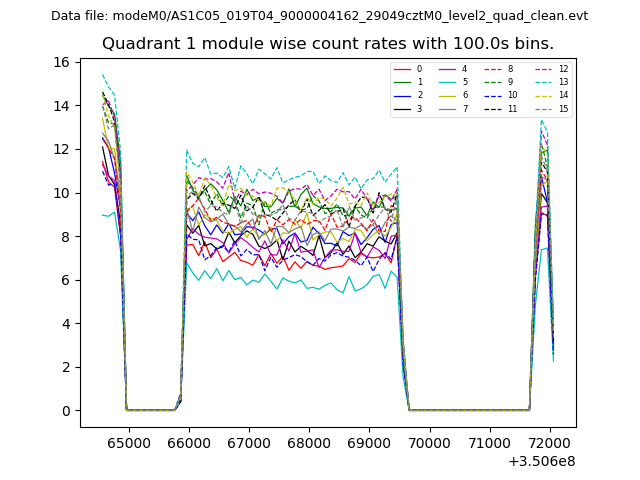
| Module-wise count rates for Quadrant A Data is divided into 100 sec bins |
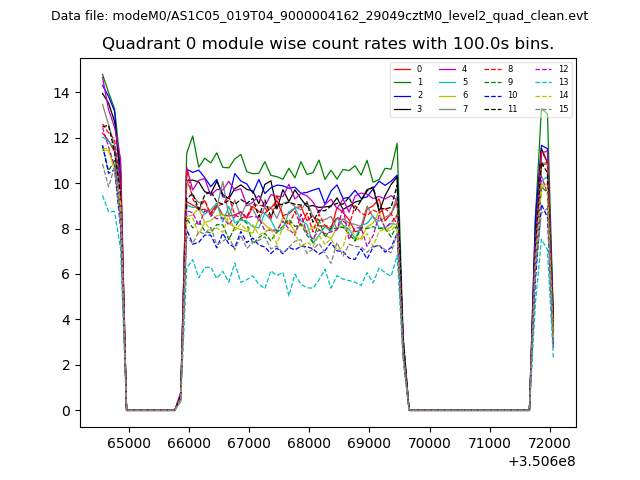 |
 |
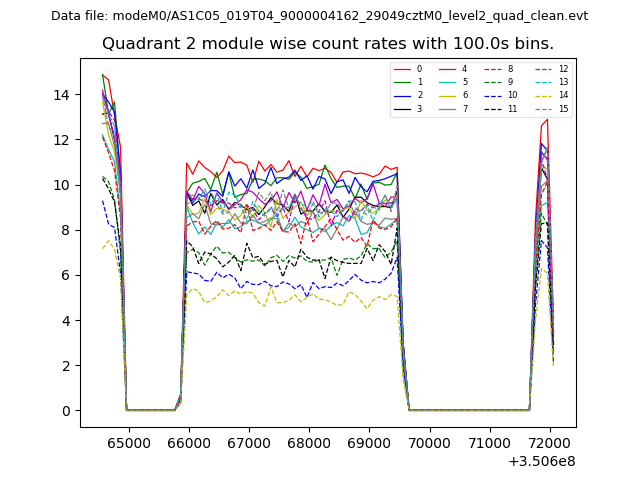
| Module-wise count rates for Quadrant B Data is divided into 100 sec bins |
 |
 |
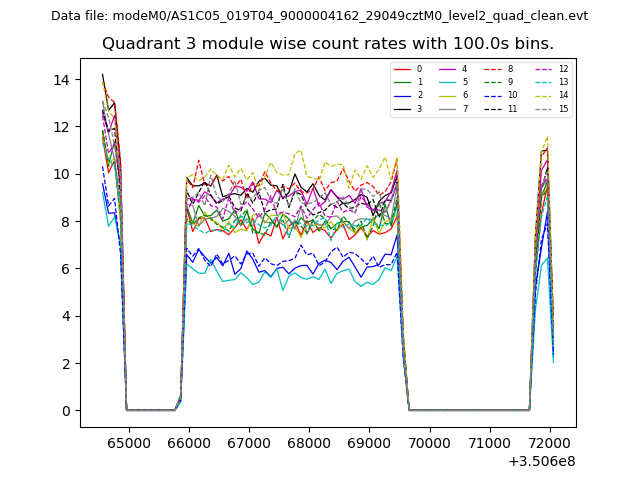
| Module-wise count rates for Quadrant C Data is divided into 100 sec bins |
 |
 |
| Module-wise count rates for Quadrant D Data is divided into 100 sec bins |
 |
 |
| Parameter | Plot |
|---|---|
| CZT HV Monitor | 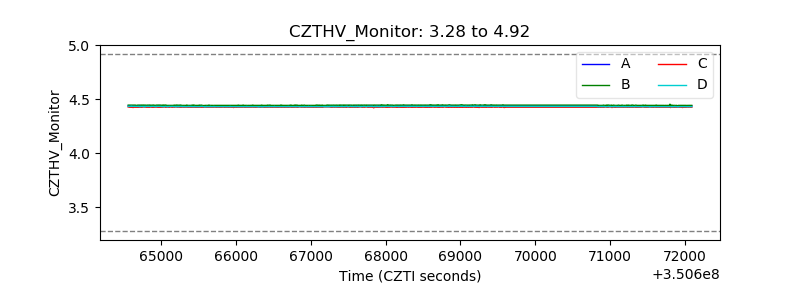 |
| D_VDD | 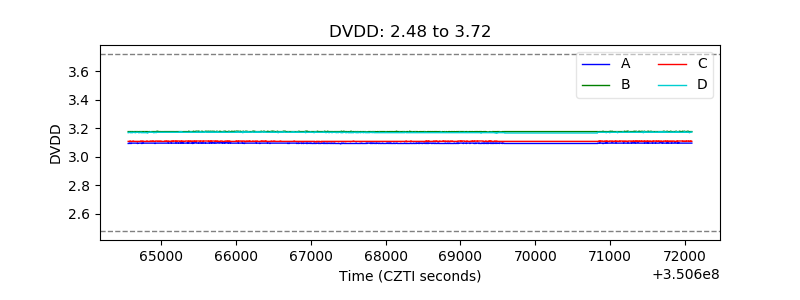 |
| Temperature 1 | 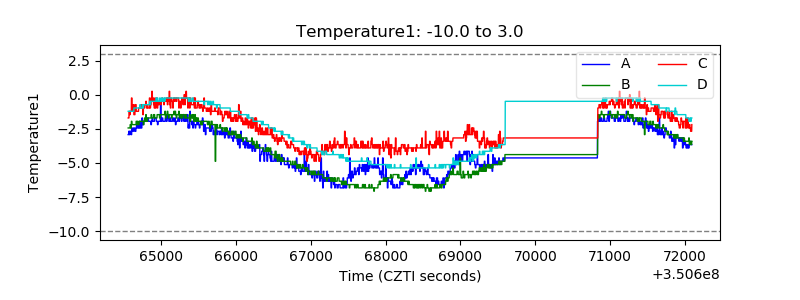 |
| Veto HV Monitor | 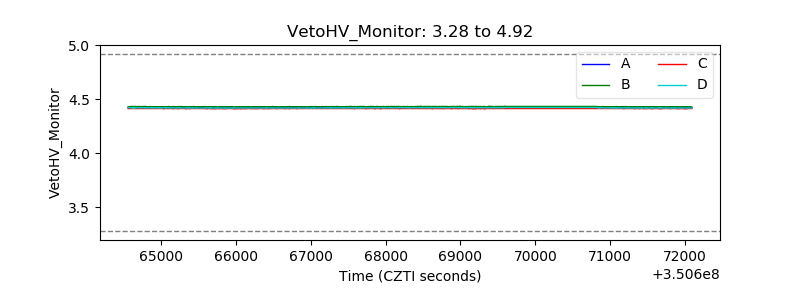 |
| Veto LLD | 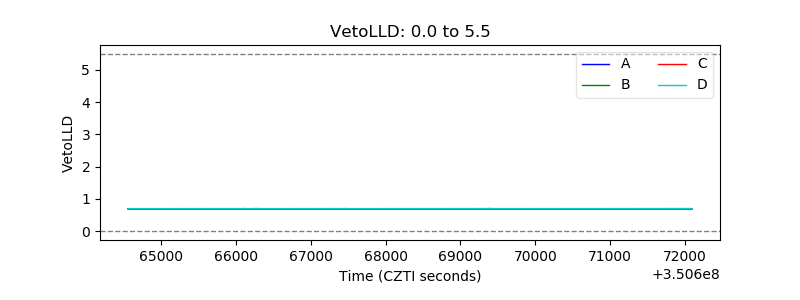 |
| Alpha Counter | 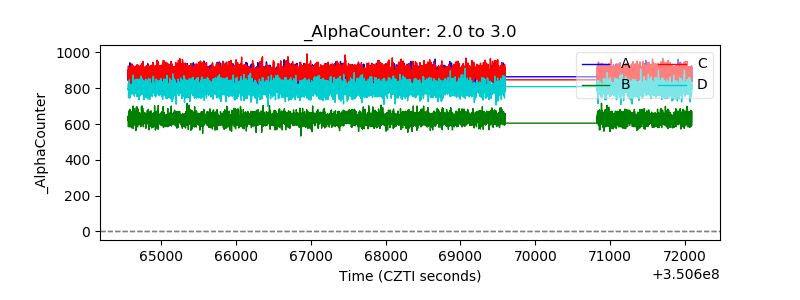 |
| _CPM_Rate | 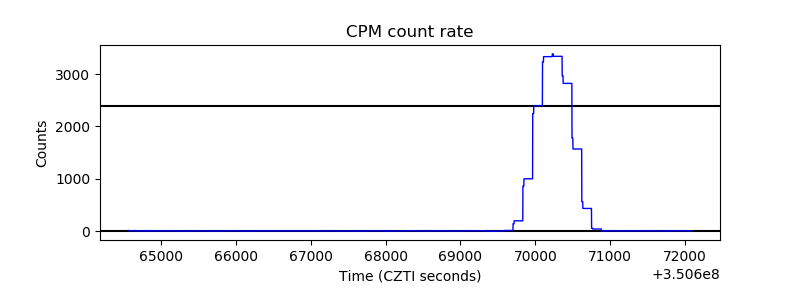 |
| CZT Counter | 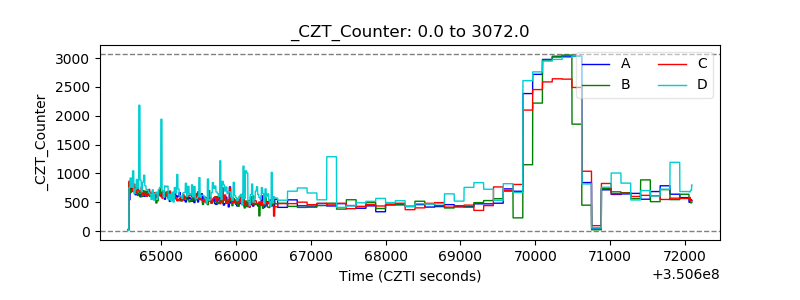 |
| +2.5 Volts monitor |  |
| +5 Volts monitor |  |
| _ROLL_ROT | 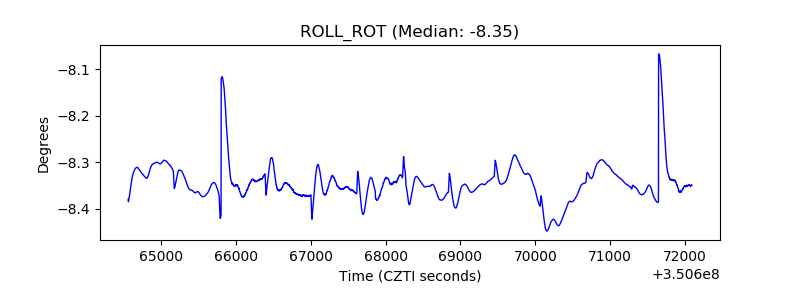 |
| _Roll_DEC | 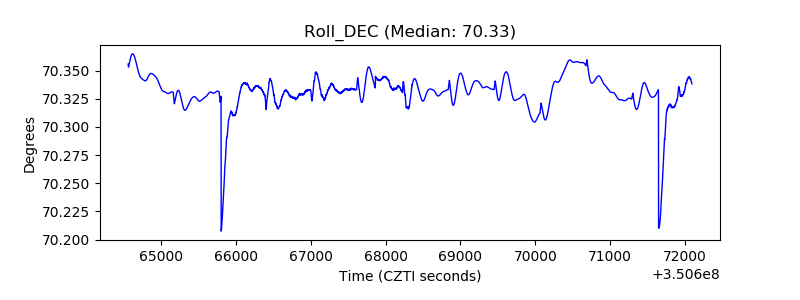 |
| _Roll_RA | 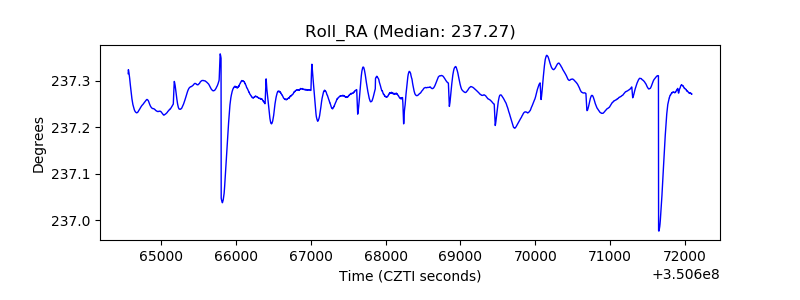 |
| Veto Counter | 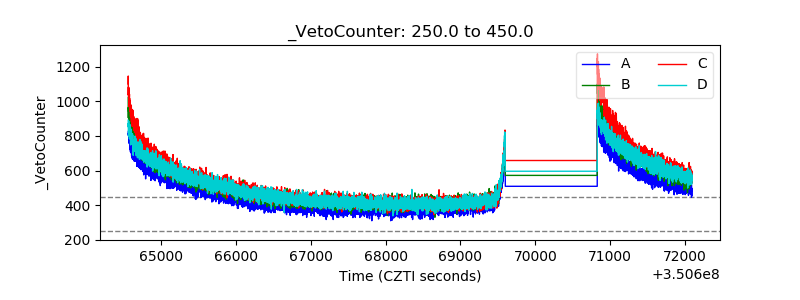 |