| Param | Original file | Final file |
|---|---|---|
| Filename | modeM0/AS1C05_019T04_9000004162_29050cztM0_level2.evt | modeM0/AS1C05_019T04_9000004162_29050cztM0_level2_quad_clean.evt |
| Size (bytes) | 487,874,880 | 103,881,600 |
| Size | 465.3 MB | 99.1 MB |
| Events in quadrant A | 3,281,327 | 681,487 |
| Events in quadrant B | 3,404,965 | 699,952 |
| Events in quadrant C | 3,391,516 | 680,580 |
| Events in quadrant D | 4,283,124 | 657,632 |
| Mode SS | |||
|---|---|---|---|
| Quadrant | BADHDUFLAG | Total packets | Discarded packets |
| A | 0 | 124 | 0 |
| B | 0 | 124 | 0 |
| C | 0 | 124 | 0 |
| D | 0 | 124 | 0 |
| Mode M9 | |||
|---|---|---|---|
| Quadrant | BADHDUFLAG | Total packets | Discarded packets |
| A | 0 | 15 | 0 |
| B | 0 | 16 | 0 |
| C | 0 | 16 | 0 |
| D | 0 | 16 | 0 |
| Mode M0 | |||
|---|---|---|---|
| Quadrant | BADHDUFLAG | Total packets | Discarded packets |
| A | 0 | 13983 | 2 |
| B | 0 | 14227 | 3 |
| C | 0 | 14218 | 2 |
| D | 0 | 16962 | 2 |
| Quadrant | Total seconds | Saturated seconds | Saturation percentage |
|---|---|---|---|
| A | 6110 | 51 | 0.834697% |
| B | 6109 | 82 | 1.342282% |
| C | 6109 | 127 | 2.078900% |
| D | 6109 | 123 | 2.013423% |
Noise dominated data is calculated using 1-second bins in cleaned event files. If a bin has >2000 counts, and if more than 50% of those come from <1% of pixels, then it is considered to be noise-dominated and hence unusable.
| Quadrant | # 1 sec bins | Bins with >0 counts | Bins with >2000 counts | High rate bins dominated by noise | Noise dominated (total time) | Noise dominated (detector-on time) | Marked lightcurve |
|---|---|---|---|---|---|---|---|
| A | 7435 | 6110 | 0 | 0 | 0.00% | 0.00% | 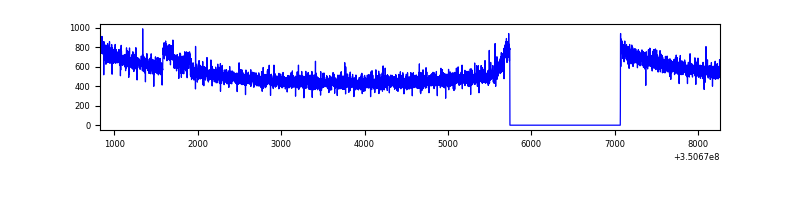 |
| B | 7434 | 6109 | 6 | 6 | 0.08% | 0.10% | 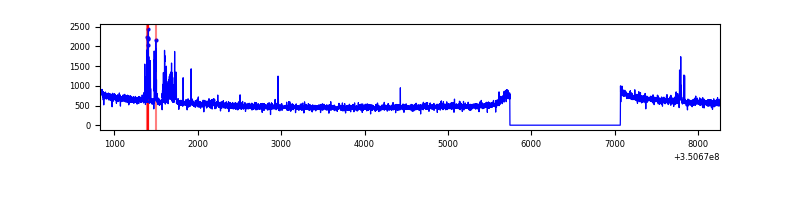 |
| C | 7434 | 6109 | 0 | 0 | 0.00% | 0.00% | 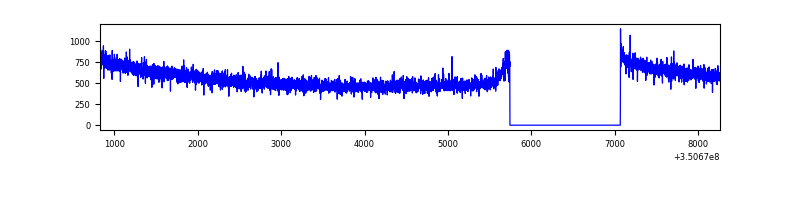 |
| D | 7434 | 6109 | 59 | 59 | 0.79% | 0.97% | 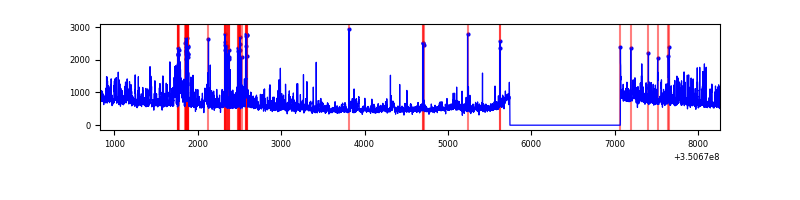 |
Top three noisy pixels from each quadrant. If the there are fewer than three noisy pixels in the level2.evt file, extra rows are filled as -1
| Pixel properties | Quadrant properties | ||||||
|---|---|---|---|---|---|---|---|
| Quadrant | DetID | PixID | Counts | Sigma | Mean | Median | Sigma |
| A | 15 | 174 | 43202 | 255.32 | 837 | 823 | 166.0 |
| A | 6 | 16 | 12949 | 73.05 | 837 | 823 | 166.0 |
| A | 13 | 254 | 10808 | 60.16 | 837 | 823 | 166.0 |
| B | 10 | 245 | 104257 | 677.43 | 838 | 819 | 152.7 |
| B | 5 | 172 | 17371 | 108.4 | 838 | 819 | 152.7 |
| B | 12 | 111 | 17233 | 107.5 | 838 | 819 | 152.7 |
| C | 14 | 238 | 137038 | 723.6 | 825 | 834 | 188.2 |
| C | 3 | 233 | 17560 | 88.86 | 825 | 834 | 188.2 |
| C | 2 | 114 | 15234 | 76.5 | 825 | 834 | 188.2 |
| D | 8 | 195 | 745576 | 3849.44 | 825 | 805 | 193.5 |
| D | 1 | 52 | 266249 | 1371.98 | 825 | 805 | 193.5 |
| D | 2 | 250 | 94909 | 486.39 | 825 | 805 | 193.5 |
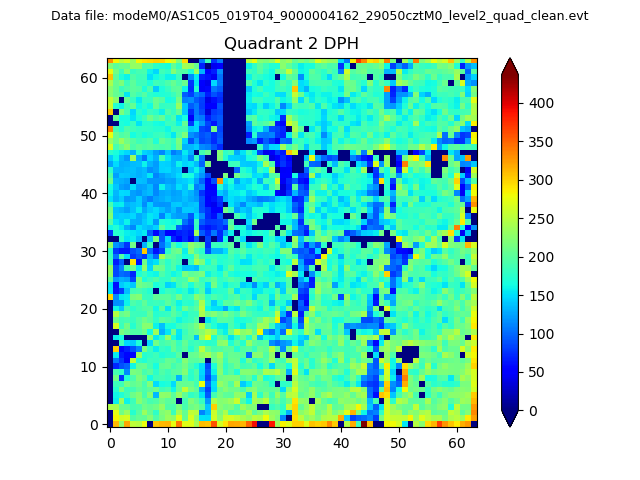
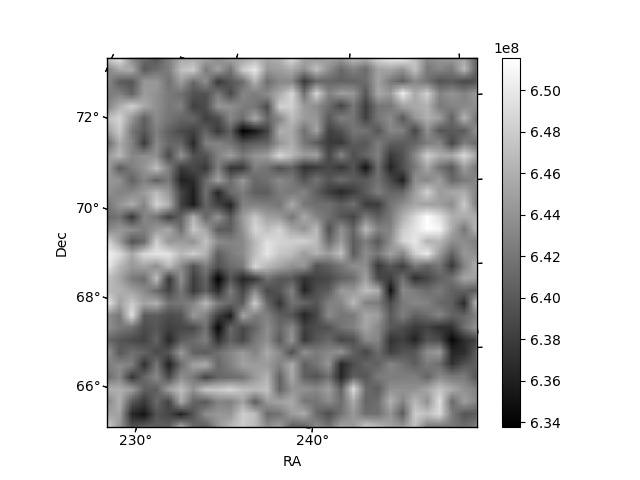
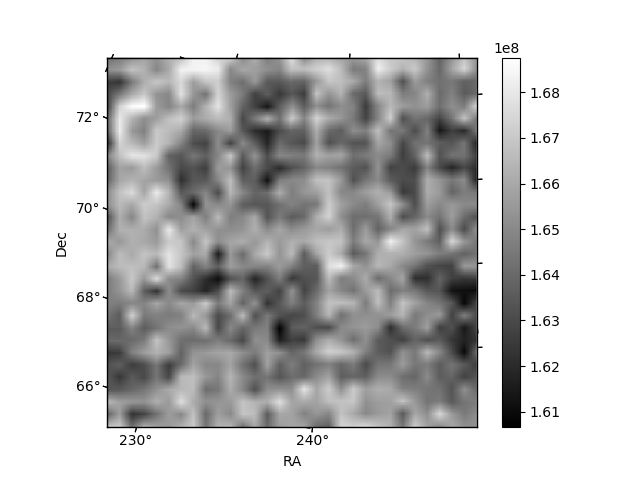
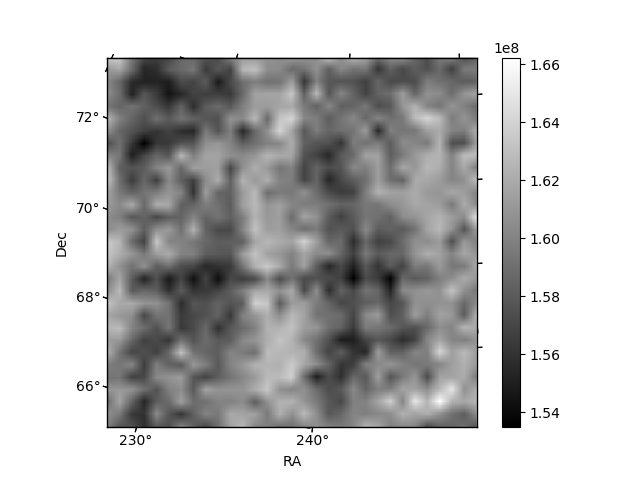
Histogram calculated using DETX and DETY for each event in the final _common_clean file
| Quadrant A | 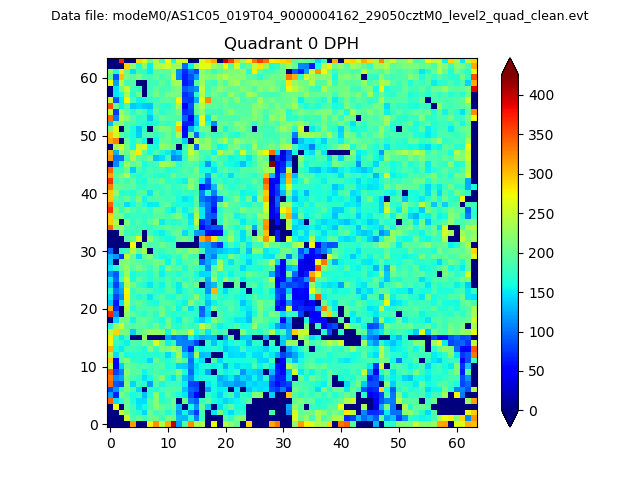 |
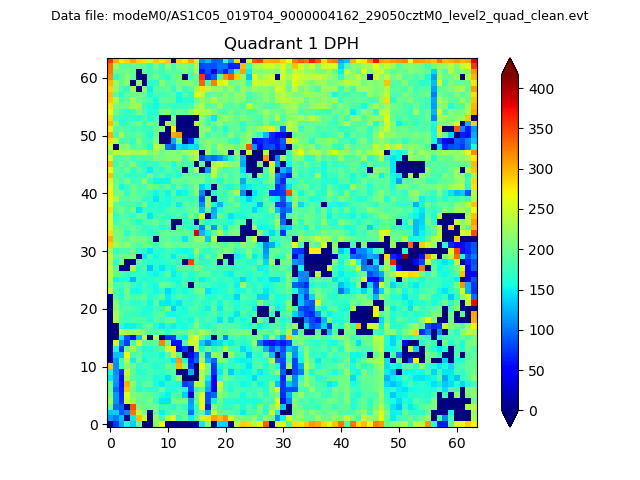 |
Quadrant B |
|---|---|---|---|
| Quadrant D | 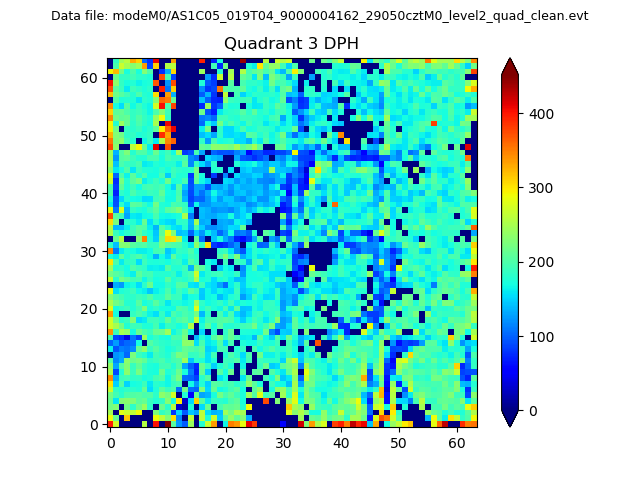 |
 |
Quadrant C |
| Plot type | Count rate plots | Images |
|---|---|---|
| Comparison with Poisson distribution Blue bars denote a histogram of data divided into 1 sec bins. Red curve is a Poisson curve with rate = median count rate of data. |
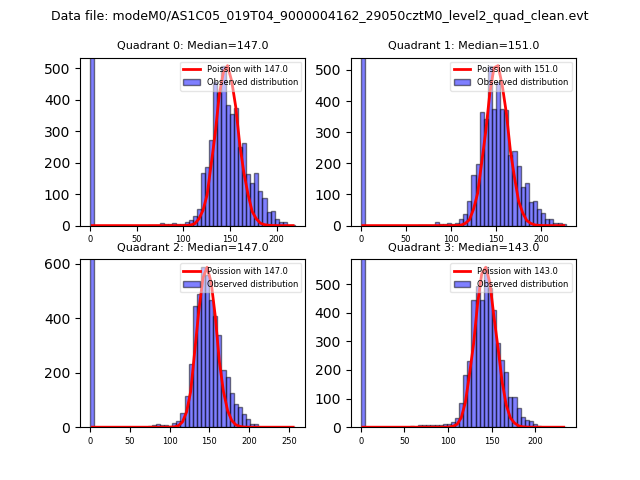 |
 |
| Quadrant-wise count rates Data is divided into 100 sec bins |
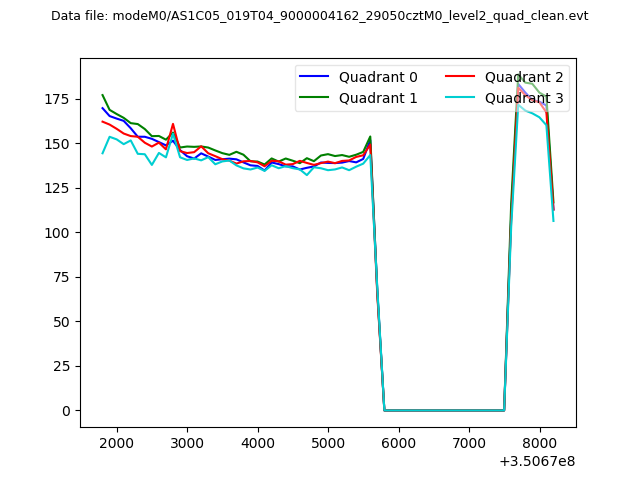 |
|
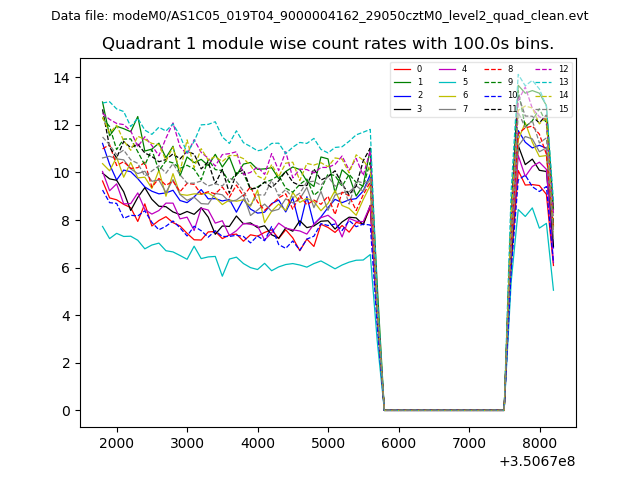
| Module-wise count rates for Quadrant A Data is divided into 100 sec bins |
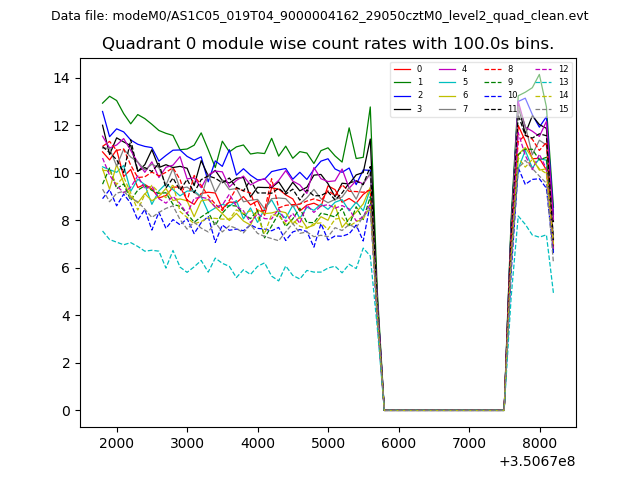 |
 |
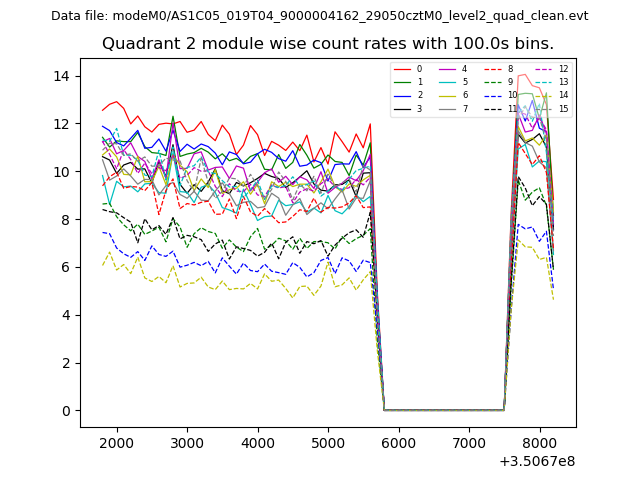
| Module-wise count rates for Quadrant B Data is divided into 100 sec bins |
 |
 |
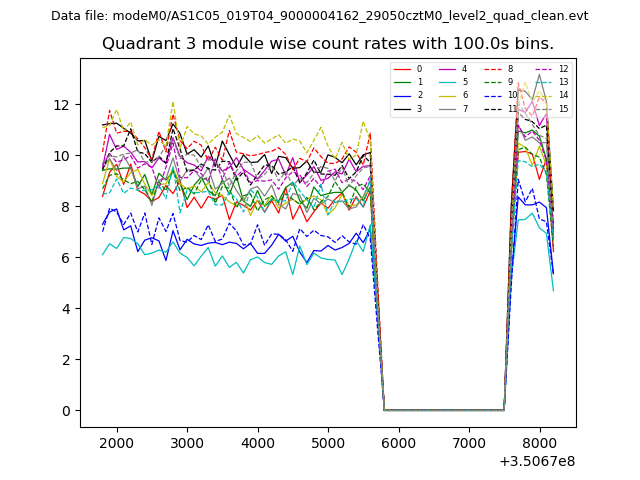
| Module-wise count rates for Quadrant C Data is divided into 100 sec bins |
 |
 |
| Module-wise count rates for Quadrant D Data is divided into 100 sec bins |
 |
 |
| Parameter | Plot |
|---|---|
| CZT HV Monitor | 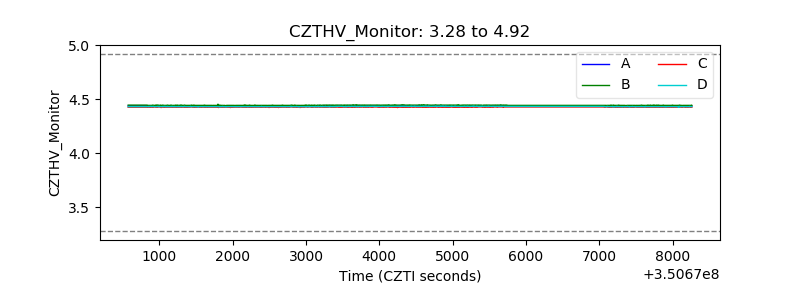 |
| D_VDD | 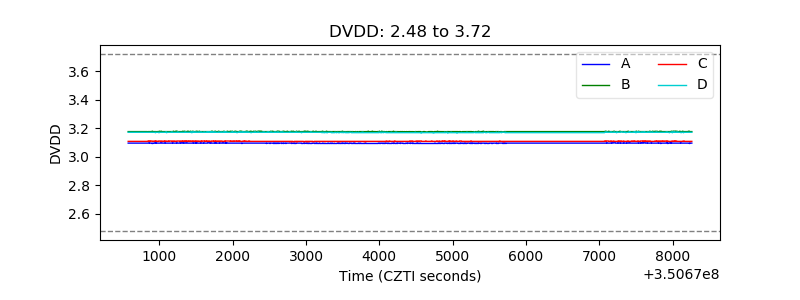 |
| Temperature 1 | 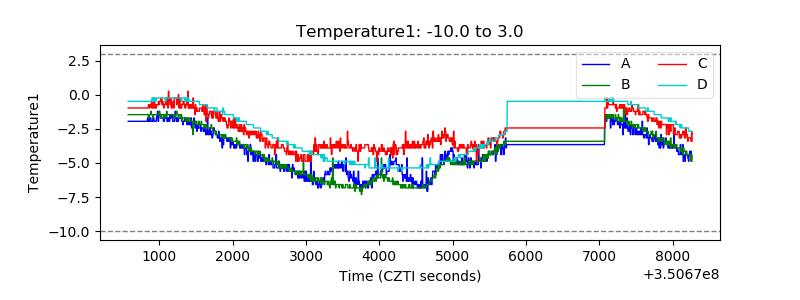 |
| Veto HV Monitor | 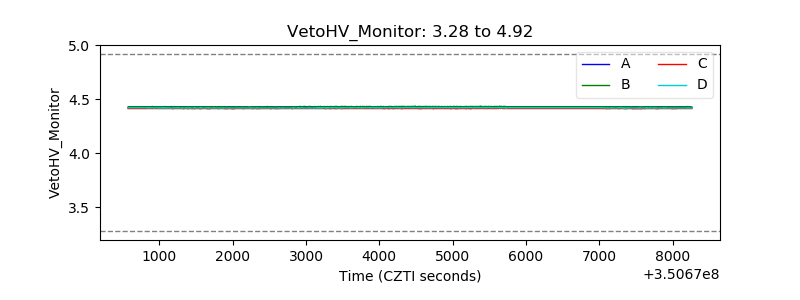 |
| Veto LLD | 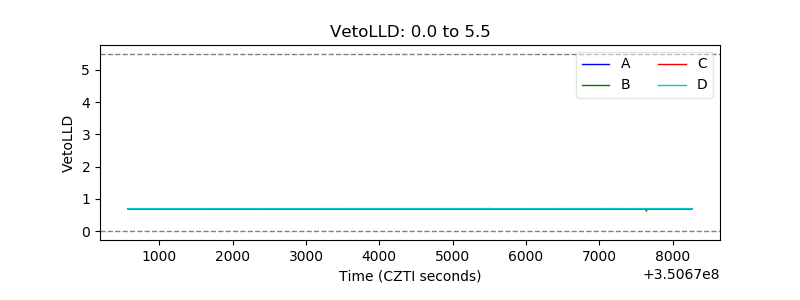 |
| Alpha Counter | 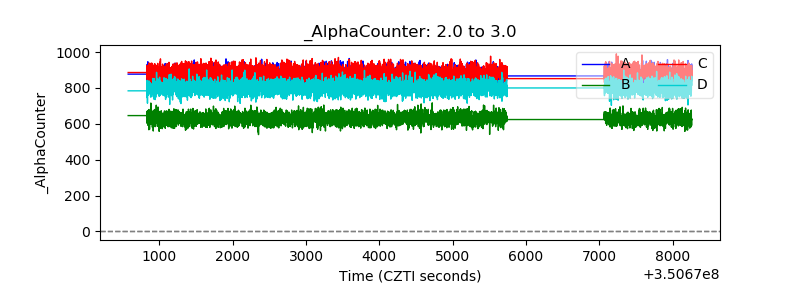 |
| _CPM_Rate | 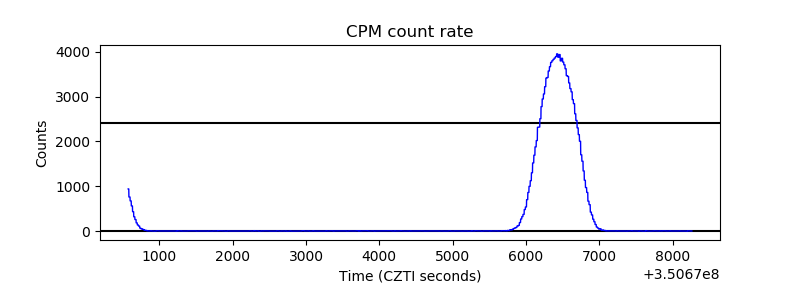 |
| CZT Counter | 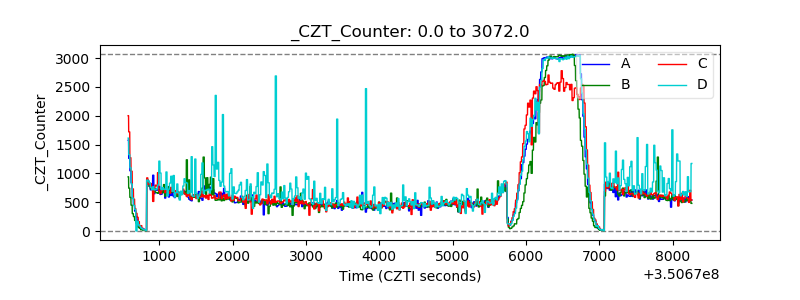 |
| +2.5 Volts monitor | 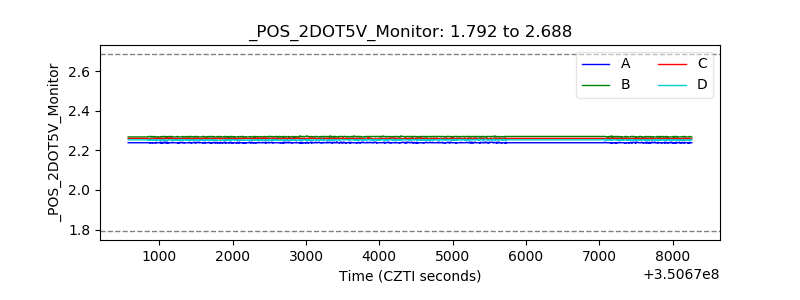 |
| +5 Volts monitor |  |
| _ROLL_ROT | 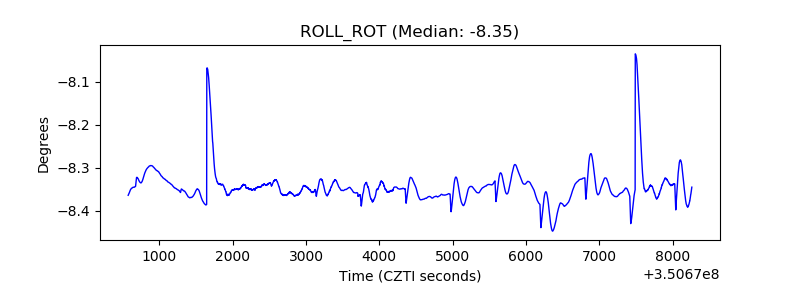 |
| _Roll_DEC | 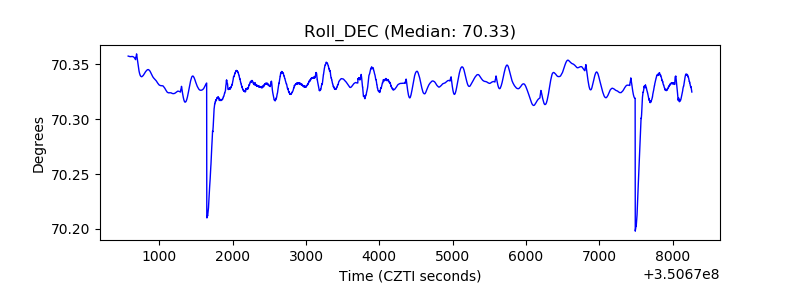 |
| _Roll_RA | 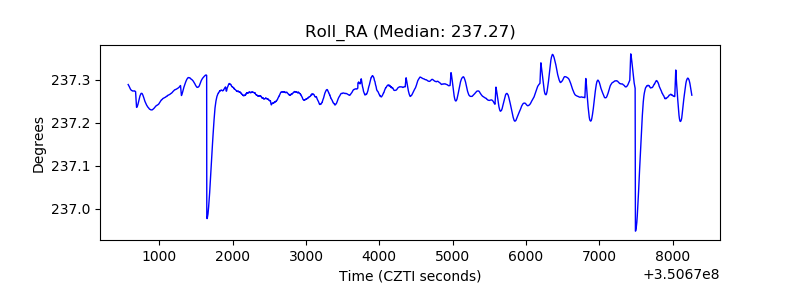 |
| Veto Counter | 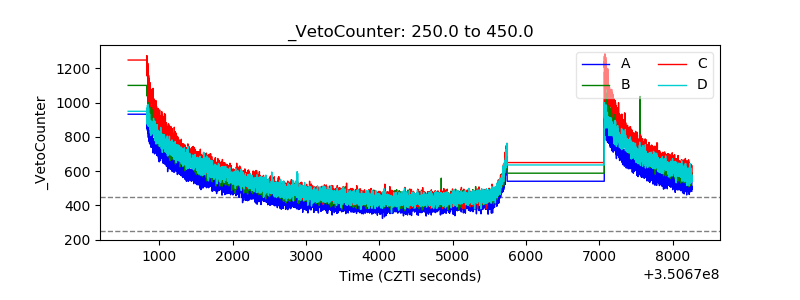 |