| Param | Original file | Final file |
|---|---|---|
| Filename | modeM0/AS1C05_019T04_9000004162_29053cztM0_level2.evt | modeM0/AS1C05_019T04_9000004162_29053cztM0_level2_quad_clean.evt |
| Size (bytes) | 523,157,760 | 123,488,640 |
| Size | 498.9 MB | 117.8 MB |
| Events in quadrant A | 3,137,442 | 830,670 |
| Events in quadrant B | 3,290,329 | 859,750 |
| Events in quadrant C | 3,287,530 | 837,800 |
| Events in quadrant D | 5,694,384 | 765,113 |
| Mode SS | |||
|---|---|---|---|
| Quadrant | BADHDUFLAG | Total packets | Discarded packets |
| A | 0 | 130 | 0 |
| B | 0 | 130 | 0 |
| C | 0 | 130 | 0 |
| D | 0 | 130 | 0 |
| Mode M9 | |||
|---|---|---|---|
| Quadrant | BADHDUFLAG | Total packets | Discarded packets |
| A | 0 | 16 | 0 |
| B | 0 | 17 | 0 |
| C | 0 | 17 | 0 |
| D | 0 | 17 | 0 |
| Mode M0 | |||
|---|---|---|---|
| Quadrant | BADHDUFLAG | Total packets | Discarded packets |
| A | 0 | 13525 | 2 |
| B | 0 | 13880 | 2 |
| C | 0 | 13781 | 2 |
| D | 0 | 21382 | 2 |
| Quadrant | Total seconds | Saturated seconds | Saturation percentage |
|---|---|---|---|
| A | 6404 | 45 | 0.702686% |
| B | 6404 | 62 | 0.968145% |
| C | 6404 | 107 | 1.670831% |
| D | 6404 | 479 | 7.479700% |
Noise dominated data is calculated using 1-second bins in cleaned event files. If a bin has >2000 counts, and if more than 50% of those come from <1% of pixels, then it is considered to be noise-dominated and hence unusable.
| Quadrant | # 1 sec bins | Bins with >0 counts | Bins with >2000 counts | High rate bins dominated by noise | Noise dominated (total time) | Noise dominated (detector-on time) | Marked lightcurve |
|---|---|---|---|---|---|---|---|
| A | 7584 | 6404 | 0 | 0 | 0.00% | 0.00% | 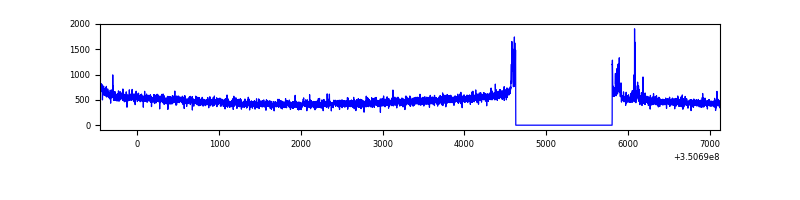 |
| B | 7584 | 6404 | 17 | 17 | 0.22% | 0.27% | 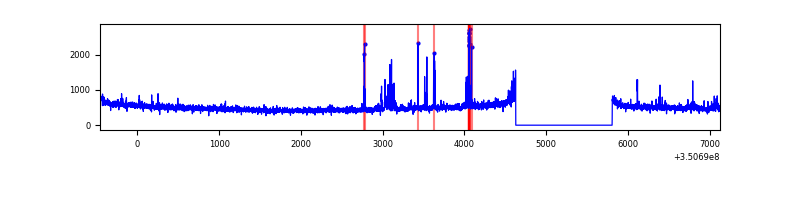 |
| C | 7584 | 6404 | 0 | 0 | 0.00% | 0.00% | 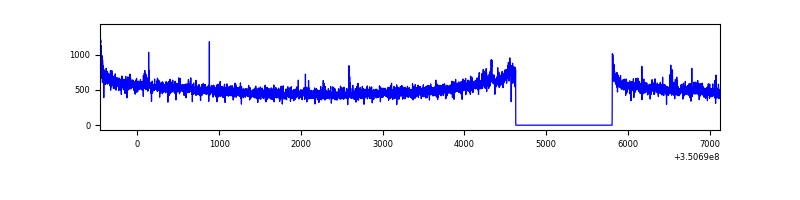 |
| D | 7584 | 6404 | 334 | 334 | 4.40% | 5.22% | 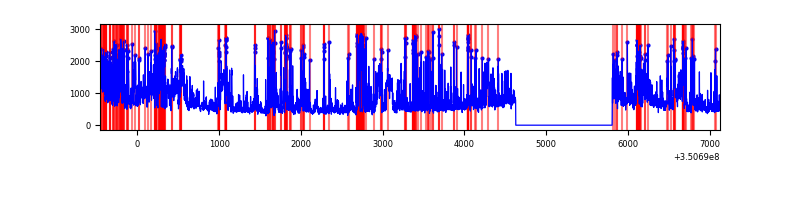 |
Top three noisy pixels from each quadrant. If the there are fewer than three noisy pixels in the level2.evt file, extra rows are filled as -1
| Pixel properties | Quadrant properties | ||||||
|---|---|---|---|---|---|---|---|
| Quadrant | DetID | PixID | Counts | Sigma | Mean | Median | Sigma |
| A | 15 | 174 | 64620 | 409.94 | 787 | 773 | 155.7 |
| A | 6 | 16 | 31290 | 195.94 | 787 | 773 | 155.7 |
| A | 13 | 254 | 11629 | 69.7 | 787 | 773 | 155.7 |
| B | 10 | 245 | 71818 | 482.65 | 790 | 770 | 147.2 |
| B | 10 | 246 | 65436 | 439.29 | 790 | 770 | 147.2 |
| B | 15 | 33 | 29216 | 193.24 | 790 | 770 | 147.2 |
| C | 14 | 238 | 125486 | 697.37 | 774 | 779 | 178.8 |
| C | 3 | 233 | 121155 | 673.15 | 774 | 779 | 178.8 |
| C | 2 | 114 | 15027 | 79.68 | 774 | 779 | 178.8 |
| D | 1 | 52 | 2208463 | 12423.46 | 747 | 727 | 177.7 |
| D | 8 | 195 | 571257 | 3210.51 | 747 | 727 | 177.7 |
| D | 2 | 250 | 67215 | 374.14 | 747 | 727 | 177.7 |
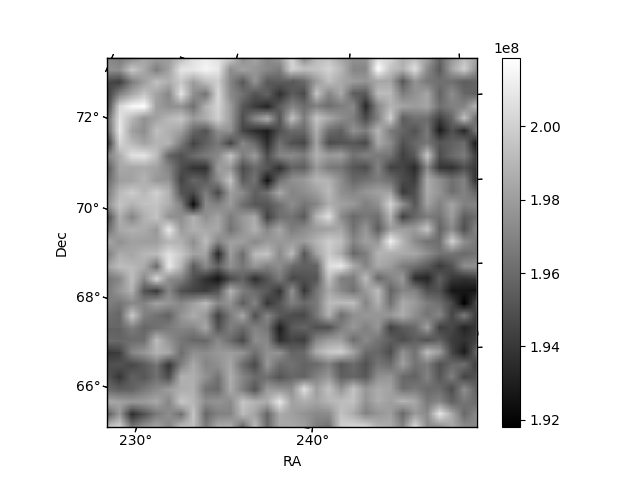
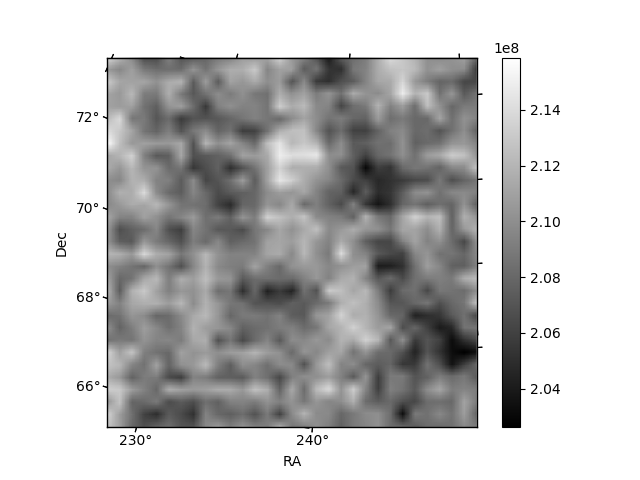
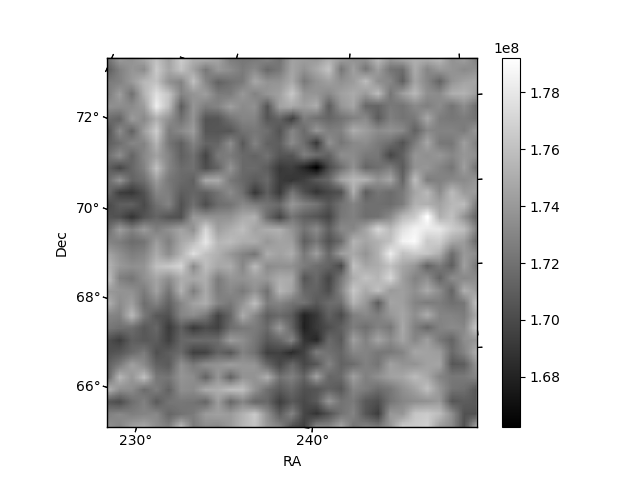
Histogram calculated using DETX and DETY for each event in the final _common_clean file
| Quadrant A | 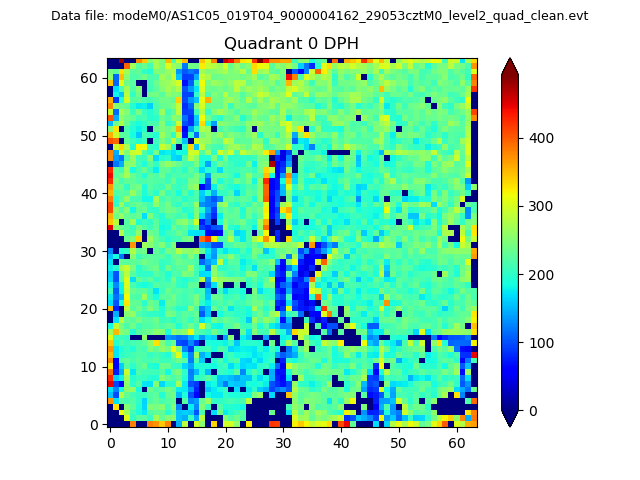 |
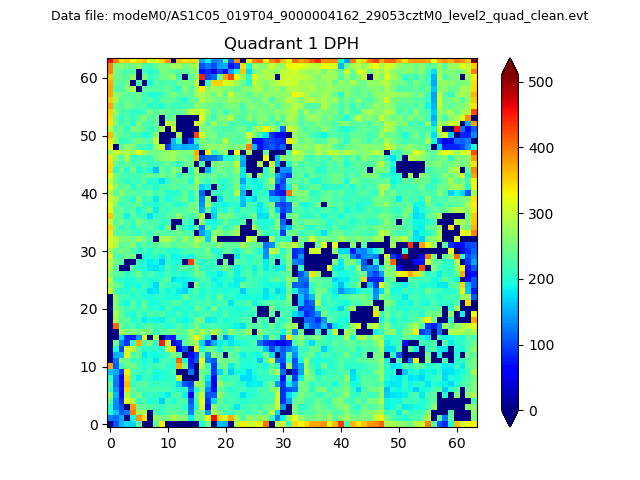 |
Quadrant B |
|---|---|---|---|
| Quadrant D |  |
 |
Quadrant C |
| Plot type | Count rate plots | Images |
|---|---|---|
| Comparison with Poisson distribution Blue bars denote a histogram of data divided into 1 sec bins. Red curve is a Poisson curve with rate = median count rate of data. |
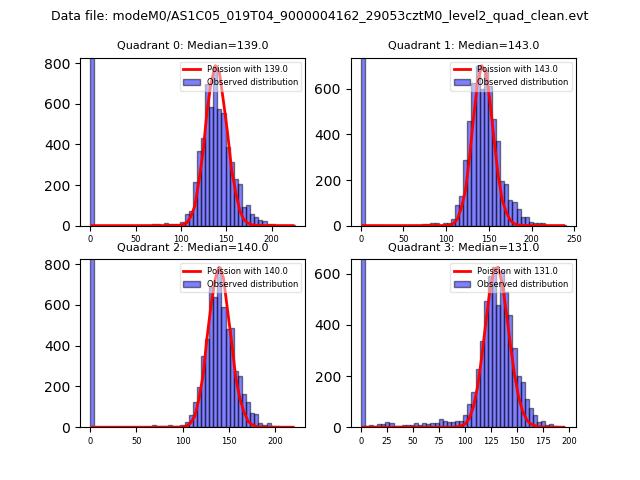 |
 |
| Quadrant-wise count rates Data is divided into 100 sec bins |
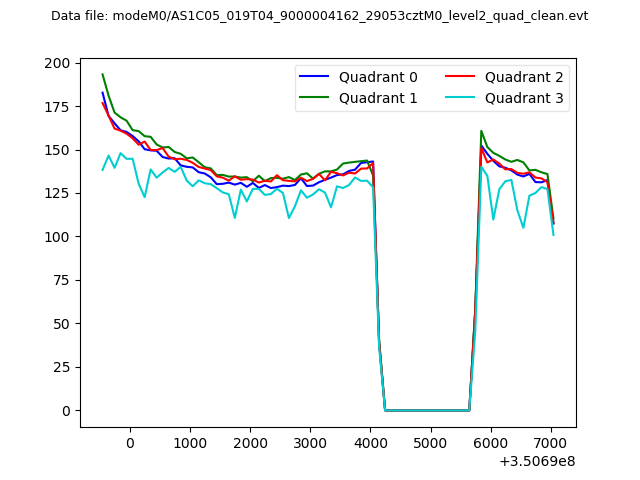 |
|
| Module-wise count rates for Quadrant A Data is divided into 100 sec bins |
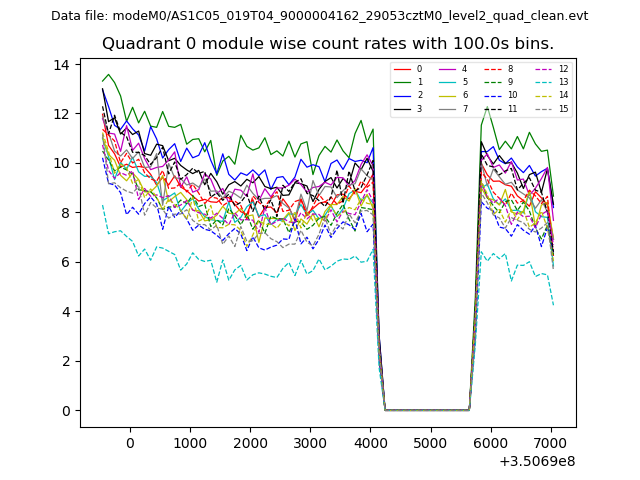 |
 |
| Module-wise count rates for Quadrant B Data is divided into 100 sec bins |
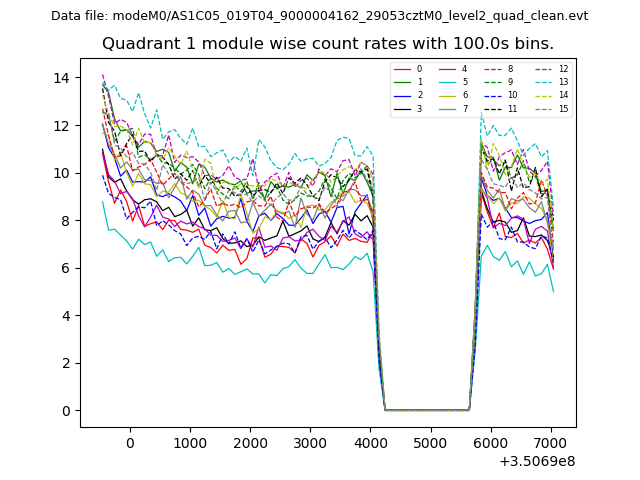 |
 |
| Module-wise count rates for Quadrant C Data is divided into 100 sec bins |
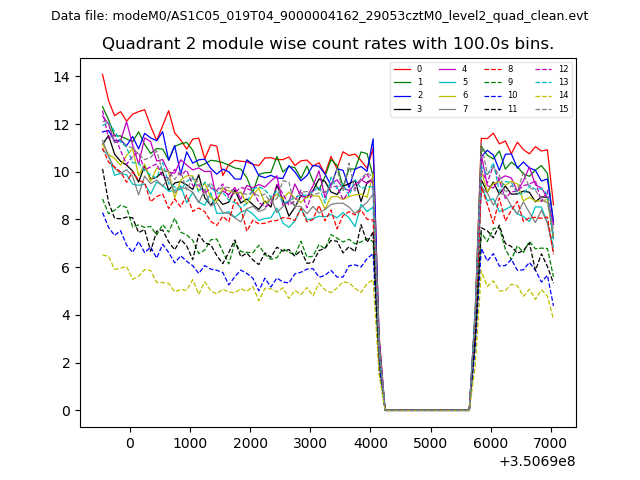 |
 |
| Module-wise count rates for Quadrant D Data is divided into 100 sec bins |
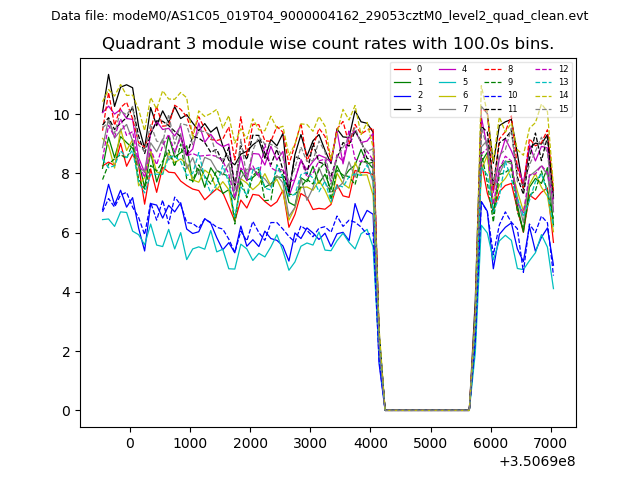 |
 |
| Parameter | Plot |
|---|---|
| CZT HV Monitor | 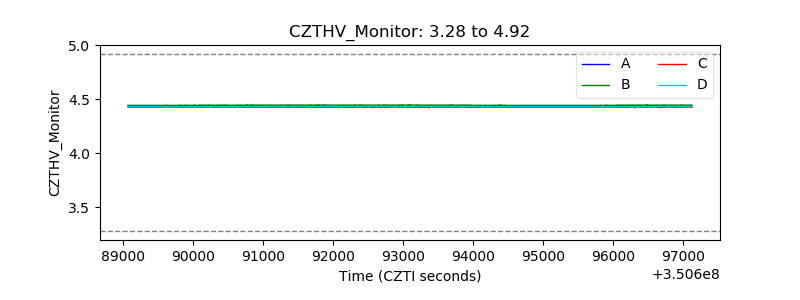 |
| D_VDD | 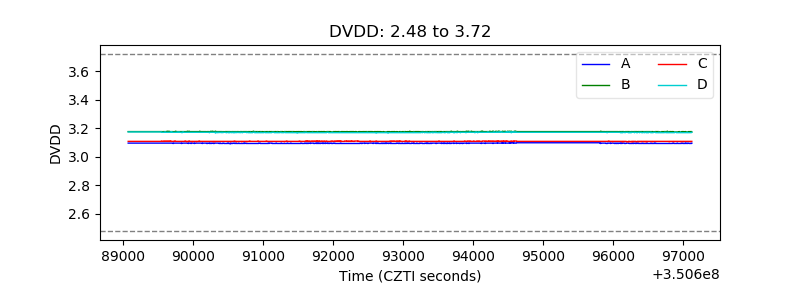 |
| Temperature 1 | 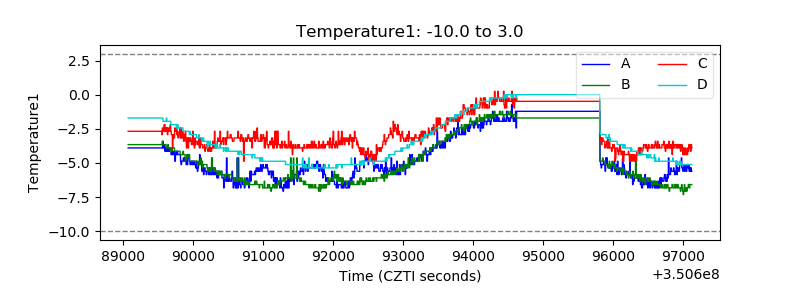 |
| Veto HV Monitor | 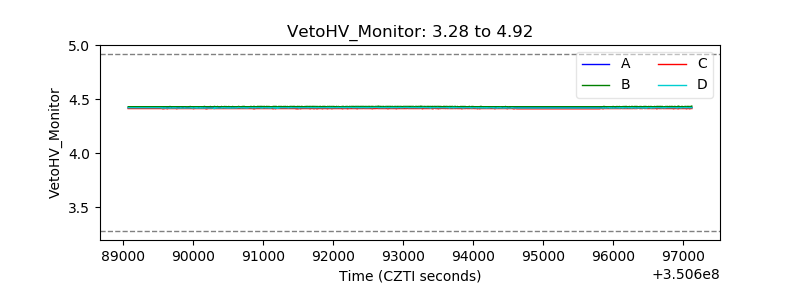 |
| Veto LLD | 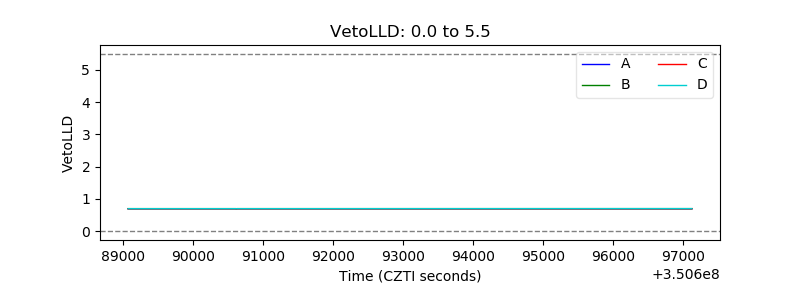 |
| Alpha Counter | 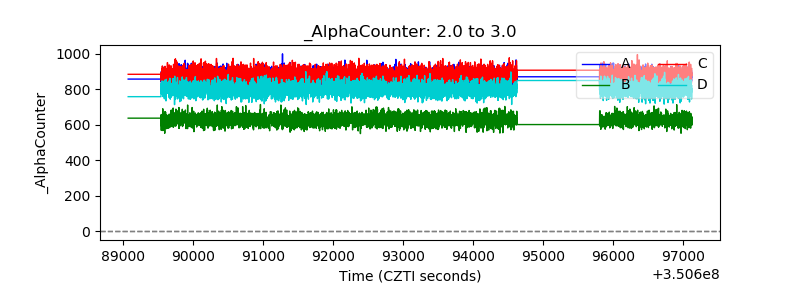 |
| _CPM_Rate | 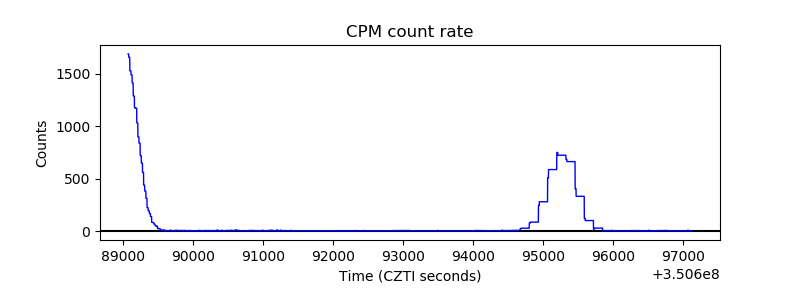 |
| CZT Counter | 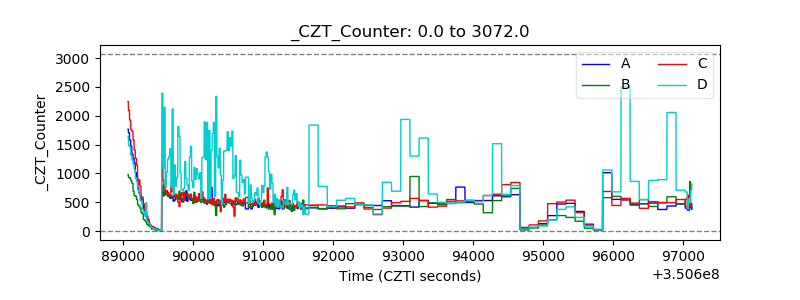 |
| +2.5 Volts monitor |  |
| +5 Volts monitor |  |
| _ROLL_ROT | 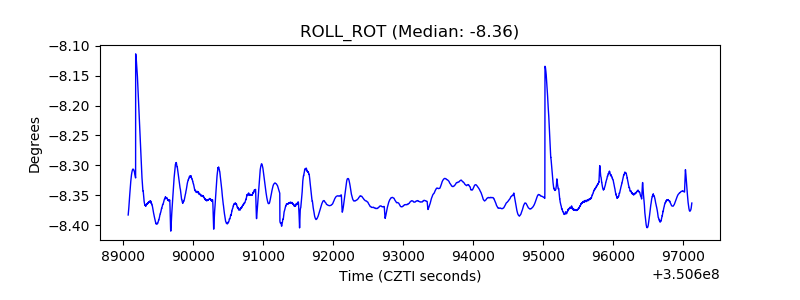 |
| _Roll_DEC | 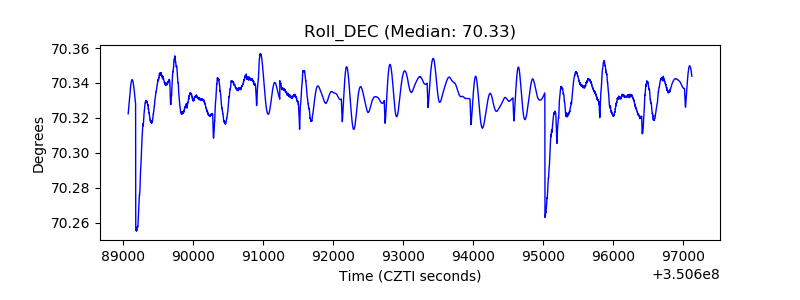 |
| _Roll_RA |  |
| Veto Counter | 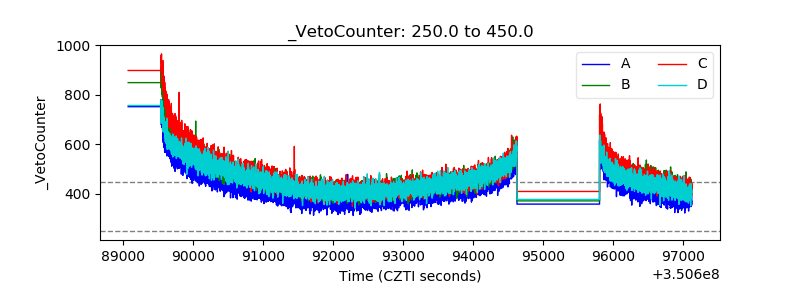 |