| Param | Original file | Final file |
|---|---|---|
| Filename | modeM0/AS1C05_019T04_9000004162_29054cztM0_level2.evt | modeM0/AS1C05_019T04_9000004162_29054cztM0_level2_quad_clean.evt |
| Size (bytes) | 576,046,080 | 120,997,440 |
| Size | 549.4 MB | 115.4 MB |
| Events in quadrant A | 3,336,833 | 799,630 |
| Events in quadrant B | 3,820,511 | 818,565 |
| Events in quadrant C | 3,645,804 | 798,319 |
| Events in quadrant D | 6,158,250 | 750,974 |
| Mode SS | |||
|---|---|---|---|
| Quadrant | BADHDUFLAG | Total packets | Discarded packets |
| A | 0 | 146 | 0 |
| B | 0 | 146 | 0 |
| C | 0 | 146 | 0 |
| D | 0 | 146 | 0 |
| Mode M9 | |||
|---|---|---|---|
| Quadrant | BADHDUFLAG | Total packets | Discarded packets |
| A | 0 | 19 | 0 |
| B | 0 | 19 | 0 |
| C | 0 | 19 | 0 |
| D | 0 | 19 | 0 |
| Mode M0 | |||
|---|---|---|---|
| Quadrant | BADHDUFLAG | Total packets | Discarded packets |
| A | 0 | 14819 | 2 |
| B | 0 | 15992 | 2 |
| C | 0 | 15359 | 2 |
| D | 0 | 23180 | 2 |
| Quadrant | Total seconds | Saturated seconds | Saturation percentage |
|---|---|---|---|
| A | 7141 | 59 | 0.826215% |
| B | 7141 | 174 | 2.436634% |
| C | 7141 | 138 | 1.932502% |
| D | 7141 | 845 | 11.833077% |
Noise dominated data is calculated using 1-second bins in cleaned event files. If a bin has >2000 counts, and if more than 50% of those come from <1% of pixels, then it is considered to be noise-dominated and hence unusable.
| Quadrant | # 1 sec bins | Bins with >0 counts | Bins with >2000 counts | High rate bins dominated by noise | Noise dominated (total time) | Noise dominated (detector-on time) | Marked lightcurve |
|---|---|---|---|---|---|---|---|
| A | 9036 | 7141 | 0 | 0 | 0.00% | 0.00% | 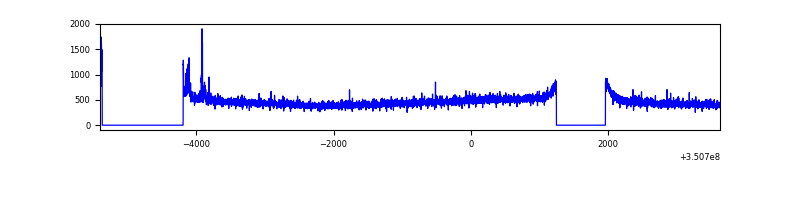 |
| B | 9036 | 7141 | 59 | 59 | 0.65% | 0.83% | 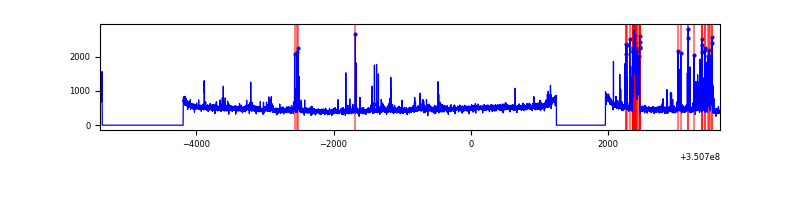 |
| C | 9036 | 7141 | 0 | 0 | 0.00% | 0.00% |  |
| D | 9036 | 7141 | 638 | 638 | 7.06% | 8.93% | 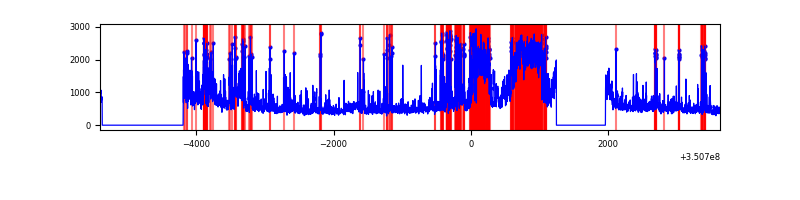 |
Top three noisy pixels from each quadrant. If the there are fewer than three noisy pixels in the level2.evt file, extra rows are filled as -1
| Pixel properties | Quadrant properties | ||||||
|---|---|---|---|---|---|---|---|
| Quadrant | DetID | PixID | Counts | Sigma | Mean | Median | Sigma |
| A | 15 | 174 | 49979 | 288.82 | 847 | 830 | 170.2 |
| A | 6 | 16 | 12331 | 67.58 | 847 | 830 | 170.2 |
| A | 13 | 254 | 12320 | 67.52 | 847 | 830 | 170.2 |
| B | 10 | 246 | 297950 | 1859.45 | 849 | 825 | 159.8 |
| B | 10 | 245 | 127807 | 794.67 | 849 | 825 | 159.8 |
| B | 4 | 80 | 27903 | 169.46 | 849 | 825 | 159.8 |
| C | 3 | 233 | 259672 | 1356.18 | 827 | 833 | 190.9 |
| C | 14 | 238 | 135234 | 704.19 | 827 | 833 | 190.9 |
| C | 2 | 114 | 16482 | 81.99 | 827 | 833 | 190.9 |
| D | 1 | 52 | 1498668 | 7990.77 | 789 | 766 | 187.5 |
| D | 7 | 238 | 942555 | 5024.1 | 789 | 766 | 187.5 |
| D | 8 | 195 | 661472 | 3524.63 | 789 | 766 | 187.5 |
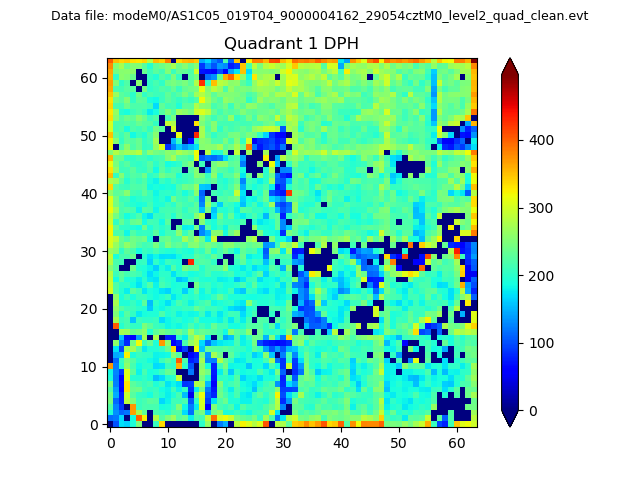
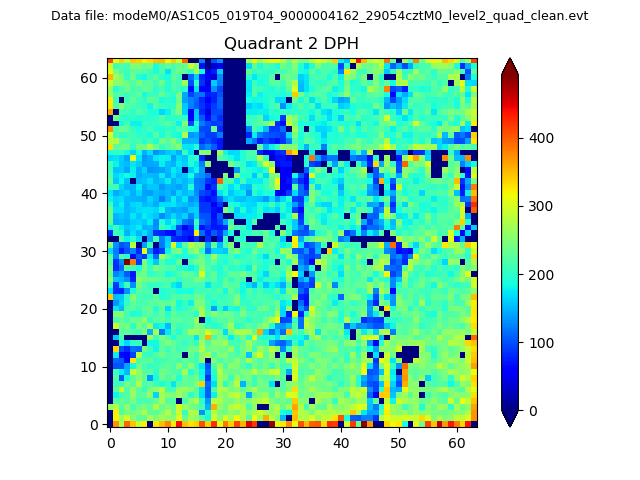
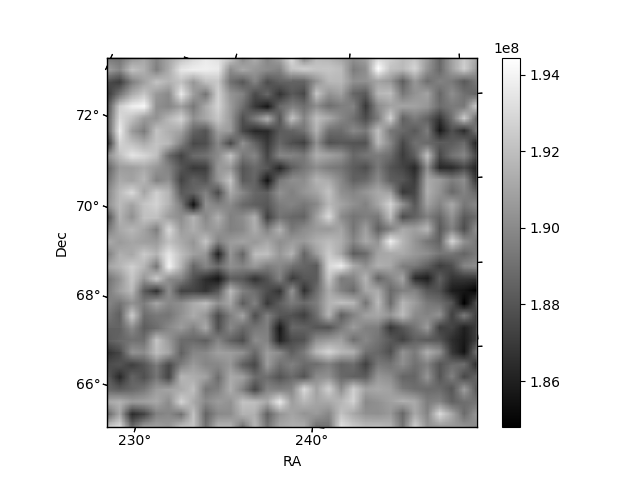
Histogram calculated using DETX and DETY for each event in the final _common_clean file
| Quadrant A | 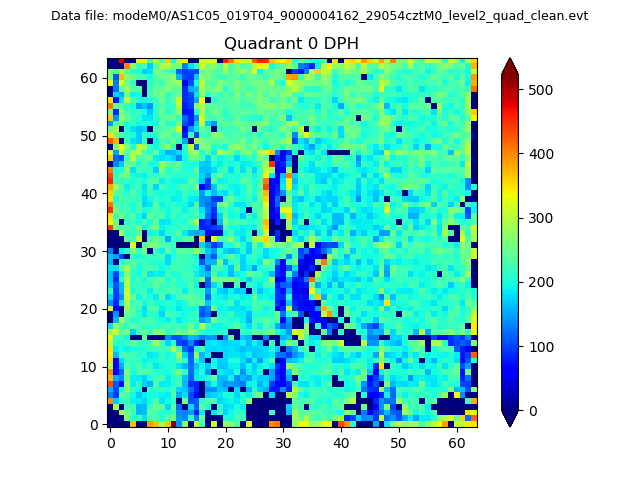 |
 |
Quadrant B |
|---|---|---|---|
| Quadrant D | 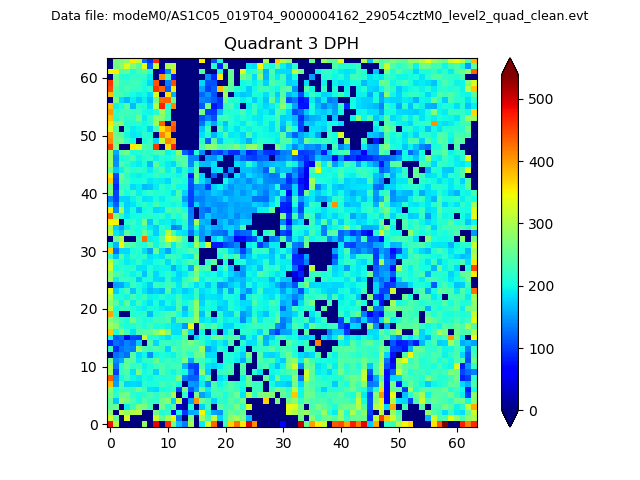 |
 |
Quadrant C |
| Plot type | Count rate plots | Images |
|---|---|---|
| Comparison with Poisson distribution Blue bars denote a histogram of data divided into 1 sec bins. Red curve is a Poisson curve with rate = median count rate of data. |
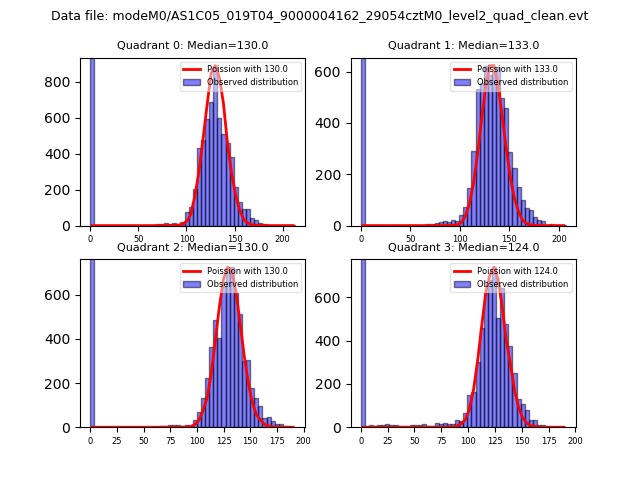 |
 |
| Quadrant-wise count rates Data is divided into 100 sec bins |
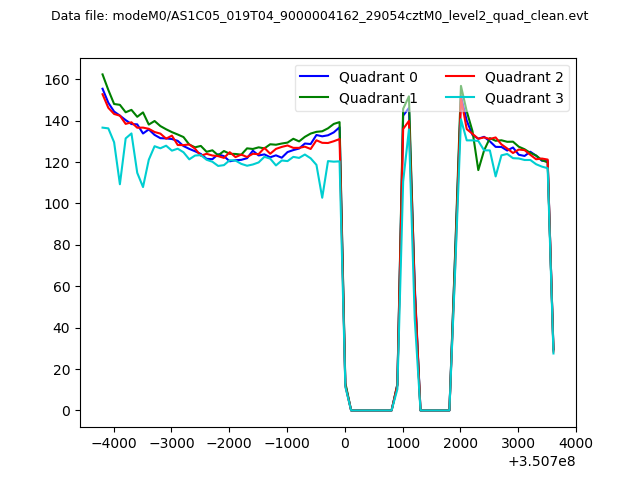 |
|
| Module-wise count rates for Quadrant A Data is divided into 100 sec bins |
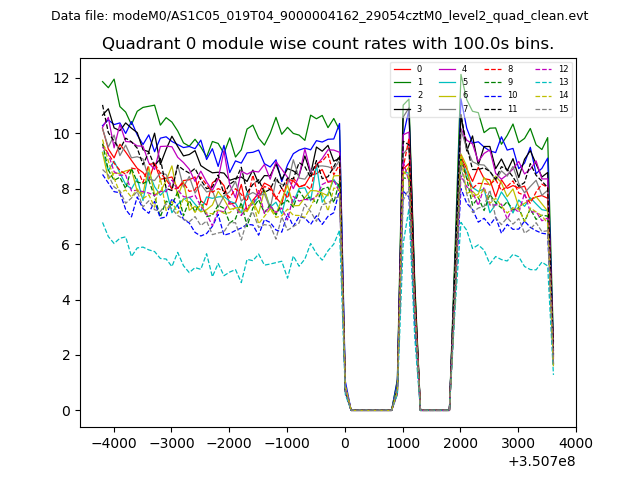 |
 |
| Module-wise count rates for Quadrant B Data is divided into 100 sec bins |
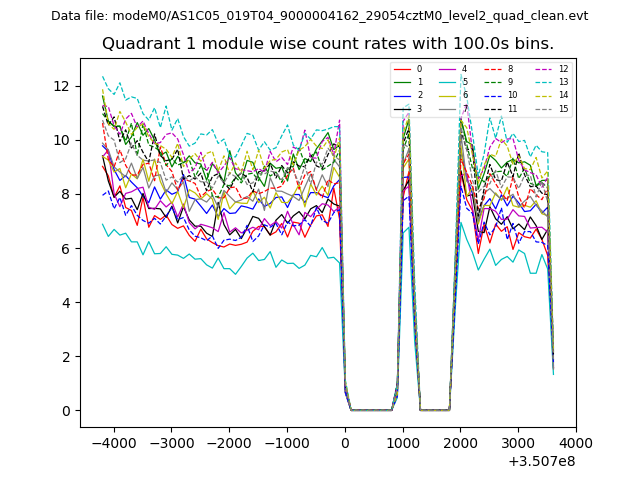 |
 |
| Module-wise count rates for Quadrant C Data is divided into 100 sec bins |
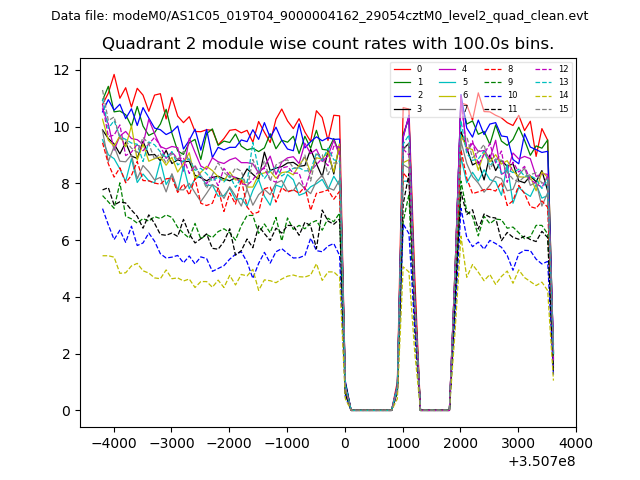 |
 |
| Module-wise count rates for Quadrant D Data is divided into 100 sec bins |
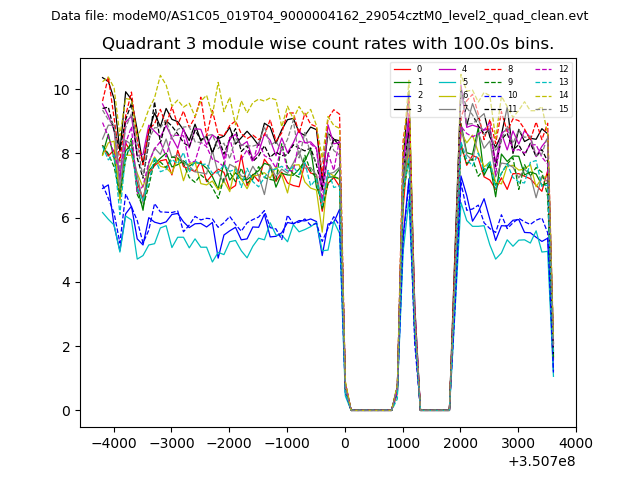 |
 |
| Parameter | Plot |
|---|---|
| CZT HV Monitor | 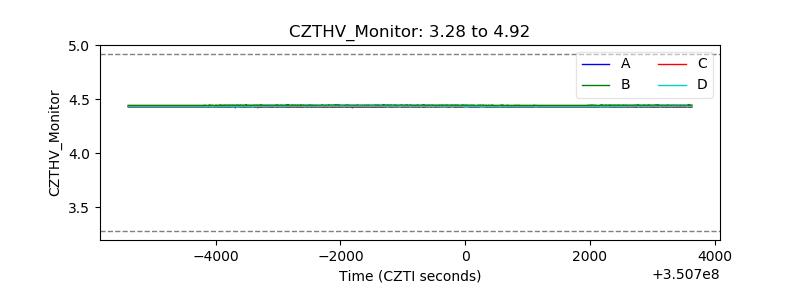 |
| D_VDD | 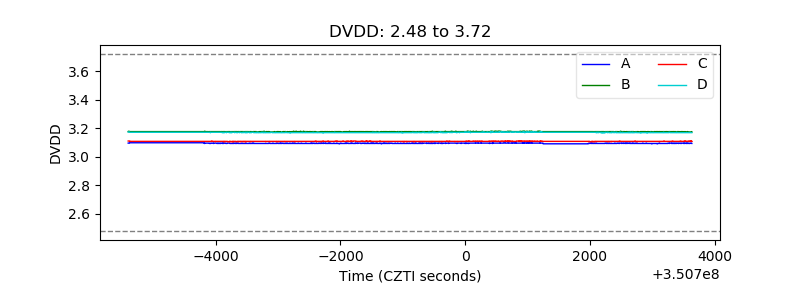 |
| Temperature 1 | 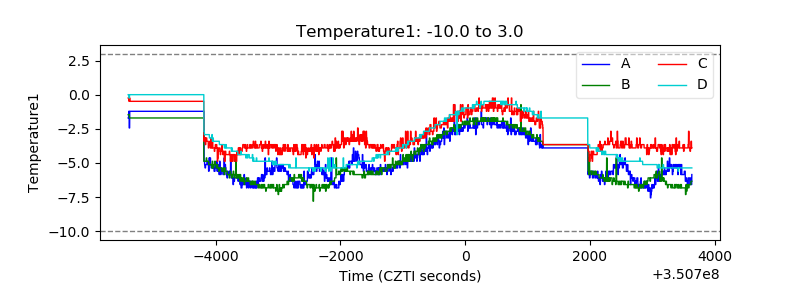 |
| Veto HV Monitor | 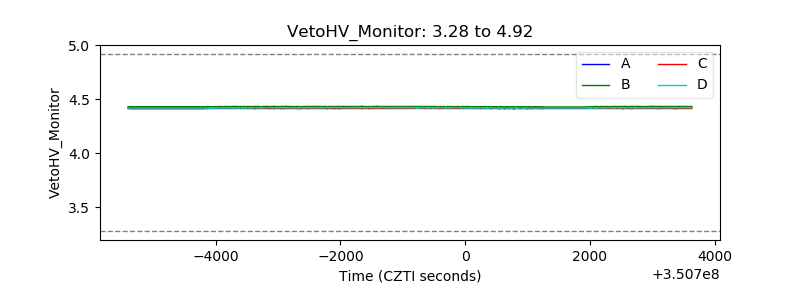 |
| Veto LLD | 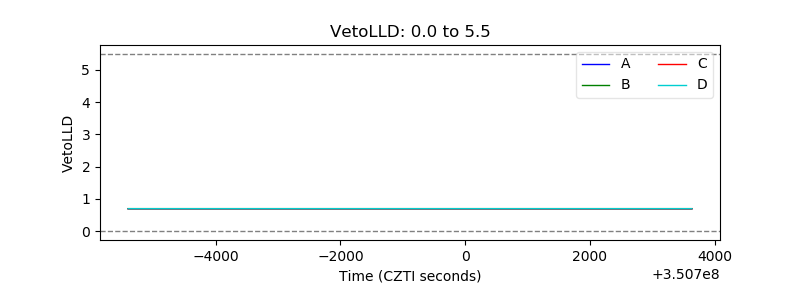 |
| Alpha Counter | 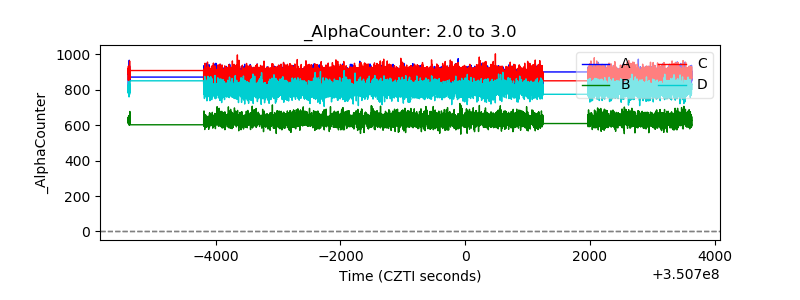 |
| _CPM_Rate | 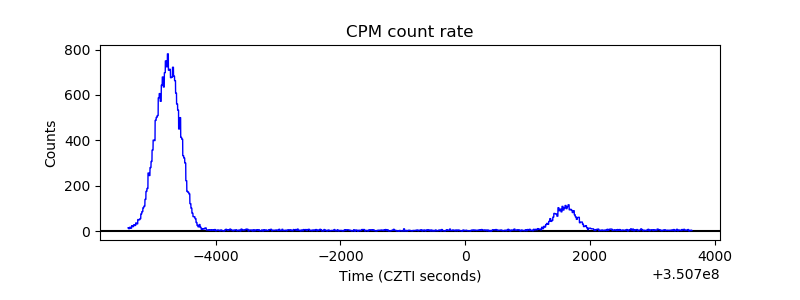 |
| CZT Counter | 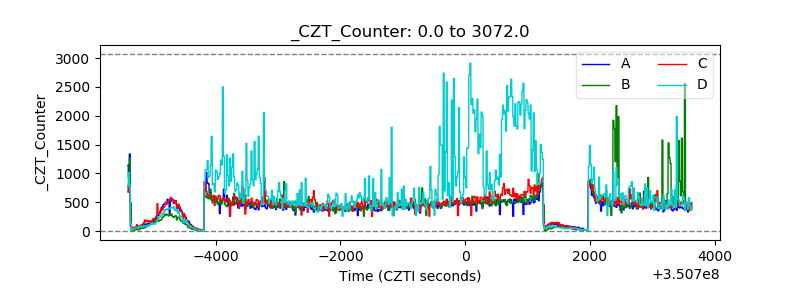 |
| +2.5 Volts monitor | 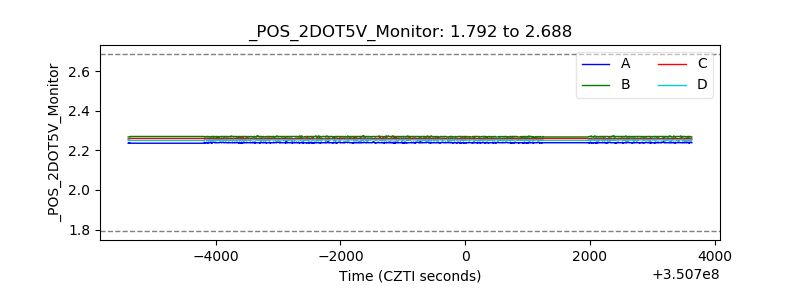 |
| +5 Volts monitor |  |
| _ROLL_ROT | 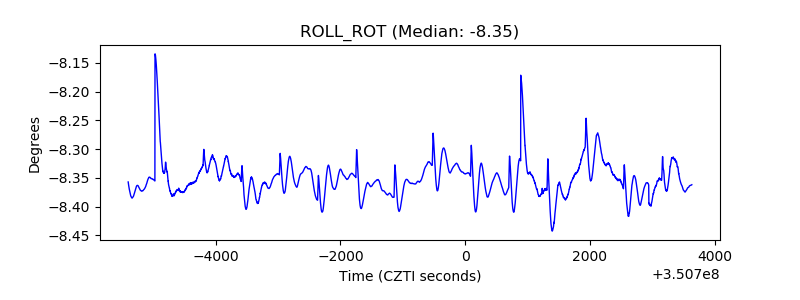 |
| _Roll_DEC | 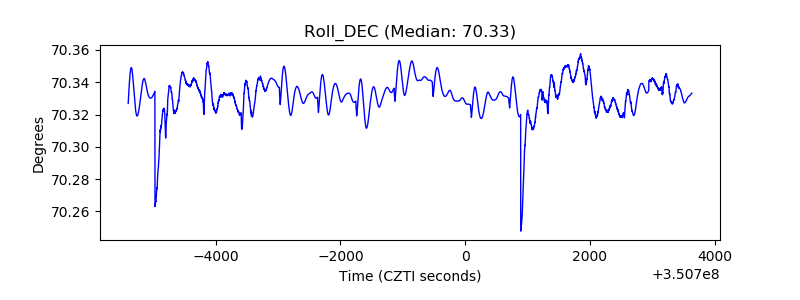 |
| _Roll_RA | 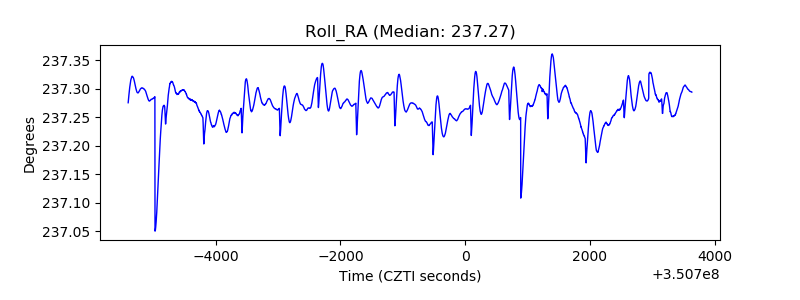 |
| Veto Counter | 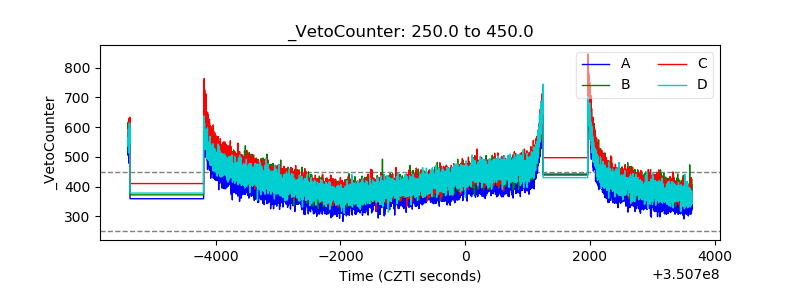 |