| Param | Original file | Final file |
|---|---|---|
| Filename | modeM0/AS1C05_019T04_9000004162_29055cztM0_level2.evt | modeM0/AS1C05_019T04_9000004162_29055cztM0_level2_quad_clean.evt |
| Size (bytes) | 606,939,840 | 130,524,480 |
| Size | 578.8 MB | 124.5 MB |
| Events in quadrant A | 3,621,478 | 867,408 |
| Events in quadrant B | 4,720,553 | 879,590 |
| Events in quadrant C | 3,883,523 | 852,471 |
| Events in quadrant D | 5,629,429 | 813,877 |
| Mode SS | |||
|---|---|---|---|
| Quadrant | BADHDUFLAG | Total packets | Discarded packets |
| A | 0 | 160 | 0 |
| B | 0 | 160 | 0 |
| C | 0 | 160 | 0 |
| D | 0 | 160 | 0 |
| Mode M9 | |||
|---|---|---|---|
| Quadrant | BADHDUFLAG | Total packets | Discarded packets |
| A | 0 | 9 | 0 |
| B | 0 | 9 | 0 |
| C | 0 | 9 | 0 |
| D | 0 | 9 | 0 |
| Mode M0 | |||
|---|---|---|---|
| Quadrant | BADHDUFLAG | Total packets | Discarded packets |
| A | 0 | 16143 | 2 |
| B | 0 | 19247 | 2 |
| C | 0 | 16564 | 2 |
| D | 0 | 22090 | 2 |
| Quadrant | Total seconds | Saturated seconds | Saturation percentage |
|---|---|---|---|
| A | 7758 | 81 | 1.044084% |
| B | 7758 | 312 | 4.021655% |
| C | 7758 | 295 | 3.802526% |
| D | 7759 | 442 | 5.696610% |
Noise dominated data is calculated using 1-second bins in cleaned event files. If a bin has >2000 counts, and if more than 50% of those come from <1% of pixels, then it is considered to be noise-dominated and hence unusable.
| Quadrant | # 1 sec bins | Bins with >0 counts | Bins with >2000 counts | High rate bins dominated by noise | Noise dominated (total time) | Noise dominated (detector-on time) | Marked lightcurve |
|---|---|---|---|---|---|---|---|
| A | 8728 | 7758 | 0 | 0 | 0.00% | 0.00% | 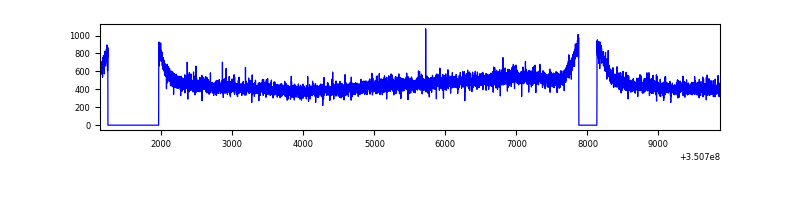 |
| B | 8728 | 7758 | 115 | 115 | 1.32% | 1.48% | 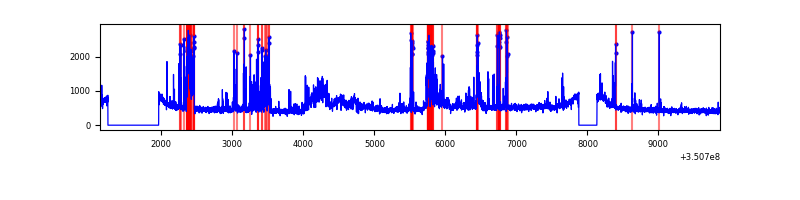 |
| C | 8728 | 7759 | 0 | 0 | 0.00% | 0.00% |  |
| D | 8729 | 7759 | 261 | 261 | 2.99% | 3.36% | 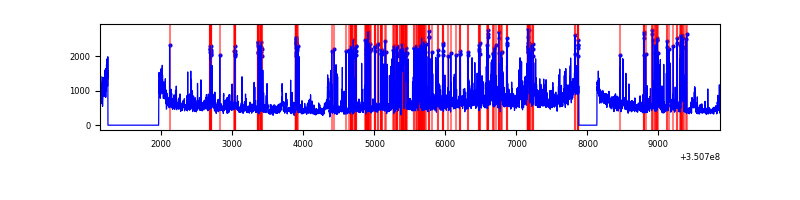 |
Top three noisy pixels from each quadrant. If the there are fewer than three noisy pixels in the level2.evt file, extra rows are filled as -1
| Pixel properties | Quadrant properties | ||||||
|---|---|---|---|---|---|---|---|
| Quadrant | DetID | PixID | Counts | Sigma | Mean | Median | Sigma |
| A | 6 | 16 | 31735 | 163.18 | 930 | 911 | 188.9 |
| A | 13 | 254 | 12886 | 63.4 | 930 | 911 | 188.9 |
| A | 3 | 137 | 9367 | 44.77 | 930 | 911 | 188.9 |
| B | 10 | 246 | 714148 | 4033.08 | 926 | 902 | 176.8 |
| B | 5 | 185 | 170141 | 956.97 | 926 | 902 | 176.8 |
| B | 10 | 245 | 83367 | 466.3 | 926 | 902 | 176.8 |
| C | 14 | 238 | 181565 | 860.15 | 896 | 901 | 210.0 |
| C | 3 | 233 | 133488 | 631.25 | 896 | 901 | 210.0 |
| C | 14 | 254 | 58034 | 272.01 | 896 | 901 | 210.0 |
| D | 1 | 52 | 1441800 | 6759.37 | 885 | 858 | 213.2 |
| D | 8 | 195 | 769840 | 3607.25 | 885 | 858 | 213.2 |
| D | 2 | 250 | 47745 | 219.94 | 885 | 858 | 213.2 |
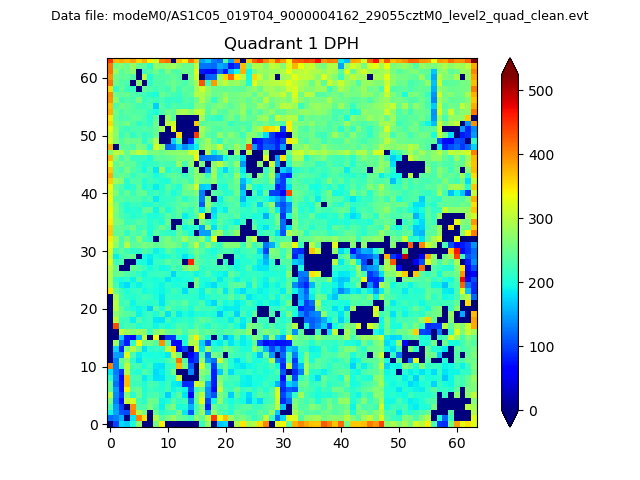
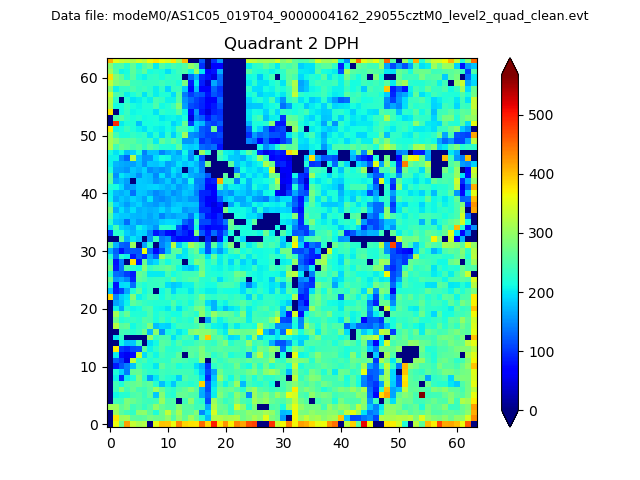
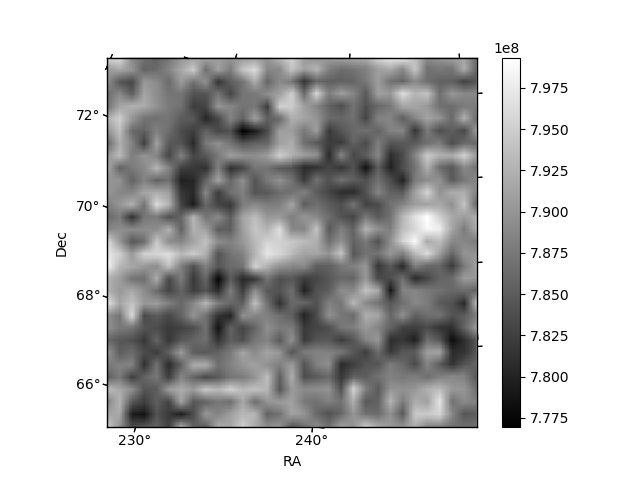
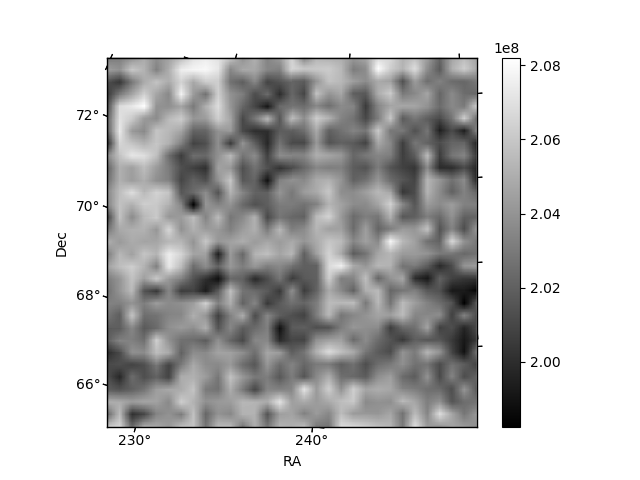
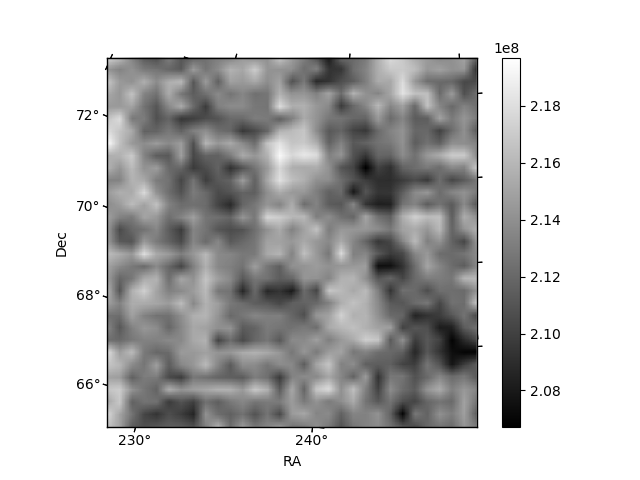
Histogram calculated using DETX and DETY for each event in the final _common_clean file
| Quadrant A | 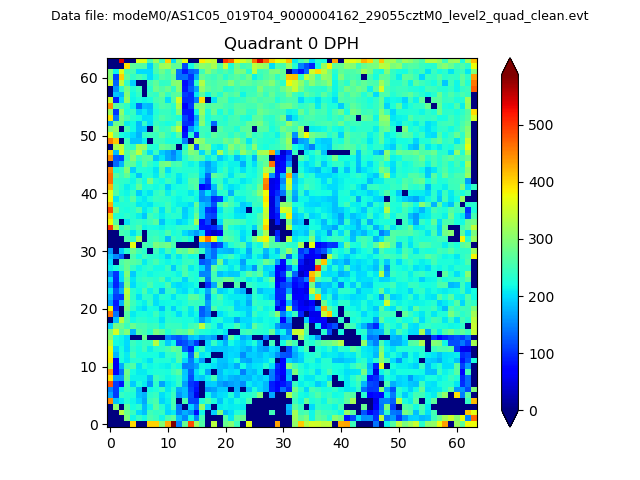 |
 |
Quadrant B |
|---|---|---|---|
| Quadrant D | 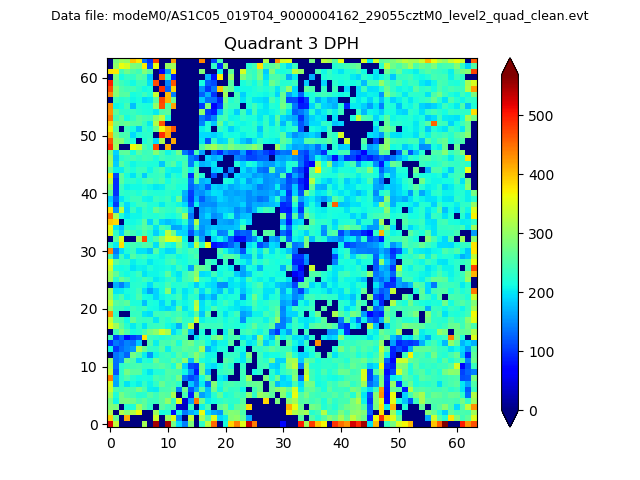 |
 |
Quadrant C |
| Plot type | Count rate plots | Images |
|---|---|---|
| Comparison with Poisson distribution Blue bars denote a histogram of data divided into 1 sec bins. Red curve is a Poisson curve with rate = median count rate of data. |
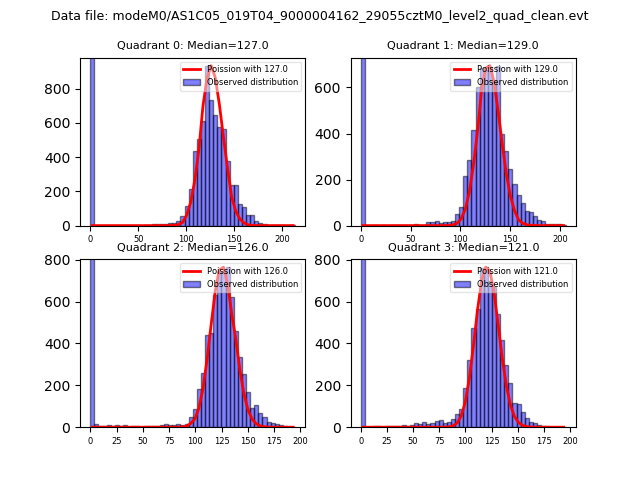 |
 |
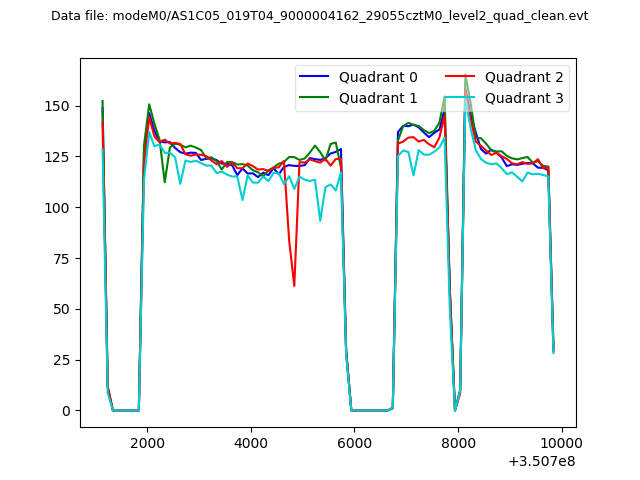
| Quadrant-wise count rates Data is divided into 100 sec bins |
 |
|
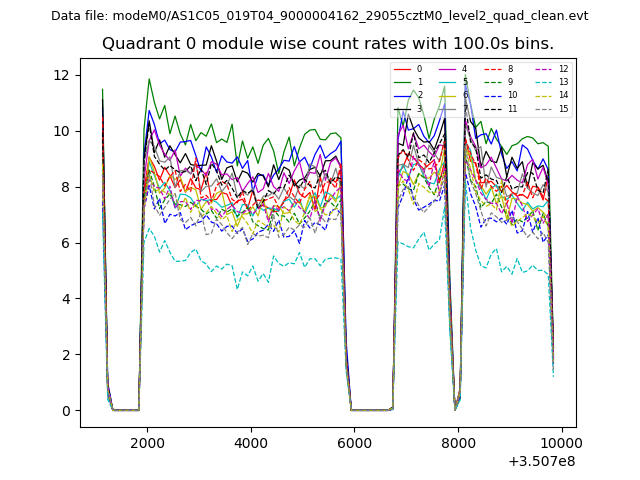
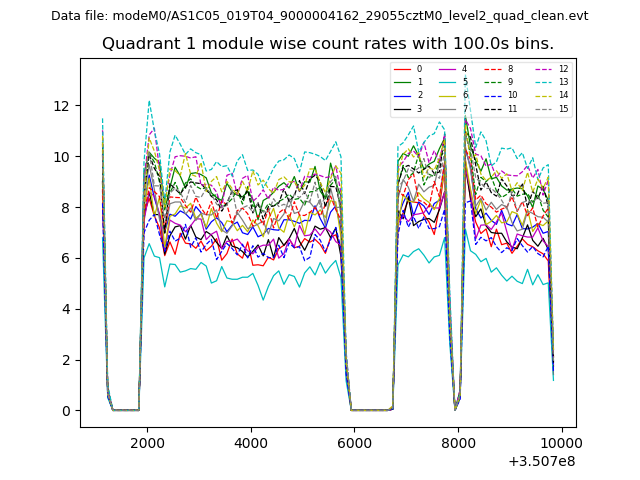
| Module-wise count rates for Quadrant A Data is divided into 100 sec bins |
 |
 |
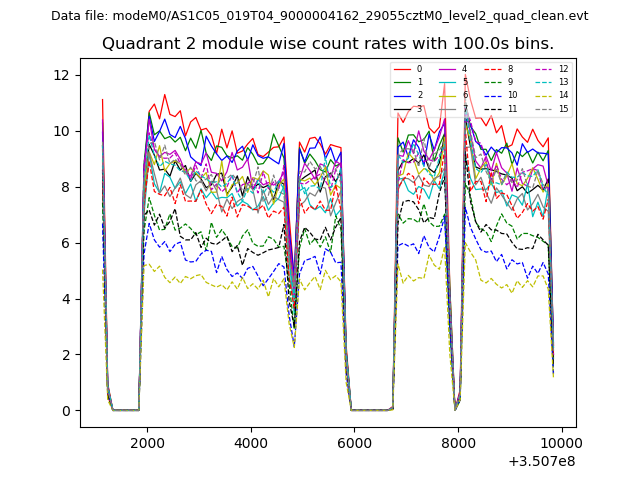
| Module-wise count rates for Quadrant B Data is divided into 100 sec bins |
 |
 |
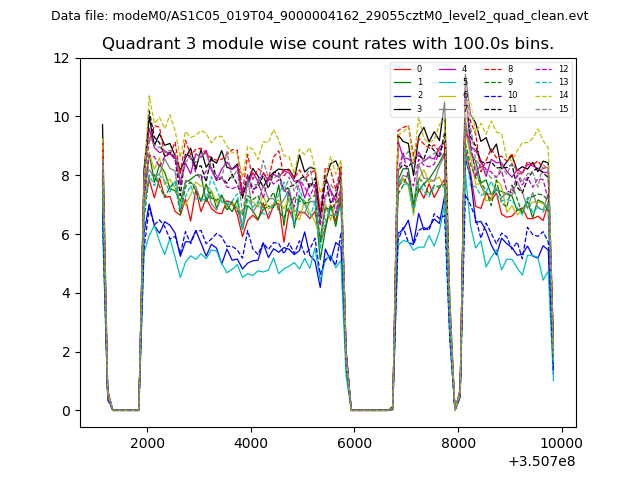
| Module-wise count rates for Quadrant C Data is divided into 100 sec bins |
 |
 |
| Module-wise count rates for Quadrant D Data is divided into 100 sec bins |
 |
 |
| Parameter | Plot |
|---|---|
| CZT HV Monitor | 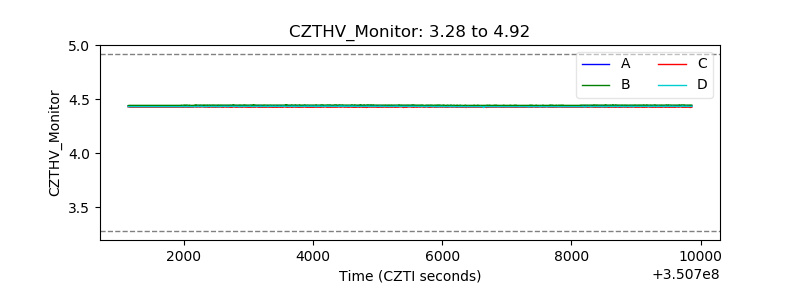 |
| D_VDD | 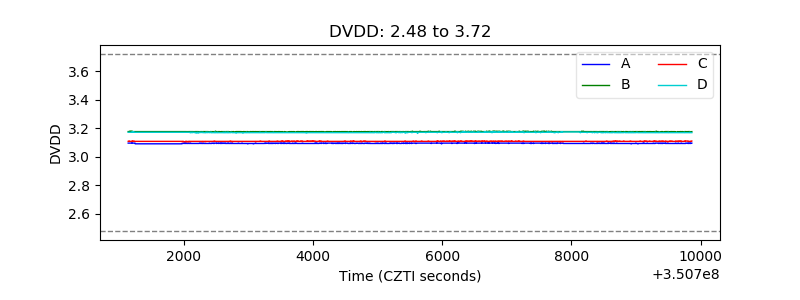 |
| Temperature 1 | 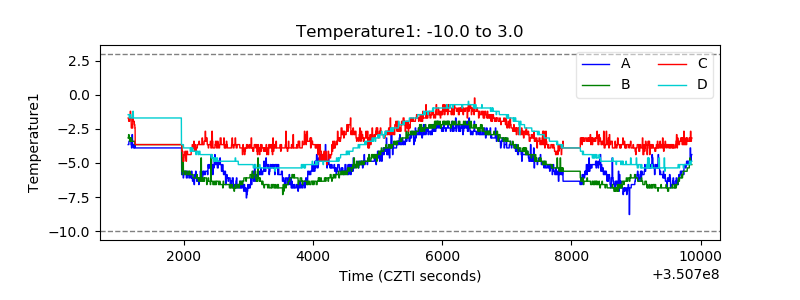 |
| Veto HV Monitor | 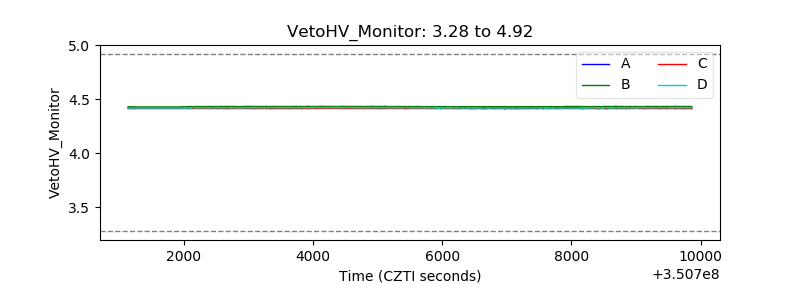 |
| Veto LLD | 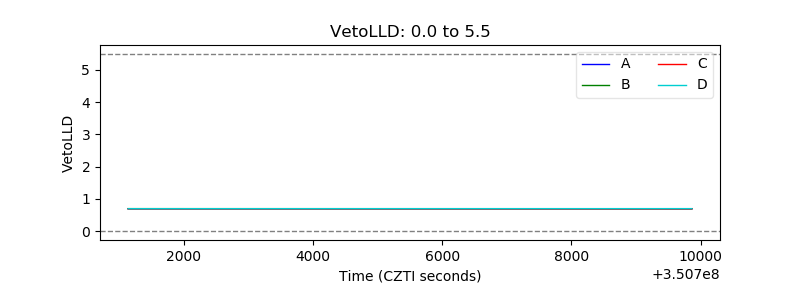 |
| Alpha Counter | 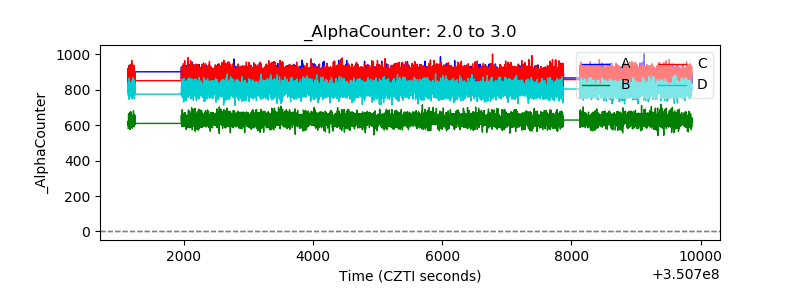 |
| _CPM_Rate | 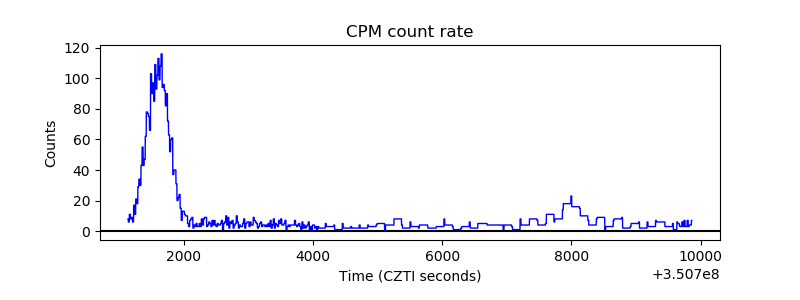 |
| CZT Counter | 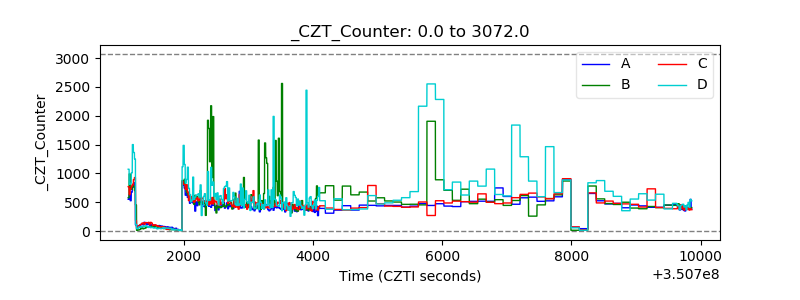 |
| +2.5 Volts monitor | 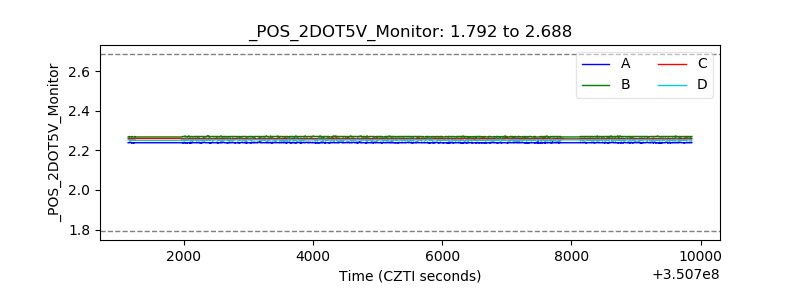 |
| +5 Volts monitor |  |
| _ROLL_ROT | 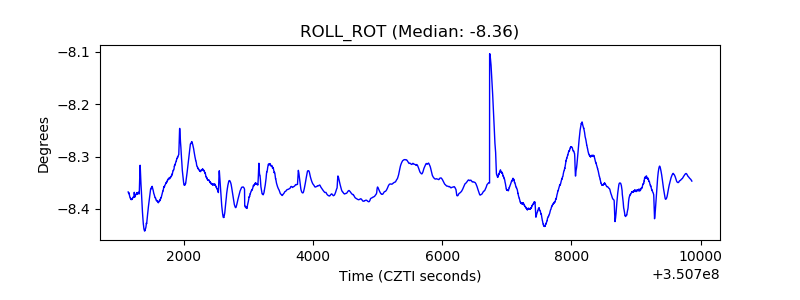 |
| _Roll_DEC | 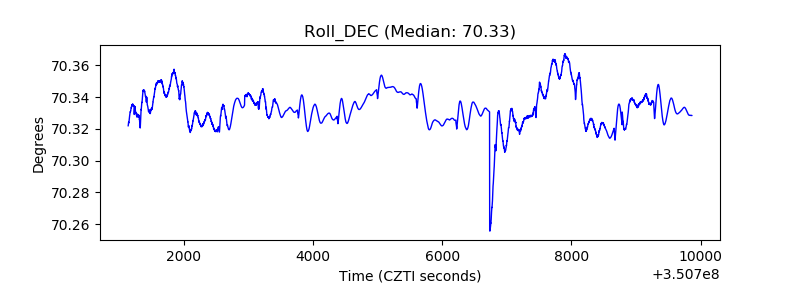 |
| _Roll_RA | 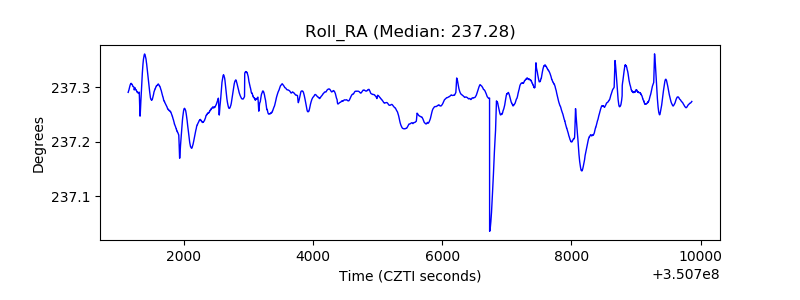 |
| Veto Counter | 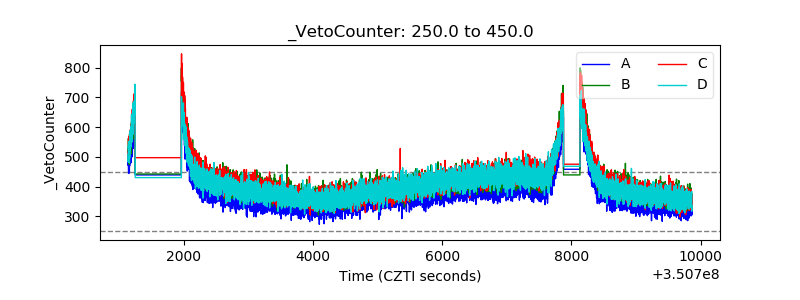 |