| Param | Original file | Final file |
|---|---|---|
| Filename | modeM0/AS1C05_019T04_9000004162_29056cztM0_level2.evt | modeM0/AS1C05_019T04_9000004162_29056cztM0_level2_quad_clean.evt |
| Size (bytes) | 560,430,720 | 129,628,800 |
| Size | 534.5 MB | 123.6 MB |
| Events in quadrant A | 3,591,583 | 856,601 |
| Events in quadrant B | 3,788,622 | 874,413 |
| Events in quadrant C | 3,672,905 | 850,994 |
| Events in quadrant D | 5,393,704 | 805,011 |
| Mode SS | |||
|---|---|---|---|
| Quadrant | BADHDUFLAG | Total packets | Discarded packets |
| A | 0 | 156 | 0 |
| B | 0 | 156 | 0 |
| C | 0 | 156 | 0 |
| D | 0 | 156 | 0 |
| Mode M9 | |||
|---|---|---|---|
| Quadrant | BADHDUFLAG | Total packets | Discarded packets |
| A | 0 | 2 | 0 |
| B | 0 | 2 | 0 |
| C | 0 | 2 | 0 |
| D | 0 | 2 | 0 |
| Mode M0 | |||
|---|---|---|---|
| Quadrant | BADHDUFLAG | Total packets | Discarded packets |
| A | 0 | 16029 | 1 |
| B | 0 | 16556 | 1 |
| C | 0 | 16138 | 1 |
| D | 0 | 21420 | 1 |
| Quadrant | Total seconds | Saturated seconds | Saturation percentage |
|---|---|---|---|
| A | 7758 | 84 | 1.082753% |
| B | 7759 | 183 | 2.358551% |
| C | 7759 | 141 | 1.817244% |
| D | 7759 | 370 | 4.768656% |
Noise dominated data is calculated using 1-second bins in cleaned event files. If a bin has >2000 counts, and if more than 50% of those come from <1% of pixels, then it is considered to be noise-dominated and hence unusable.
| Quadrant | # 1 sec bins | Bins with >0 counts | Bins with >2000 counts | High rate bins dominated by noise | Noise dominated (total time) | Noise dominated (detector-on time) | Marked lightcurve |
|---|---|---|---|---|---|---|---|
| A | 7842 | 7758 | 0 | 0 | 0.00% | 0.00% | 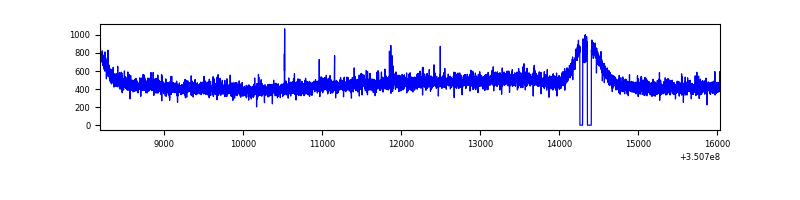 |
| B | 7844 | 7759 | 27 | 27 | 0.34% | 0.35% | 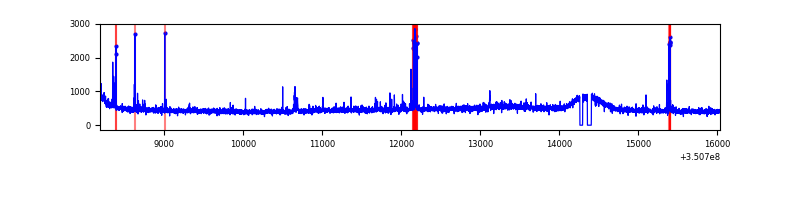 |
| C | 7844 | 7759 | 0 | 0 | 0.00% | 0.00% | 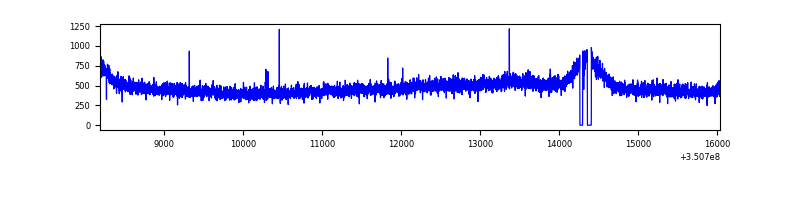 |
| D | 7844 | 7760 | 245 | 245 | 3.12% | 3.16% | 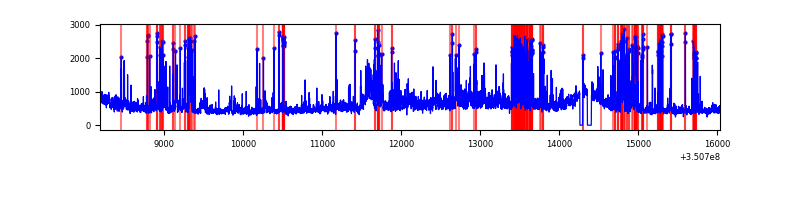 |
Top three noisy pixels from each quadrant. If the there are fewer than three noisy pixels in the level2.evt file, extra rows are filled as -1
| Pixel properties | Quadrant properties | ||||||
|---|---|---|---|---|---|---|---|
| Quadrant | DetID | PixID | Counts | Sigma | Mean | Median | Sigma |
| A | 1 | 113 | 20084 | 102.6 | 924 | 904 | 186.9 |
| A | 13 | 254 | 13234 | 65.96 | 924 | 904 | 186.9 |
| A | 3 | 137 | 9376 | 45.32 | 924 | 904 | 186.9 |
| B | 10 | 246 | 96644 | 540.9 | 920 | 896 | 177.0 |
| B | 10 | 245 | 45633 | 252.73 | 920 | 896 | 177.0 |
| B | 12 | 111 | 22446 | 121.74 | 920 | 896 | 177.0 |
| C | 14 | 238 | 143955 | 687.16 | 892 | 897 | 208.2 |
| C | 3 | 233 | 30313 | 141.3 | 892 | 897 | 208.2 |
| C | 2 | 114 | 18020 | 82.25 | 892 | 897 | 208.2 |
| D | 1 | 52 | 1226047 | 5786.12 | 881 | 854 | 211.7 |
| D | 8 | 195 | 634643 | 2993.15 | 881 | 854 | 211.7 |
| D | 2 | 250 | 184750 | 868.47 | 881 | 854 | 211.7 |
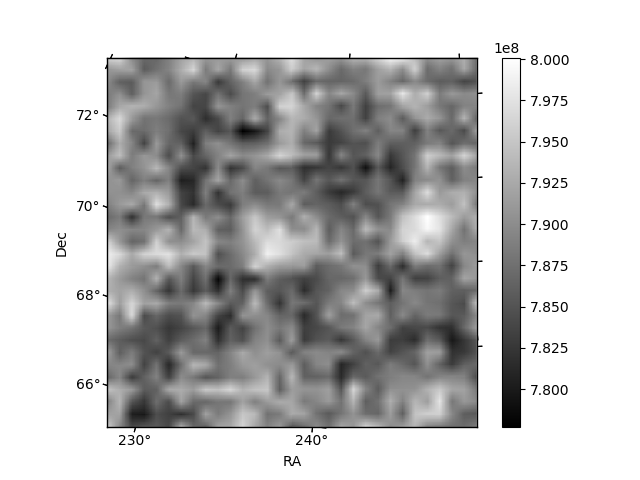
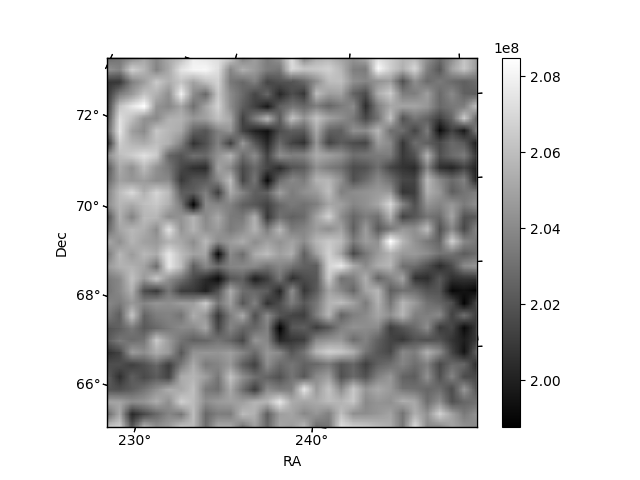
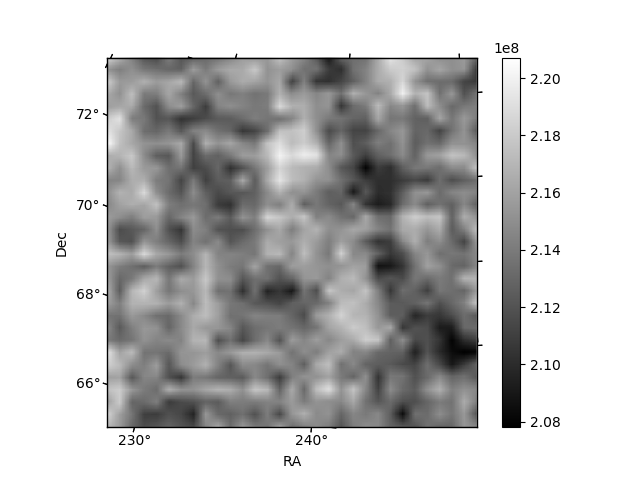
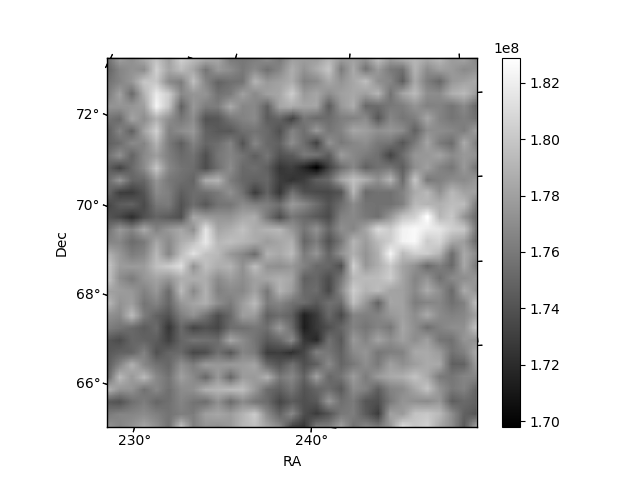
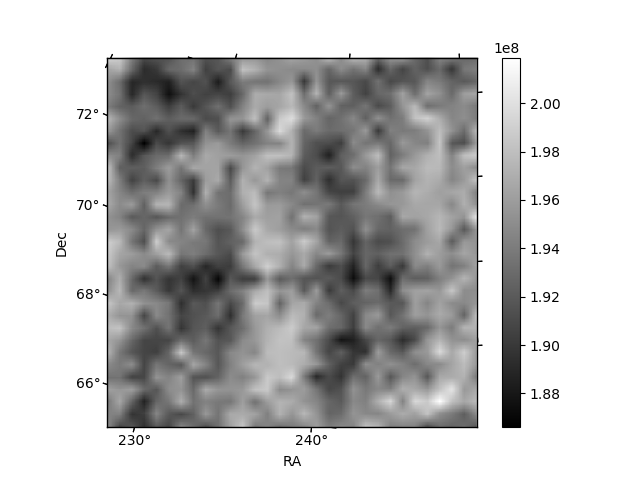
Histogram calculated using DETX and DETY for each event in the final _common_clean file
| Quadrant A | 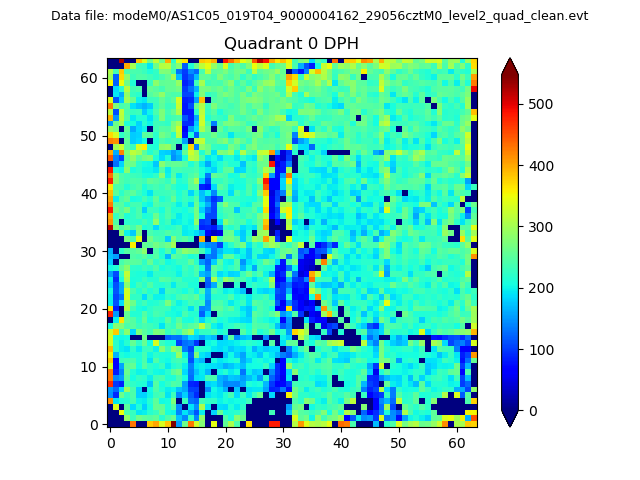 |
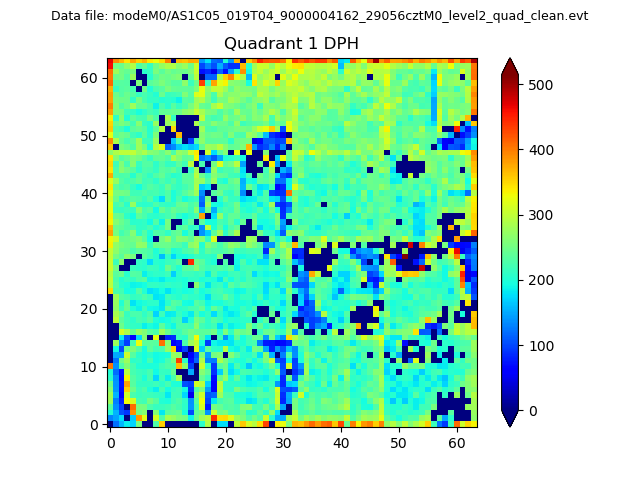 |
Quadrant B |
|---|---|---|---|
| Quadrant D |  |
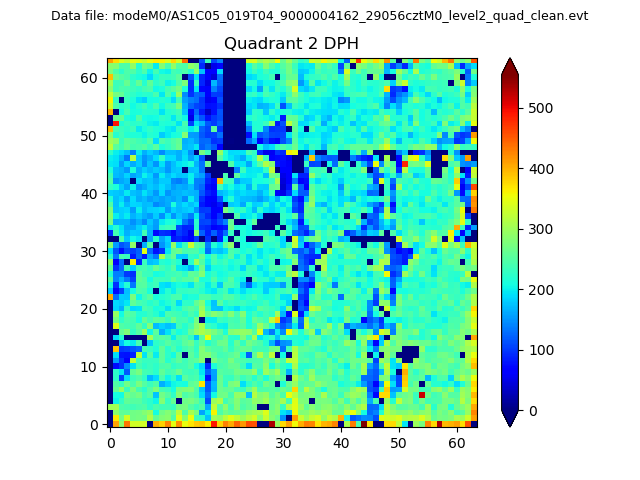 |
Quadrant C |
| Plot type | Count rate plots | Images |
|---|---|---|
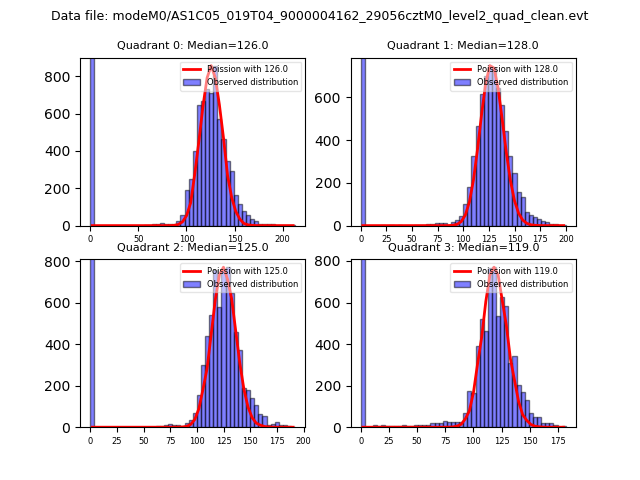
| Comparison with Poisson distribution Blue bars denote a histogram of data divided into 1 sec bins. Red curve is a Poisson curve with rate = median count rate of data. |
 |
 |
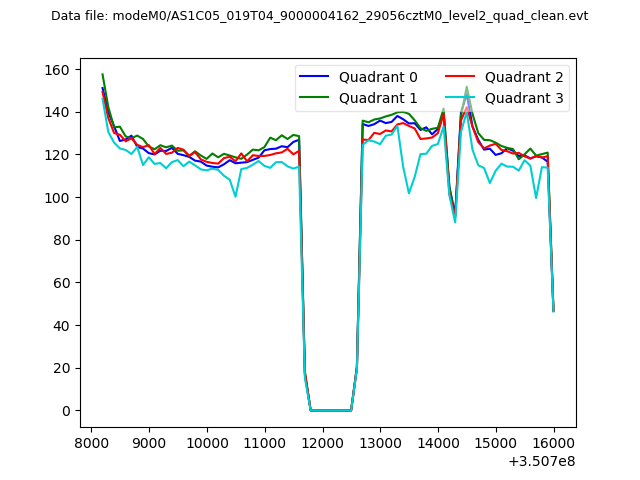
| Quadrant-wise count rates Data is divided into 100 sec bins |
 |
|
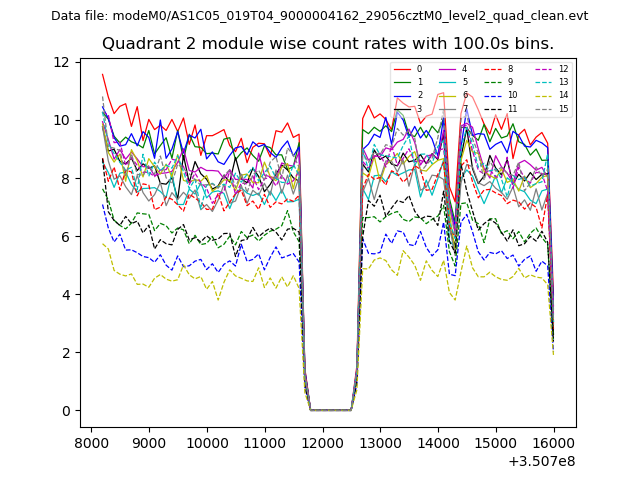
| Module-wise count rates for Quadrant A Data is divided into 100 sec bins |
 |
 |
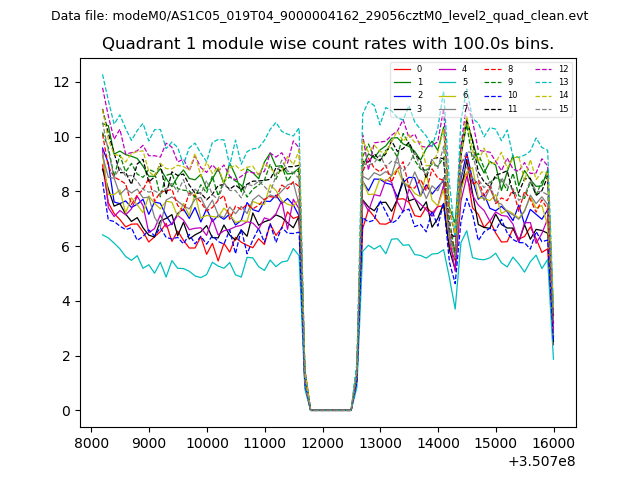
| Module-wise count rates for Quadrant B Data is divided into 100 sec bins |
 |
 |
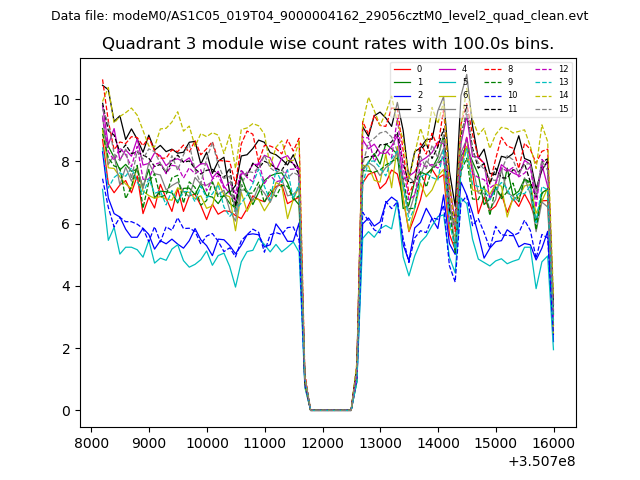
| Module-wise count rates for Quadrant C Data is divided into 100 sec bins |
 |
 |
| Module-wise count rates for Quadrant D Data is divided into 100 sec bins |
 |
 |
| Parameter | Plot |
|---|---|
| CZT HV Monitor | 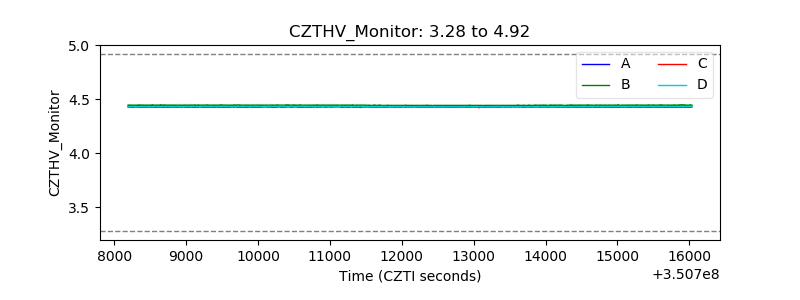 |
| D_VDD | 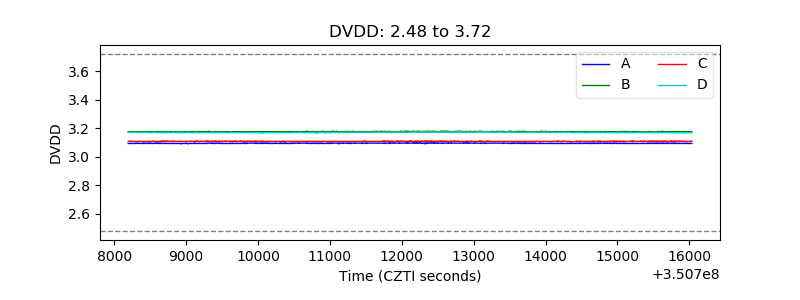 |
| Temperature 1 | 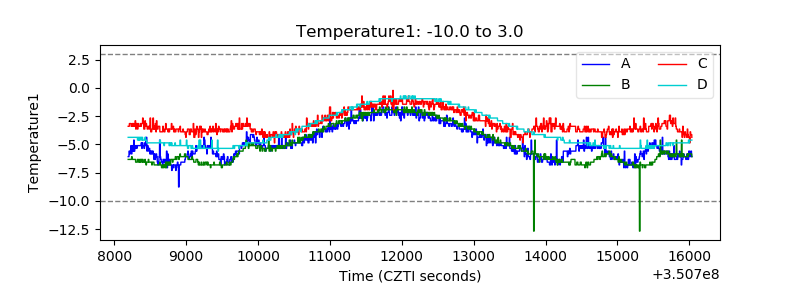 |
| Veto HV Monitor | 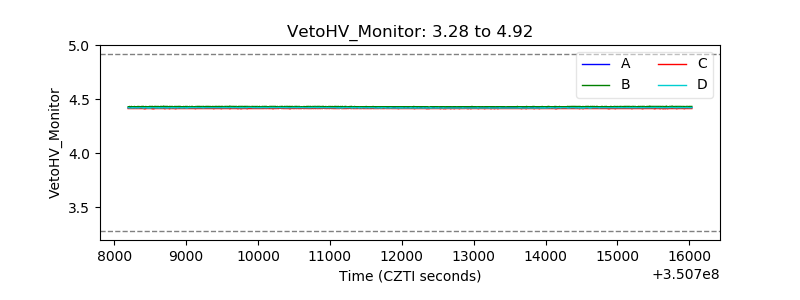 |
| Veto LLD | 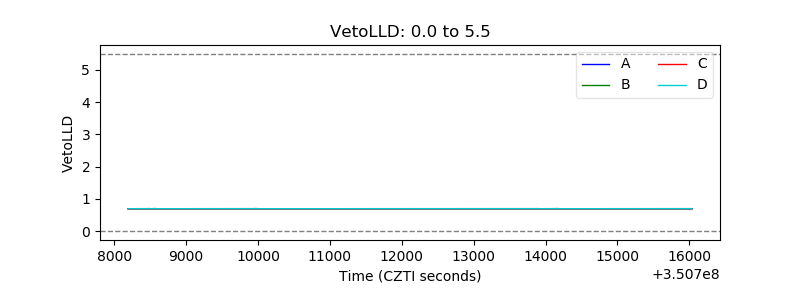 |
| Alpha Counter | 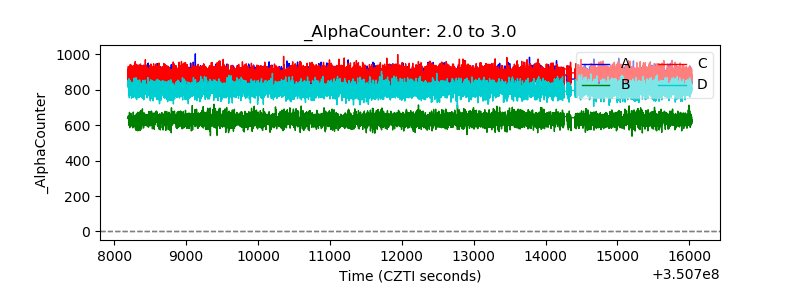 |
| _CPM_Rate | 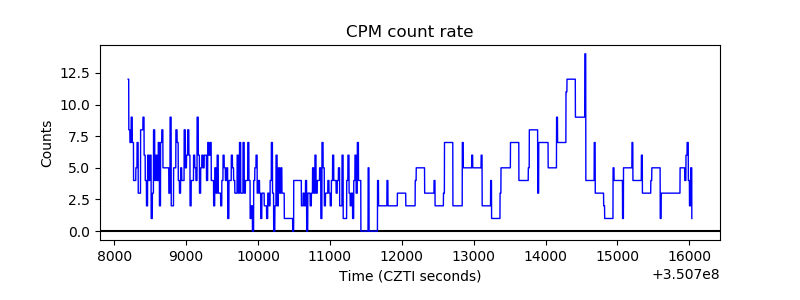 |
| CZT Counter | 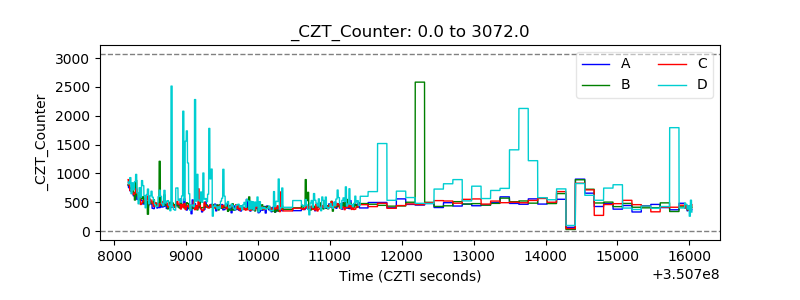 |
| +2.5 Volts monitor |  |
| +5 Volts monitor |  |
| _ROLL_ROT | 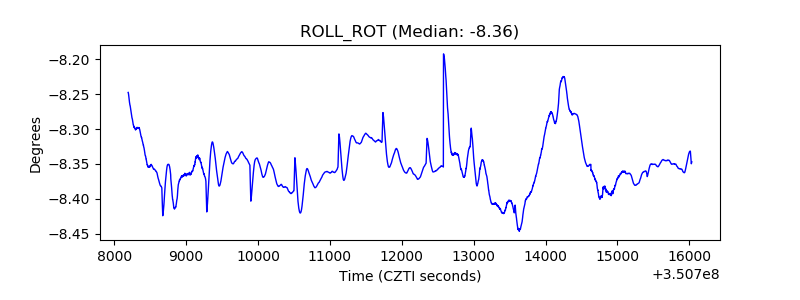 |
| _Roll_DEC | 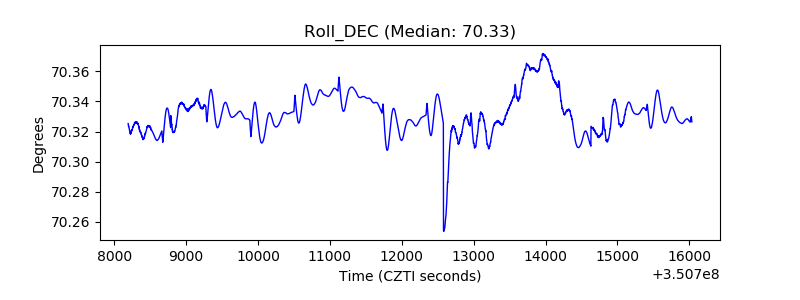 |
| _Roll_RA | 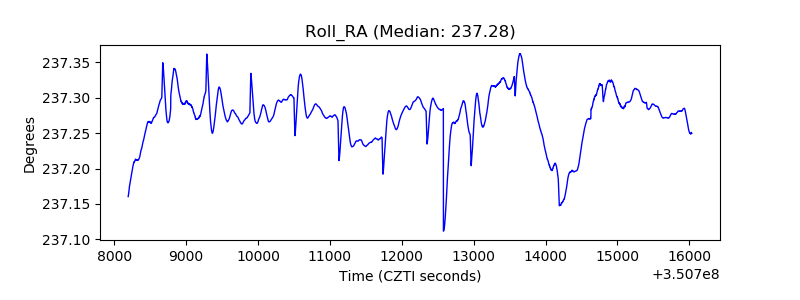 |
| Veto Counter | 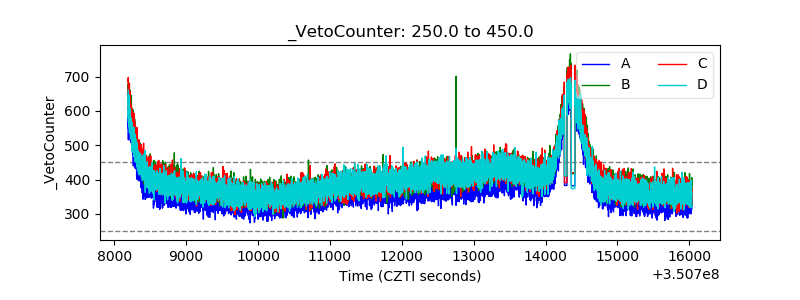 |