| Param | Original file | Final file |
|---|---|---|
| Filename | modeM0/AS1C05_019T04_9000004162_29057cztM0_level2.evt | modeM0/AS1C05_019T04_9000004162_29057cztM0_level2_quad_clean.evt |
| Size (bytes) | 496,252,800 | 117,005,760 |
| Size | 473.3 MB | 111.6 MB |
| Events in quadrant A | 3,217,635 | 767,848 |
| Events in quadrant B | 3,325,836 | 785,790 |
| Events in quadrant C | 3,368,395 | 760,258 |
| Events in quadrant D | 4,630,182 | 730,586 |
| Mode SS | |||
|---|---|---|---|
| Quadrant | BADHDUFLAG | Total packets | Discarded packets |
| A | 0 | 146 | 0 |
| B | 0 | 146 | 0 |
| C | 0 | 146 | 0 |
| D | 0 | 146 | 0 |
| Mode M9 | |||
|---|---|---|---|
| Quadrant | BADHDUFLAG | Total packets | Discarded packets |
| A | 0 | 3 | 0 |
| B | 0 | 3 | 0 |
| C | 0 | 3 | 0 |
| D | 0 | 3 | 0 |
| Mode M0 | |||
|---|---|---|---|
| Quadrant | BADHDUFLAG | Total packets | Discarded packets |
| A | 0 | 14578 | 1 |
| B | 0 | 14786 | 1 |
| C | 0 | 14710 | 1 |
| D | 0 | 18757 | 1 |
| Quadrant | Total seconds | Saturated seconds | Saturation percentage |
|---|---|---|---|
| A | 7167 | 77 | 1.074369% |
| B | 7167 | 81 | 1.130180% |
| C | 7167 | 96 | 1.339473% |
| D | 7167 | 199 | 2.776615% |
Noise dominated data is calculated using 1-second bins in cleaned event files. If a bin has >2000 counts, and if more than 50% of those come from <1% of pixels, then it is considered to be noise-dominated and hence unusable.
| Quadrant | # 1 sec bins | Bins with >0 counts | Bins with >2000 counts | High rate bins dominated by noise | Noise dominated (total time) | Noise dominated (detector-on time) | Marked lightcurve |
|---|---|---|---|---|---|---|---|
| A | 7472 | 7167 | 0 | 0 | 0.00% | 0.00% | 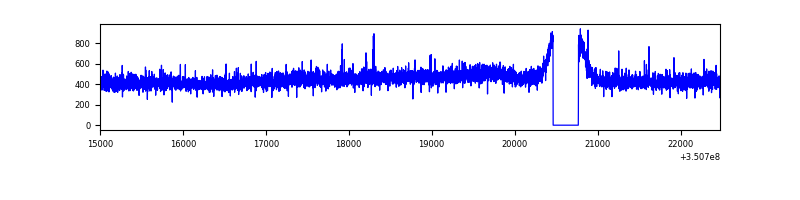 |
| B | 7472 | 7167 | 7 | 7 | 0.09% | 0.10% | 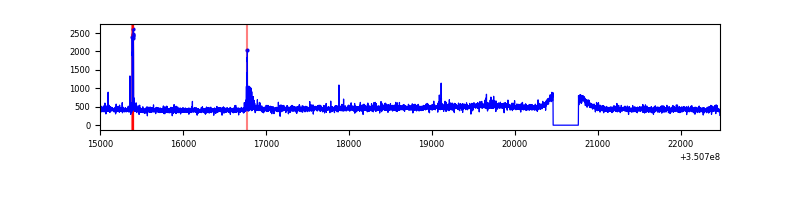 |
| C | 7472 | 7168 | 1 | 1 | 0.01% | 0.01% | 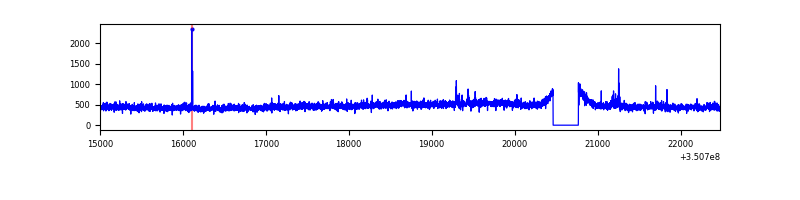 |
| D | 7472 | 7167 | 109 | 109 | 1.46% | 1.52% | 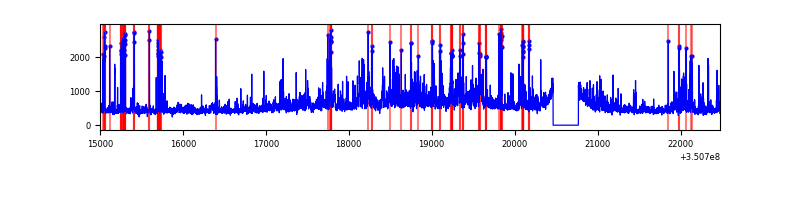 |
Top three noisy pixels from each quadrant. If the there are fewer than three noisy pixels in the level2.evt file, extra rows are filled as -1
| Pixel properties | Quadrant properties | ||||||
|---|---|---|---|---|---|---|---|
| Quadrant | DetID | PixID | Counts | Sigma | Mean | Median | Sigma |
| A | 13 | 254 | 12519 | 69.56 | 832 | 812 | 168.3 |
| A | 3 | 137 | 8322 | 44.62 | 832 | 812 | 168.3 |
| A | 1 | 113 | 8101 | 43.31 | 832 | 812 | 168.3 |
| B | 10 | 245 | 44994 | 276.77 | 827 | 804 | 159.7 |
| B | 15 | 33 | 22680 | 137.01 | 827 | 804 | 159.7 |
| B | 12 | 111 | 19987 | 120.15 | 827 | 804 | 159.7 |
| C | 14 | 238 | 132474 | 702.41 | 800 | 804 | 187.5 |
| C | 3 | 233 | 82041 | 433.37 | 800 | 804 | 187.5 |
| C | 2 | 114 | 16917 | 85.96 | 800 | 804 | 187.5 |
| D | 1 | 52 | 1009343 | 5281.28 | 798 | 774 | 191.0 |
| D | 8 | 195 | 535330 | 2799.15 | 798 | 774 | 191.0 |
| D | 2 | 250 | 34338 | 175.75 | 798 | 774 | 191.0 |
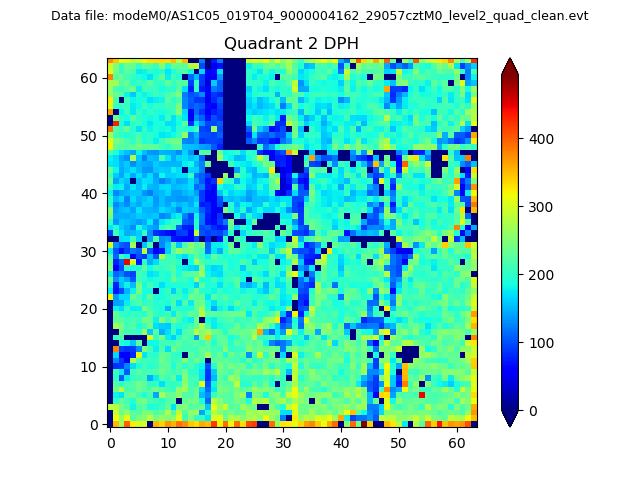
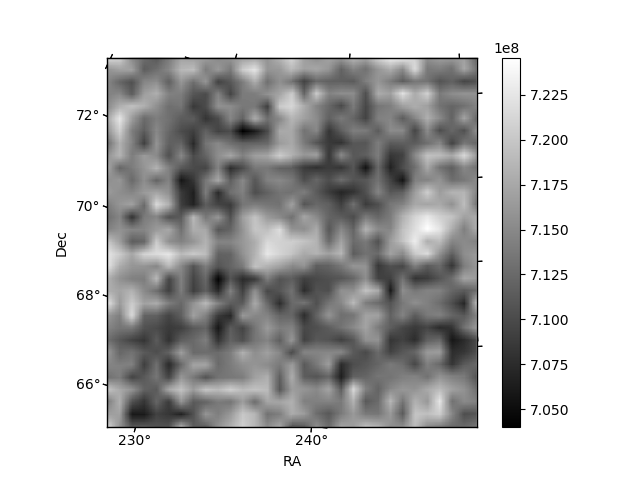
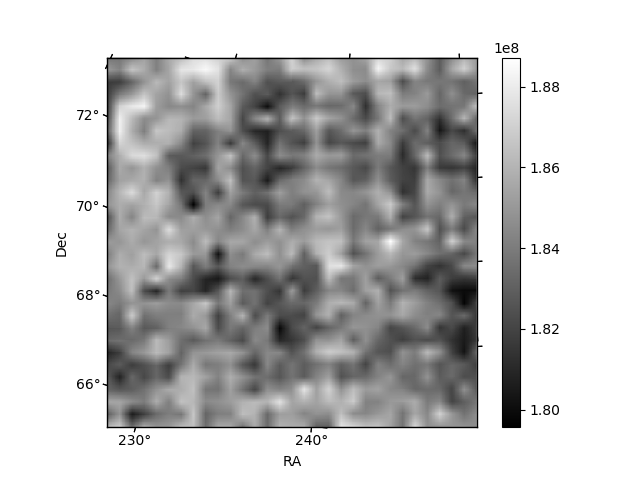
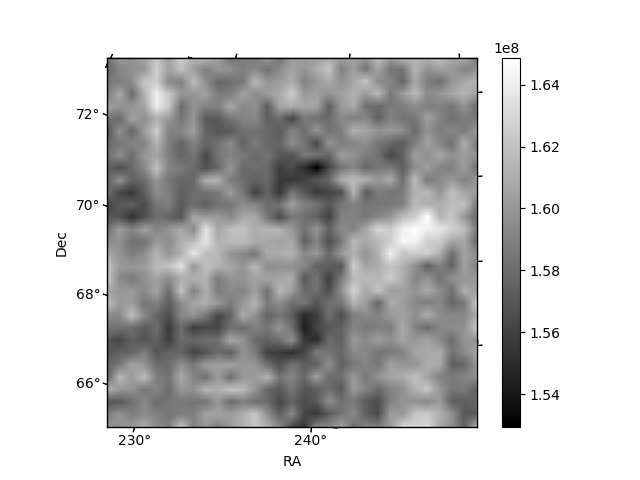
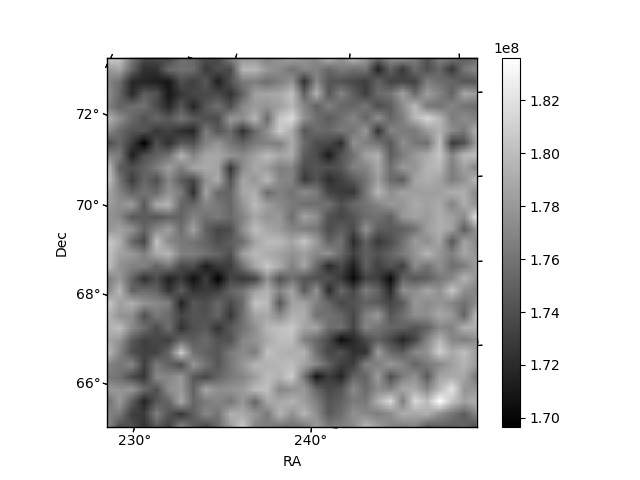
Histogram calculated using DETX and DETY for each event in the final _common_clean file
| Quadrant A | 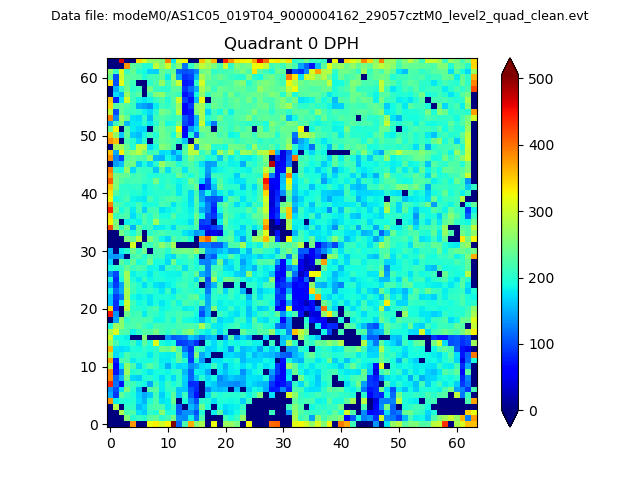 |
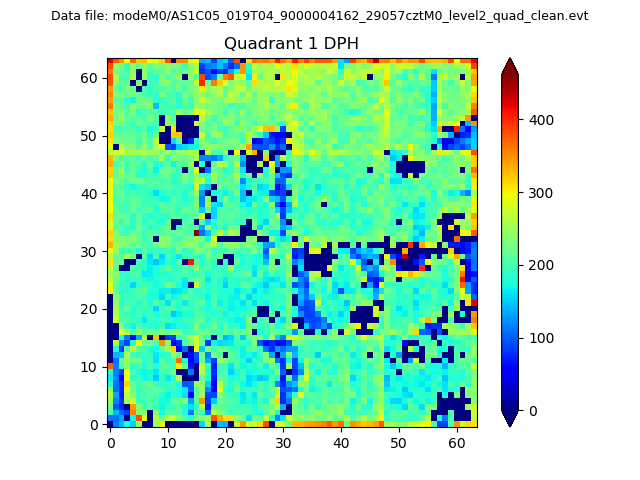 |
Quadrant B |
|---|---|---|---|
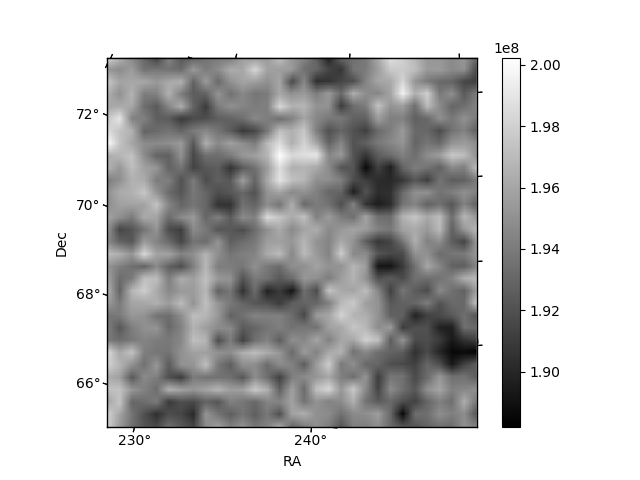
| Quadrant D | 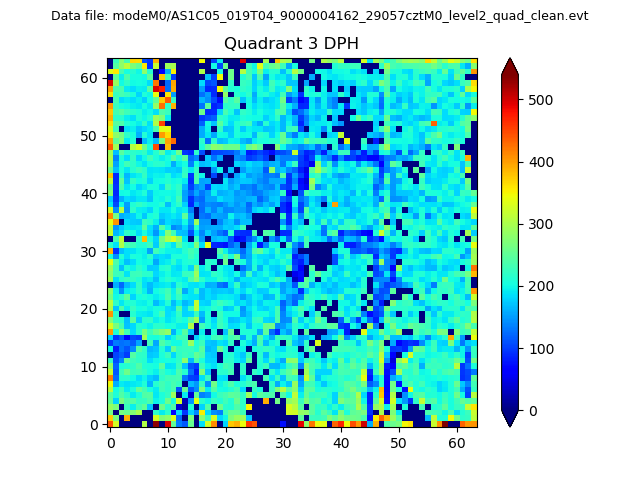 |
 |
Quadrant C |
| Plot type | Count rate plots | Images |
|---|---|---|
| Comparison with Poisson distribution Blue bars denote a histogram of data divided into 1 sec bins. Red curve is a Poisson curve with rate = median count rate of data. |
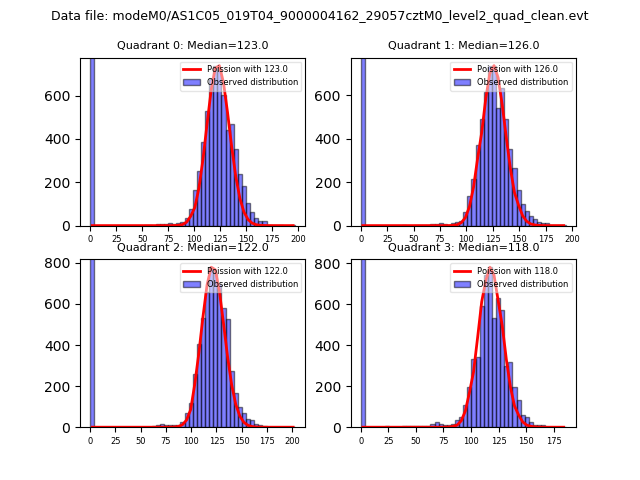 |
 |
| Quadrant-wise count rates Data is divided into 100 sec bins |
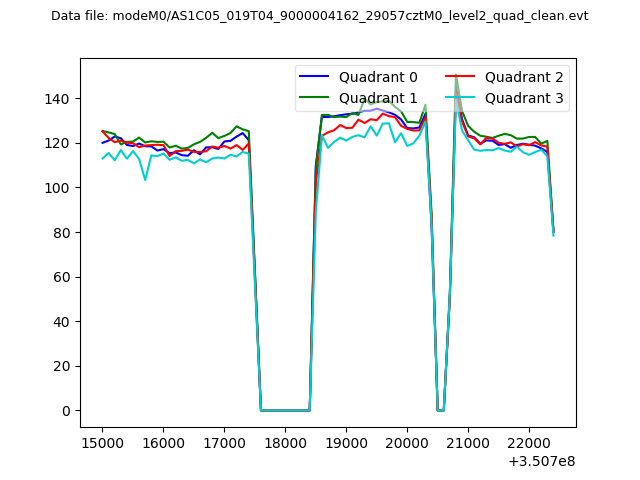 |
|
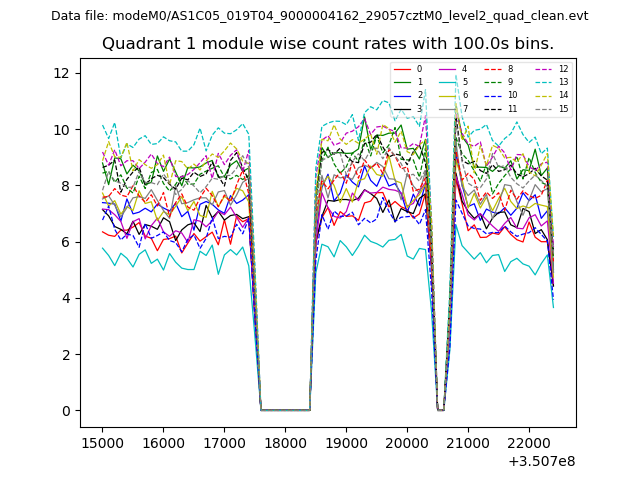
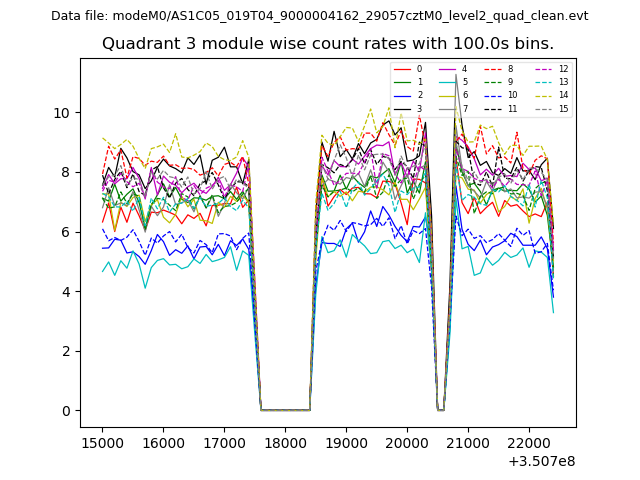
| Module-wise count rates for Quadrant A Data is divided into 100 sec bins |
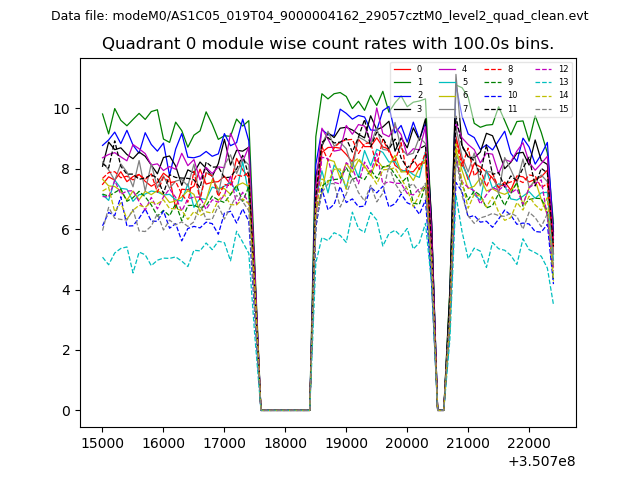 |
 |
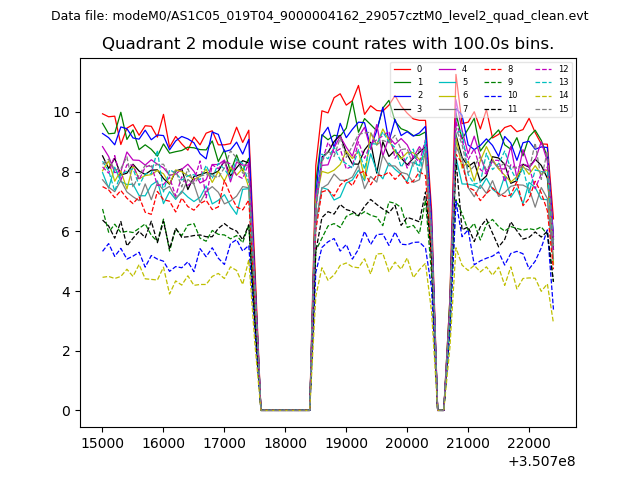
| Module-wise count rates for Quadrant B Data is divided into 100 sec bins |
 |
 |
| Module-wise count rates for Quadrant C Data is divided into 100 sec bins |
 |
 |
| Module-wise count rates for Quadrant D Data is divided into 100 sec bins |
 |
 |
| Parameter | Plot |
|---|---|
| CZT HV Monitor | 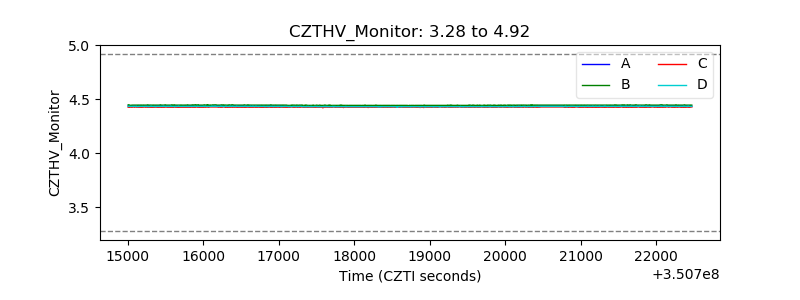 |
| D_VDD |  |
| Temperature 1 | 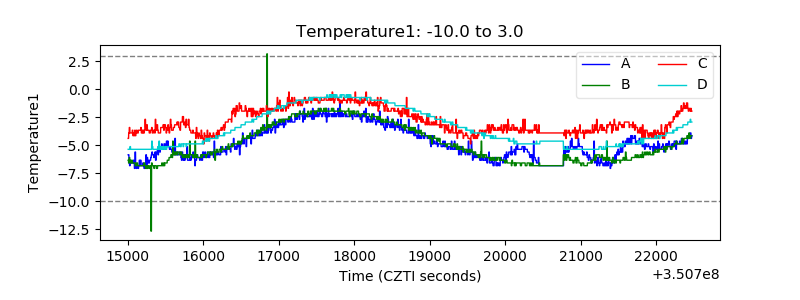 |
| Veto HV Monitor | 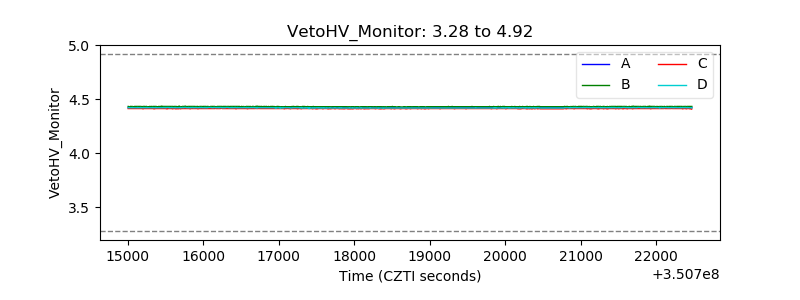 |
| Veto LLD | 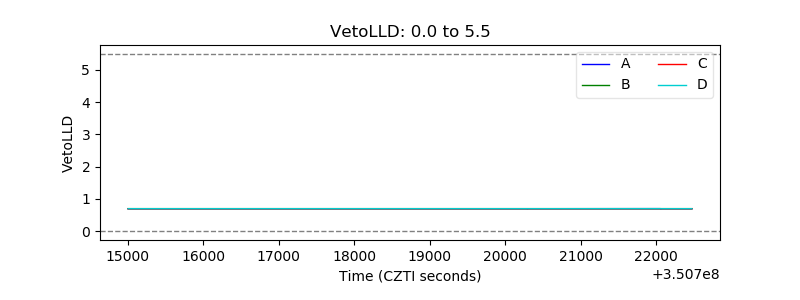 |
| Alpha Counter | 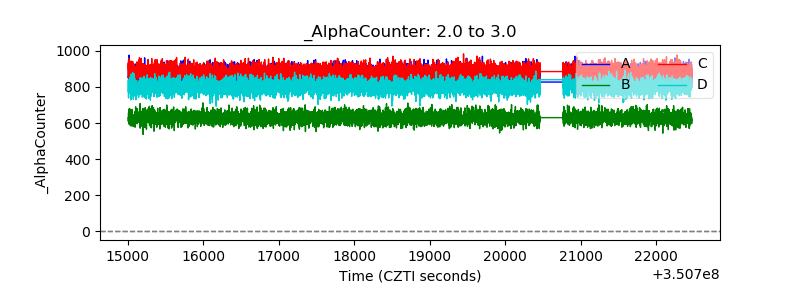 |
| _CPM_Rate | 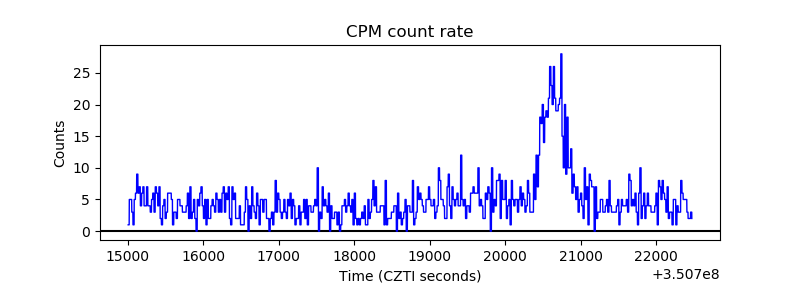 |
| CZT Counter | 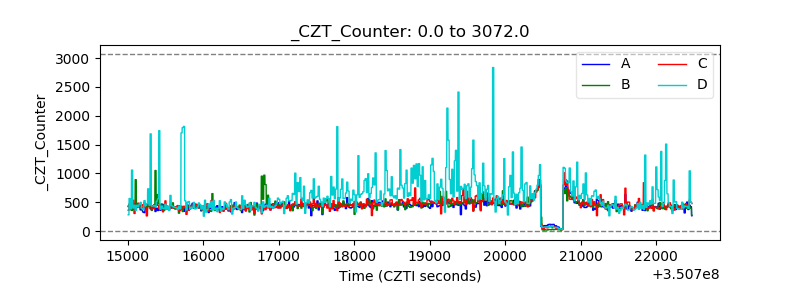 |
| +2.5 Volts monitor |  |
| +5 Volts monitor |  |
| _ROLL_ROT | 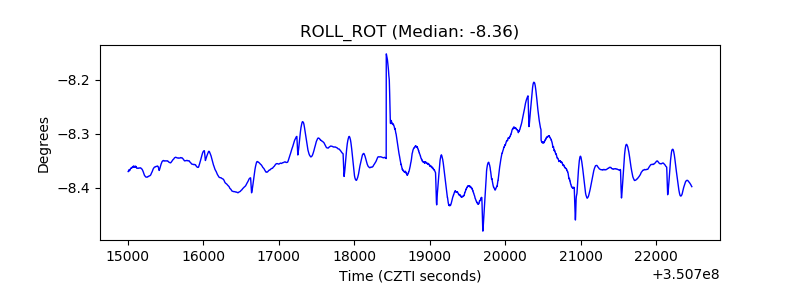 |
| _Roll_DEC | 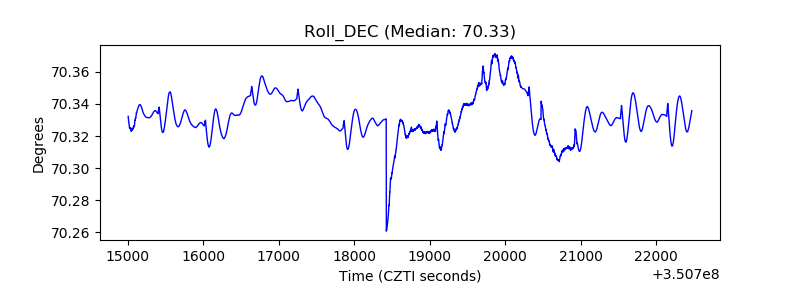 |
| _Roll_RA |  |
| Veto Counter | 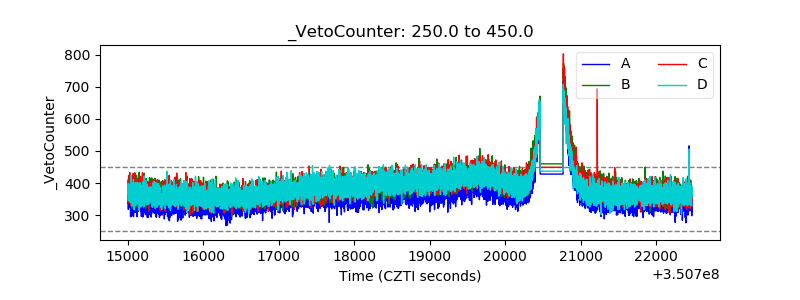 |