| Param | Original file | Final file |
|---|---|---|
| Filename | modeM0/AS1C05_019T04_9000004162_29060cztM0_level2.evt | modeM0/AS1C05_019T04_9000004162_29060cztM0_level2_quad_clean.evt |
| Size (bytes) | 686,154,240 | 128,727,360 |
| Size | 654.4 MB | 122.8 MB |
| Events in quadrant A | 3,963,333 | 839,661 |
| Events in quadrant B | 4,084,570 | 863,428 |
| Events in quadrant C | 4,078,618 | 828,149 |
| Events in quadrant D | 8,061,873 | 760,746 |
| Mode SS | |||
|---|---|---|---|
| Quadrant | BADHDUFLAG | Total packets | Discarded packets |
| A | 0 | 178 | 0 |
| B | 0 | 178 | 0 |
| C | 0 | 178 | 0 |
| D | 0 | 178 | 0 |
| Mode M9 | |||
|---|---|---|---|
| Quadrant | BADHDUFLAG | Total packets | Discarded packets |
| A | 0 | 5 | 0 |
| B | 0 | 5 | 0 |
| C | 0 | 5 | 0 |
| D | 0 | 5 | 0 |
| Mode M0 | |||
|---|---|---|---|
| Quadrant | BADHDUFLAG | Total packets | Discarded packets |
| A | 0 | 17761 | 1 |
| B | 0 | 17971 | 1 |
| C | 0 | 17809 | 1 |
| D | 0 | 29971 | 1 |
| Quadrant | Total seconds | Saturated seconds | Saturation percentage |
|---|---|---|---|
| A | 8731 | 63 | 0.721567% |
| B | 8732 | 74 | 0.847458% |
| C | 8732 | 94 | 1.076500% |
| D | 8732 | 965 | 11.051306% |
Noise dominated data is calculated using 1-second bins in cleaned event files. If a bin has >2000 counts, and if more than 50% of those come from <1% of pixels, then it is considered to be noise-dominated and hence unusable.
| Quadrant | # 1 sec bins | Bins with >0 counts | Bins with >2000 counts | High rate bins dominated by noise | Noise dominated (total time) | Noise dominated (detector-on time) | Marked lightcurve |
|---|---|---|---|---|---|---|---|
| A | 9226 | 8731 | 0 | 0 | 0.00% | 0.00% | 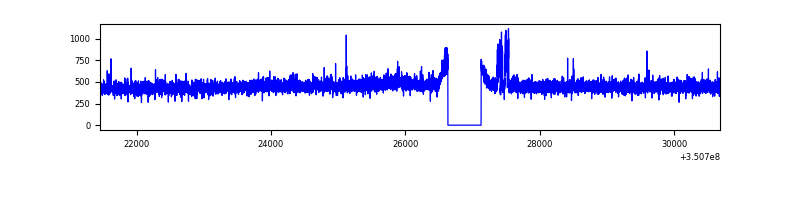 |
| B | 9227 | 8732 | 6 | 6 | 0.07% | 0.07% | 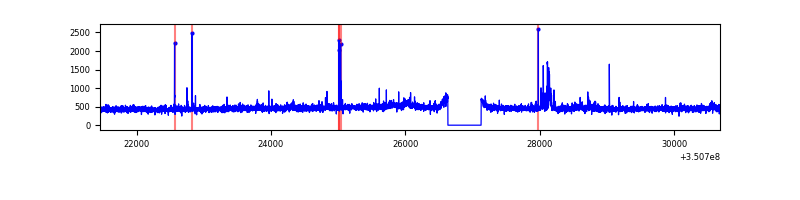 |
| C | 9227 | 8732 | 5 | 5 | 0.05% | 0.06% | 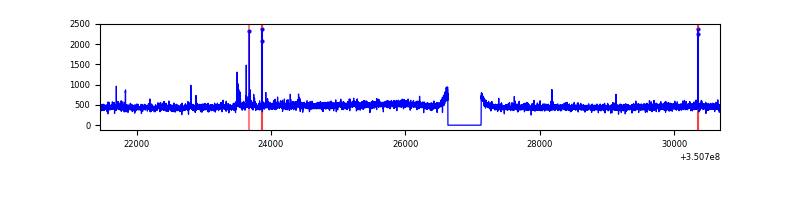 |
| D | 9227 | 8732 | 628 | 628 | 6.81% | 7.19% | 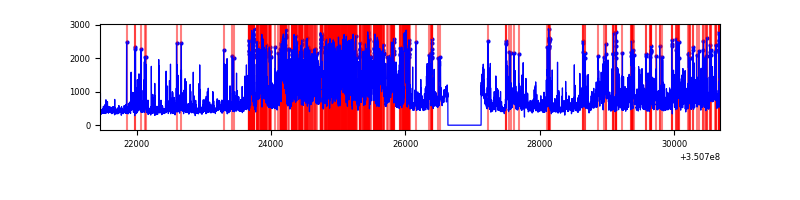 |
Top three noisy pixels from each quadrant. If the there are fewer than three noisy pixels in the level2.evt file, extra rows are filled as -1
| Pixel properties | Quadrant properties | ||||||
|---|---|---|---|---|---|---|---|
| Quadrant | DetID | PixID | Counts | Sigma | Mean | Median | Sigma |
| A | 1 | 113 | 51757 | 248.89 | 1011 | 988 | 204.0 |
| A | 13 | 254 | 14734 | 67.39 | 1011 | 988 | 204.0 |
| A | 3 | 137 | 10260 | 45.45 | 1011 | 988 | 204.0 |
| B | 10 | 245 | 65665 | 335.68 | 1004 | 979 | 192.7 |
| B | 12 | 111 | 23906 | 118.98 | 1004 | 979 | 192.7 |
| B | 11 | 111 | 21942 | 108.79 | 1004 | 979 | 192.7 |
| C | 14 | 238 | 157425 | 696.8 | 965 | 968 | 224.5 |
| C | 3 | 233 | 98250 | 433.26 | 965 | 968 | 224.5 |
| C | 2 | 16 | 30994 | 133.73 | 965 | 968 | 224.5 |
| D | 1 | 52 | 3386565 | 15239.41 | 931 | 902 | 222.2 |
| D | 8 | 195 | 958344 | 4309.6 | 931 | 902 | 222.2 |
| D | 2 | 250 | 75606 | 336.25 | 931 | 902 | 222.2 |
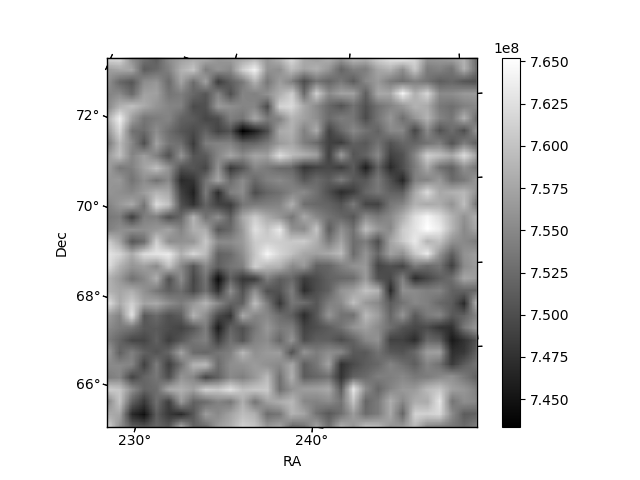
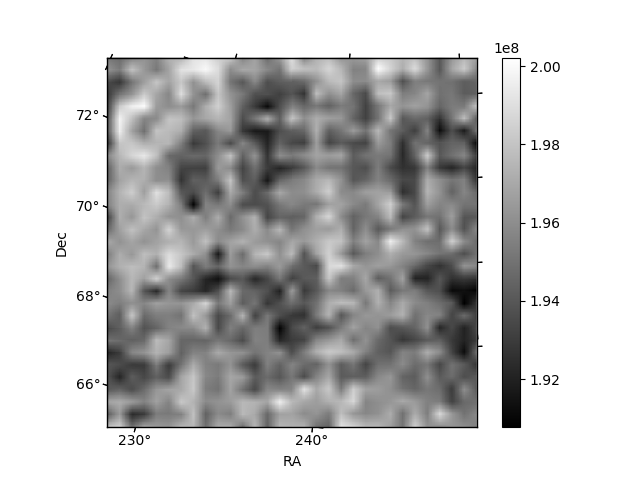
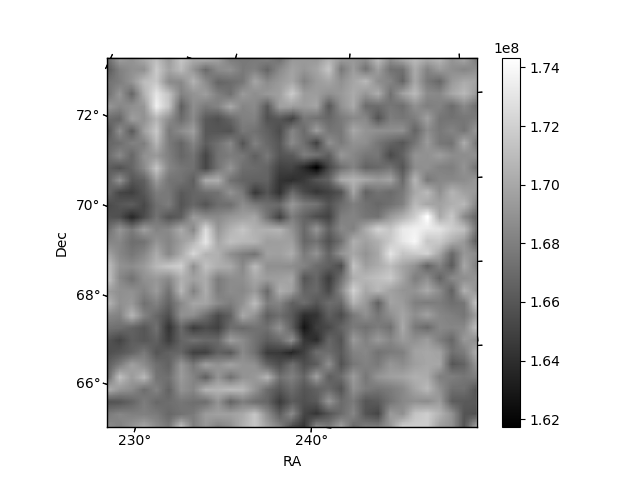
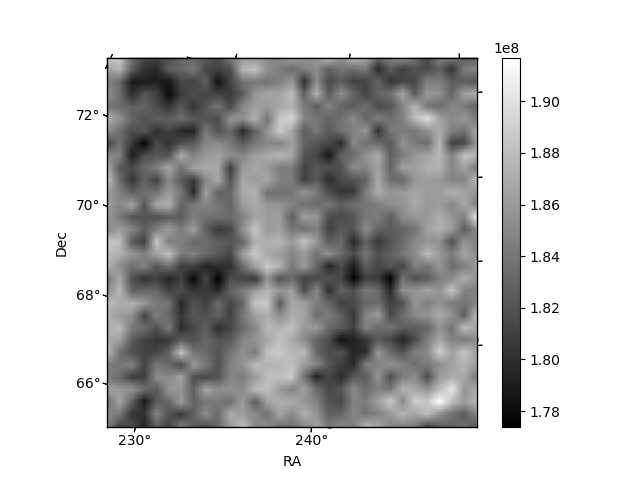
Histogram calculated using DETX and DETY for each event in the final _common_clean file
| Quadrant A | 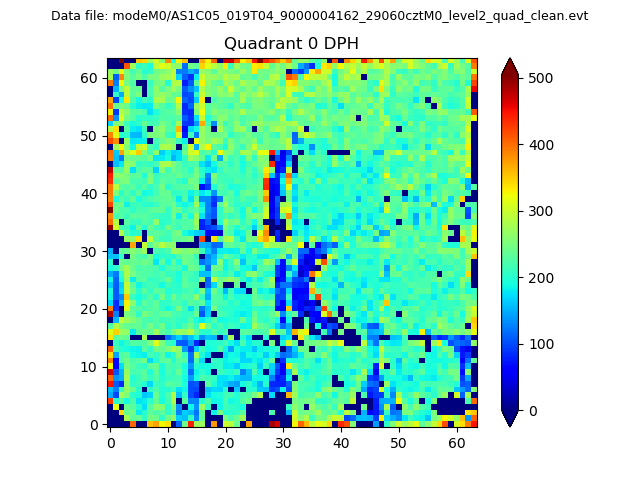 |
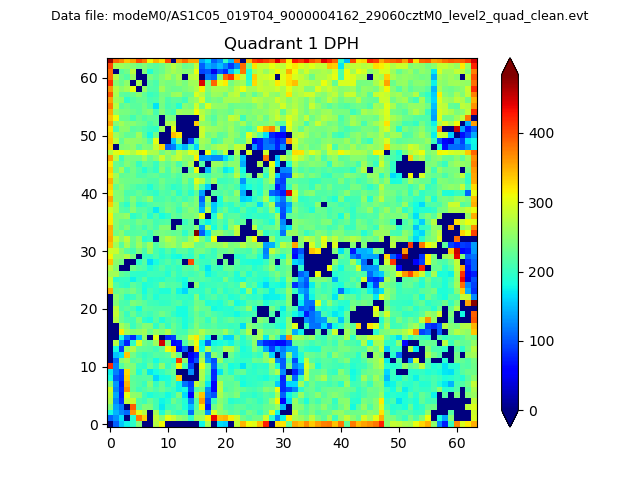 |
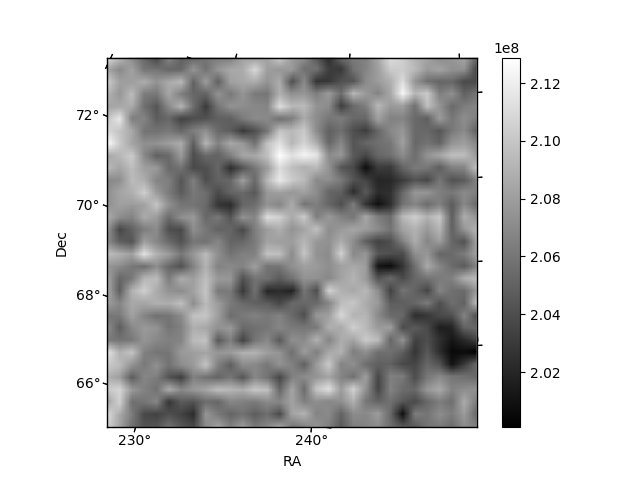
Quadrant B |
|---|---|---|---|
| Quadrant D | 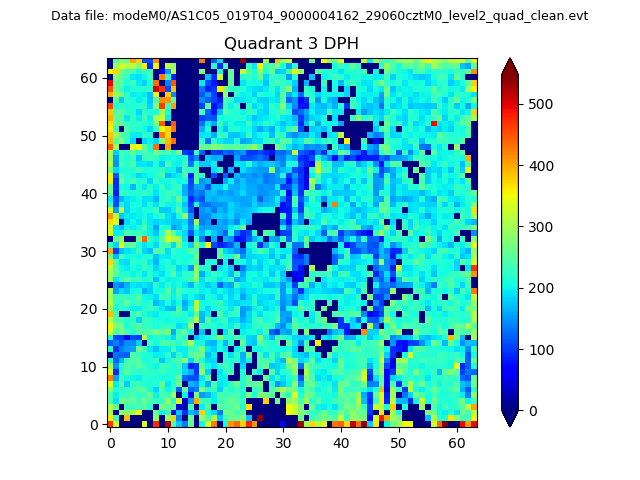 |
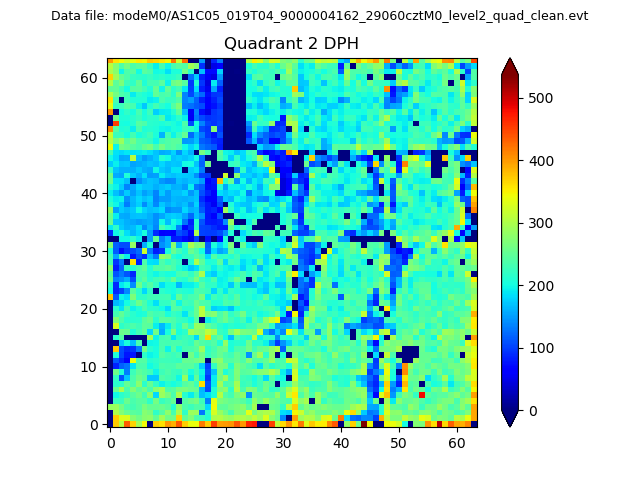 |
Quadrant C |
| Plot type | Count rate plots | Images |
|---|---|---|
| Comparison with Poisson distribution Blue bars denote a histogram of data divided into 1 sec bins. Red curve is a Poisson curve with rate = median count rate of data. |
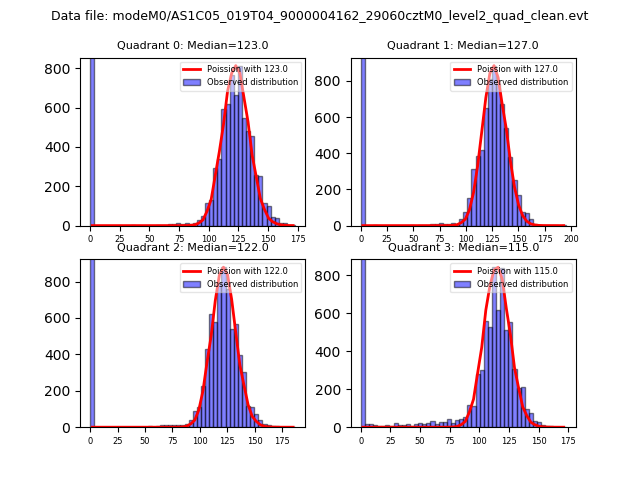 |
 |
| Quadrant-wise count rates Data is divided into 100 sec bins |
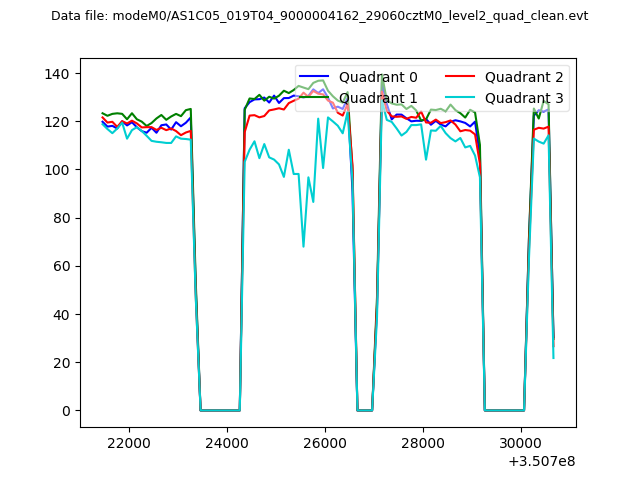 |
|
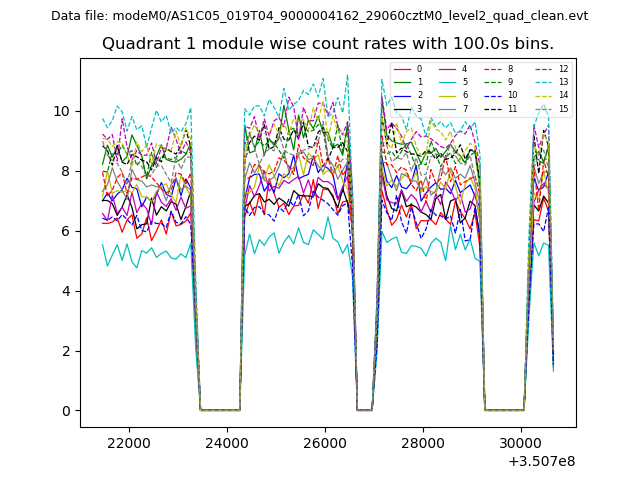
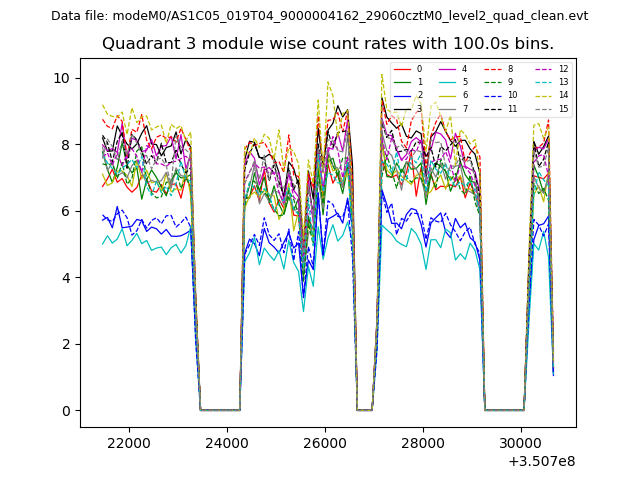
| Module-wise count rates for Quadrant A Data is divided into 100 sec bins |
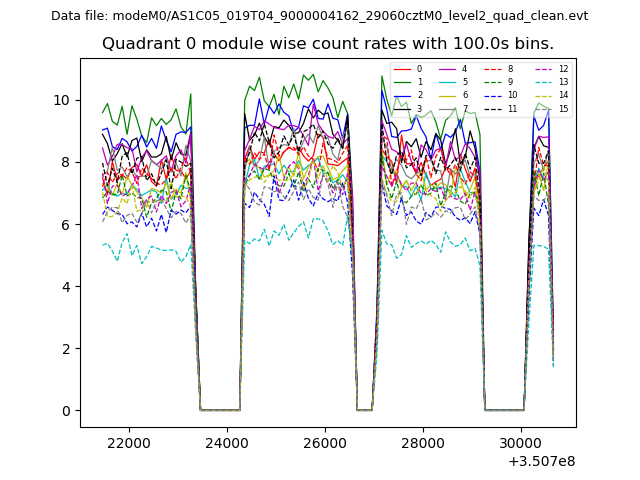 |
 |
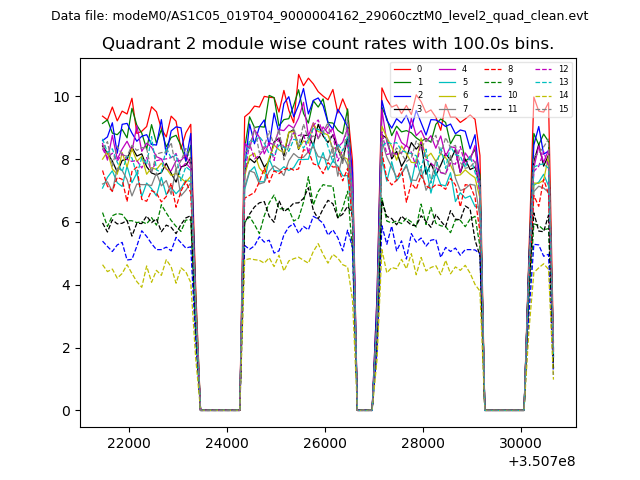
| Module-wise count rates for Quadrant B Data is divided into 100 sec bins |
 |
 |
| Module-wise count rates for Quadrant C Data is divided into 100 sec bins |
 |
 |
| Module-wise count rates for Quadrant D Data is divided into 100 sec bins |
 |
 |
| Parameter | Plot |
|---|---|
| CZT HV Monitor | 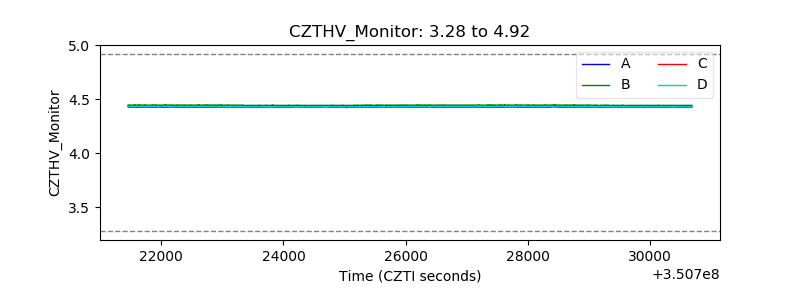 |
| D_VDD | 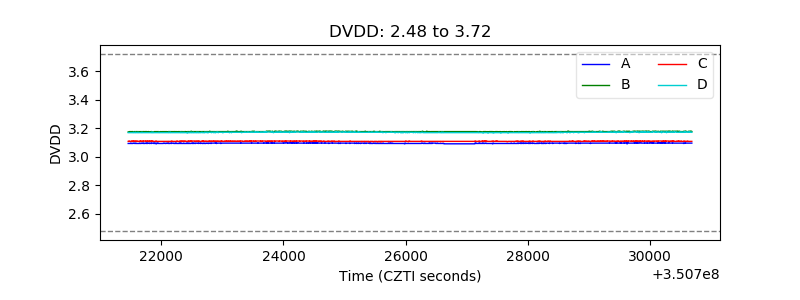 |
| Temperature 1 | 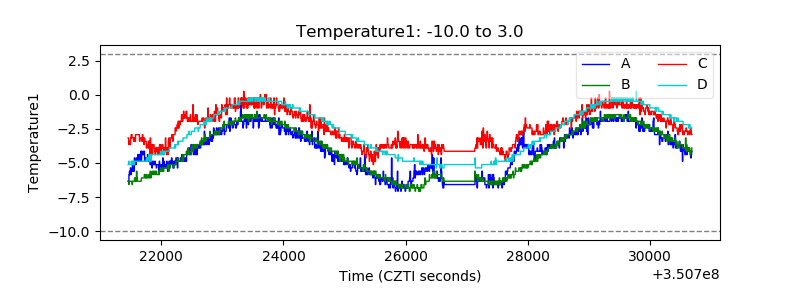 |
| Veto HV Monitor | 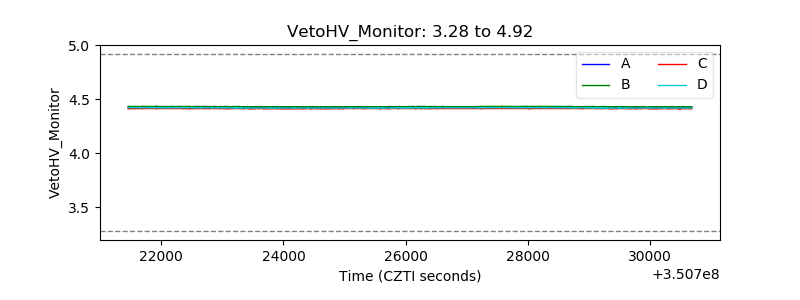 |
| Veto LLD | 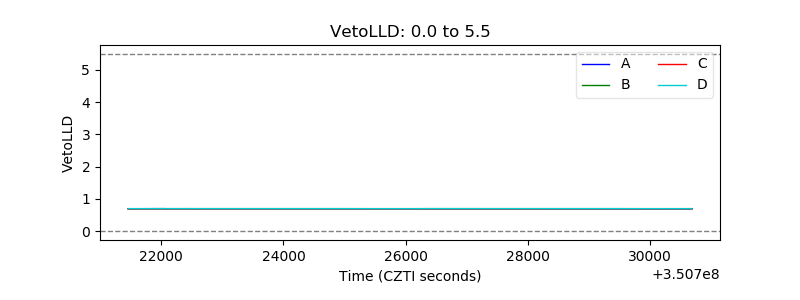 |
| Alpha Counter | 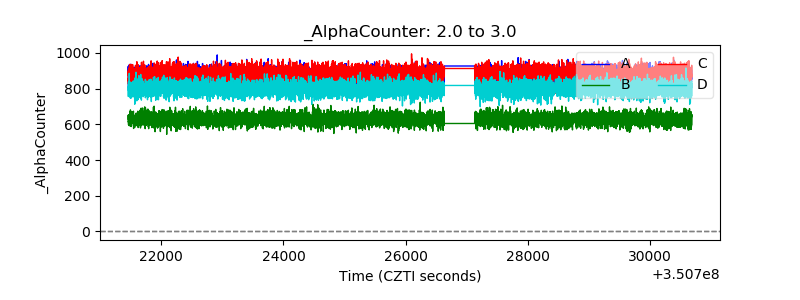 |
| _CPM_Rate | 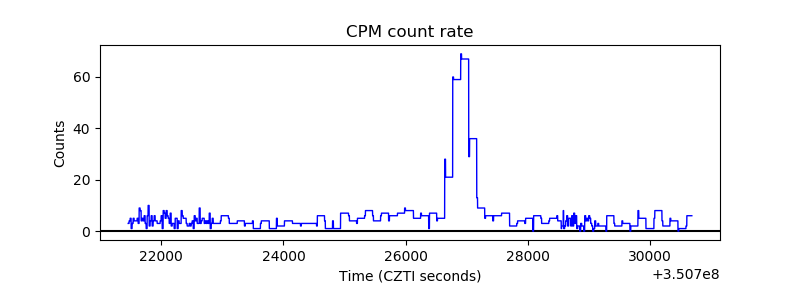 |
| CZT Counter | 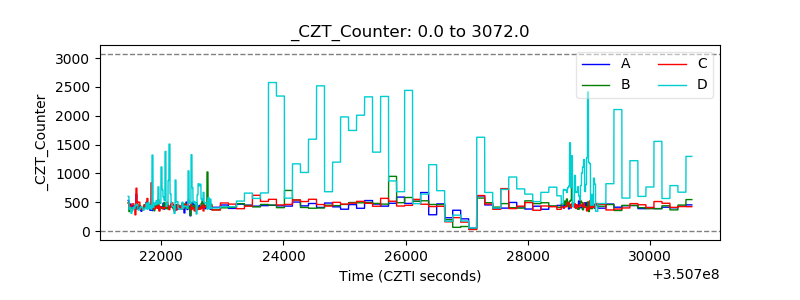 |
| +2.5 Volts monitor | 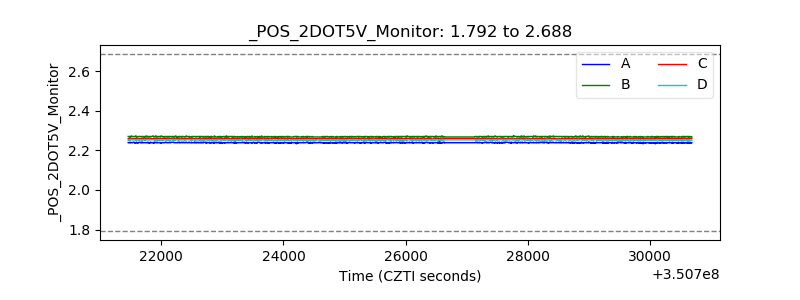 |
| +5 Volts monitor | 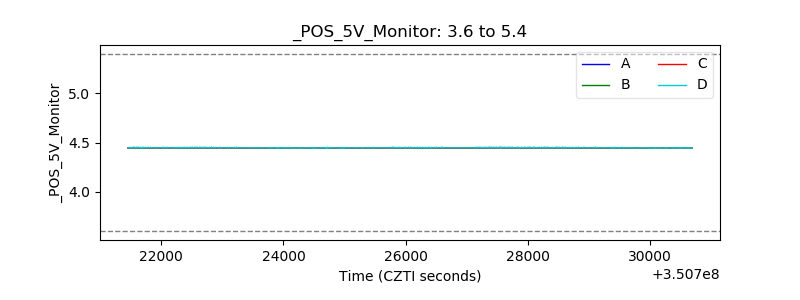 |
| _ROLL_ROT | 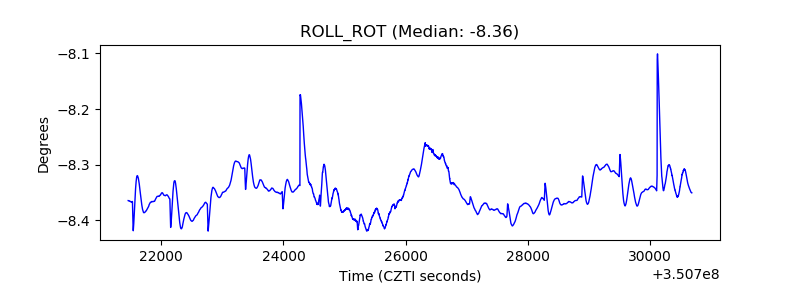 |
| _Roll_DEC | 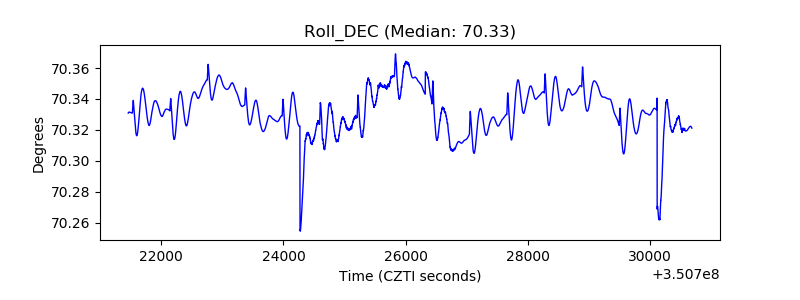 |
| _Roll_RA | 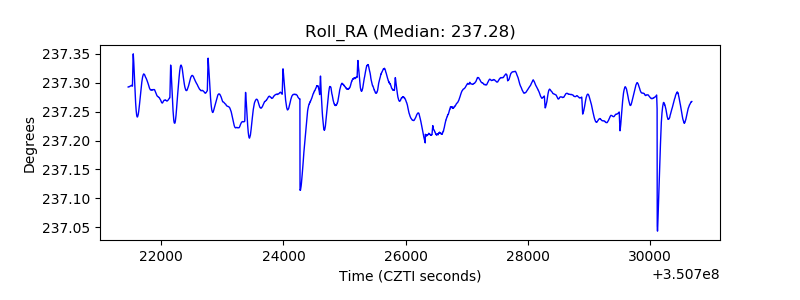 |
| Veto Counter | 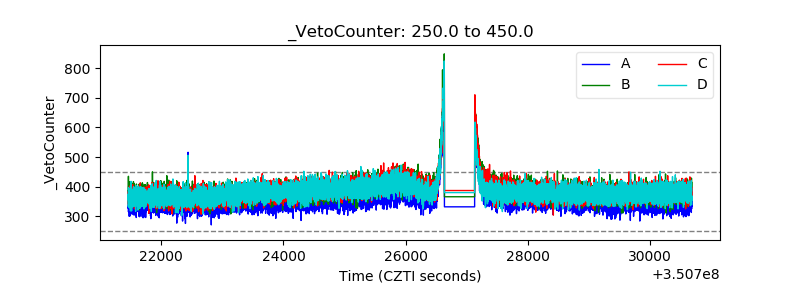 |