| Param | Original file | Final file |
|---|---|---|
| Filename | modeM0/AS1A10_094T20_9000004164cztM0_level2.fits | modeM0/AS1A10_094T20_9000004164cztM0_level2_quad_clean.evt |
| Size (bytes) | 55,298,880 | 31,584,960 |
| Size | 52.7 MB | 30.1 MB |
| Events in quadrant A | 335,644 | 143,786 |
| Events in quadrant B | 321,964 | 145,099 |
| Events in quadrant C | 328,866 | 134,047 |
| Events in quadrant D | 276,218 | 120,269 |
| Mode SS | |||
|---|---|---|---|
| Quadrant | BADHDUFLAG | Total packets | Discarded packets |
| A | 0 | 122 | 0 |
| B | 0 | 122 | 0 |
| C | 0 | 122 | 0 |
| D | 0 | 122 | 0 |
| Mode M9 | |||
|---|---|---|---|
| Quadrant | BADHDUFLAG | Total packets | Discarded packets |
| A | 0 | 8 | 0 |
| B | 0 | 8 | 0 |
| C | 0 | 8 | 0 |
| D | 0 | 8 | 0 |
| Mode M0 | |||
|---|---|---|---|
| Quadrant | BADHDUFLAG | Total packets | Discarded packets |
| A | 0 | 12101 | 0 |
| B | 0 | 12376 | 0 |
| C | 0 | 12076 | 0 |
| D | 0 | 19482 | 0 |
| Quadrant | Total seconds | Saturated seconds | Saturation percentage |
|---|---|---|---|
| A | 5897 | 115 | 1.950144% |
| B | 5897 | 124 | 2.102764% |
| C | 5897 | 161 | 2.730202% |
| D | 5897 | 484 | 8.207563% |
Noise dominated data is calculated using 1-second bins in cleaned event files. If a bin has >2000 counts, and if more than 50% of those come from <1% of pixels, then it is considered to be noise-dominated and hence unusable.
| Quadrant | # 1 sec bins | Bins with >0 counts | Bins with >2000 counts | High rate bins dominated by noise | Noise dominated (total time) | Noise dominated (detector-on time) | Marked lightcurve |
|---|---|---|---|---|---|---|---|
| A | 6596 | 5895 | 0 | 0 | 0.00% | 0.00% | 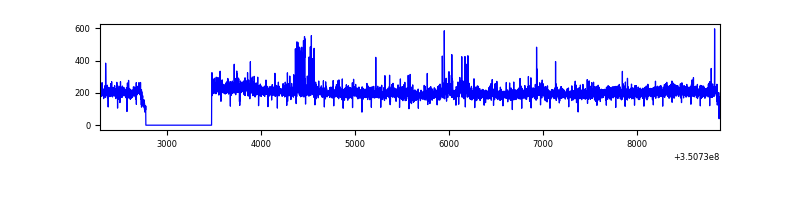 |
| B | 6596 | 5895 | 0 | 0 | 0.00% | 0.00% |  |
| C | 6596 | 5895 | 0 | 0 | 0.00% | 0.00% |  |
| D | 6596 | 5891 | 0 | 0 | 0.00% | 0.00% |  |
Top three noisy pixels from each quadrant. If the there are fewer than three noisy pixels in the level2.evt file, extra rows are filled as -1
| Pixel properties | Quadrant properties | ||||||
|---|---|---|---|---|---|---|---|
| Quadrant | DetID | PixID | Counts | Sigma | Mean | Median | Sigma |
| A | 14 | 188 | 358 | 11.66 | 87 | 82 | 23.7 |
| A | 0 | 29 | 338 | 10.81 | 87 | 82 | 23.7 |
| A | 14 | 204 | 298 | 9.12 | 87 | 82 | 23.7 |
| B | 2 | 9 | 271 | 9.89 | 85 | 81 | 19.2 |
| B | 2 | 8 | 229 | 7.7 | 85 | 81 | 19.2 |
| B | 3 | 80 | 217 | 7.08 | 85 | 81 | 19.2 |
| C | 9 | 209 | 242 | 6.65 | 87 | 81 | 24.2 |
| C | 9 | 233 | 241 | 6.61 | 87 | 81 | 24.2 |
| C | 7 | 111 | 235 | 6.36 | 87 | 81 | 24.2 |
| D | 4 | 246 | 221 | 6.78 | 78 | 71 | 22.1 |
| D | 15 | 46 | 220 | 6.73 | 78 | 71 | 22.1 |
| D | 10 | 113 | 204 | 6.01 | 78 | 71 | 22.1 |
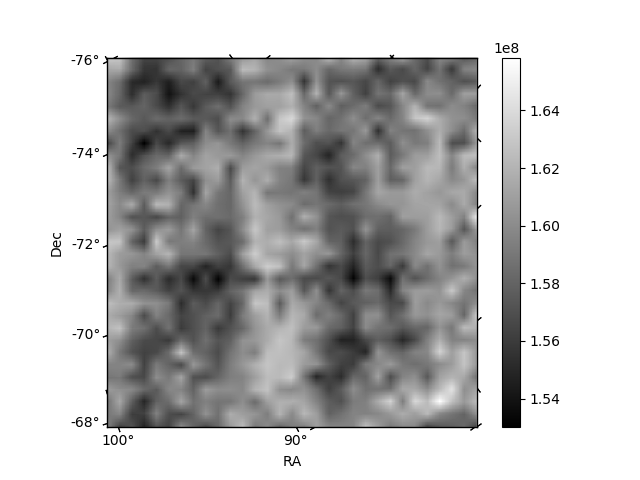
Histogram calculated using DETX and DETY for each event in the final _common_clean file
| Quadrant A |  |
 |
Quadrant B |
|---|---|---|---|
| Quadrant D |  |
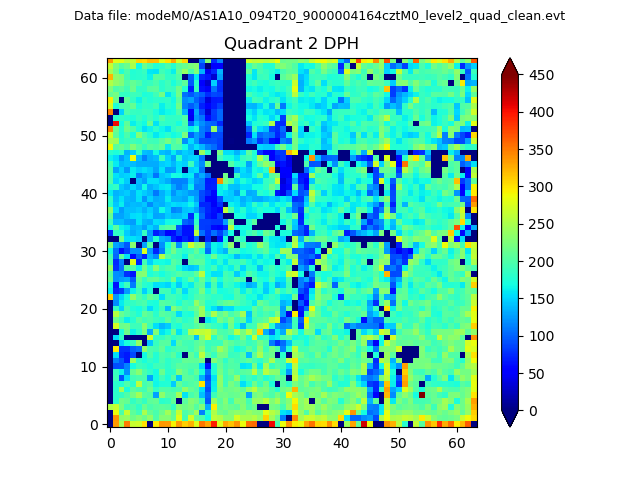 |
Quadrant C |
| Plot type | Count rate plots | Images |
|---|---|---|
| Comparison with Poisson distribution Blue bars denote a histogram of data divided into 1 sec bins. Red curve is a Poisson curve with rate = median count rate of data. |
 |
 |
| Quadrant-wise count rates Data is divided into 100 sec bins |
 |
|
| Module-wise count rates for Quadrant A Data is divided into 100 sec bins |
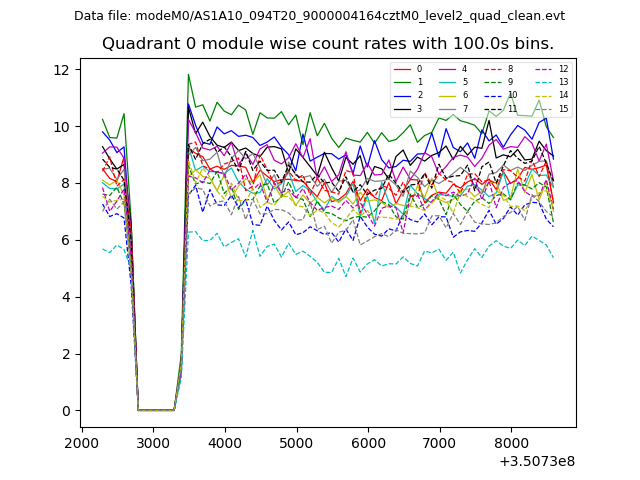 |
 |
| Module-wise count rates for Quadrant B Data is divided into 100 sec bins |
 |
 |
| Module-wise count rates for Quadrant C Data is divided into 100 sec bins |
 |
 |
| Module-wise count rates for Quadrant D Data is divided into 100 sec bins |
 |
 |
| Parameter | Plot |
|---|---|
| CZT HV Monitor |  |
| D_VDD |  |
| Temperature 1 |  |
| Veto HV Monitor |  |
| Veto LLD | 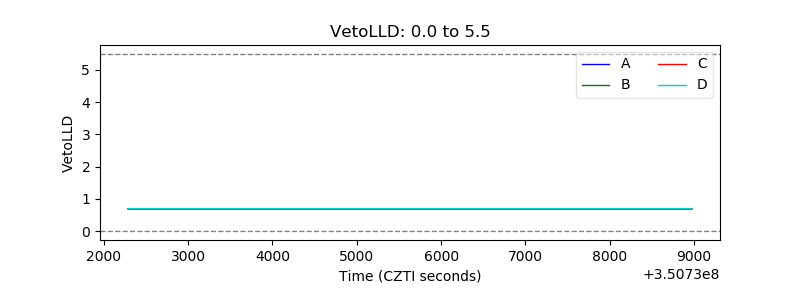 |
| Alpha Counter |  |
| _CPM_Rate | 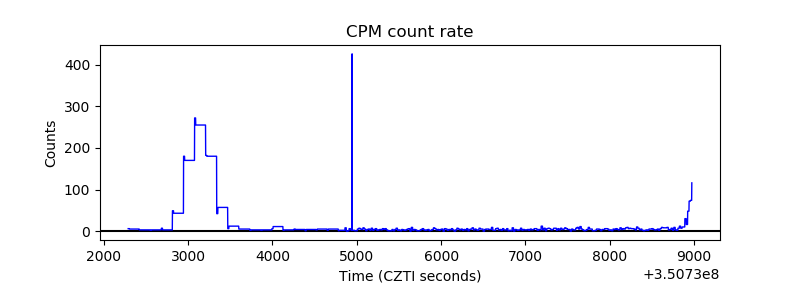 |
| CZT Counter | 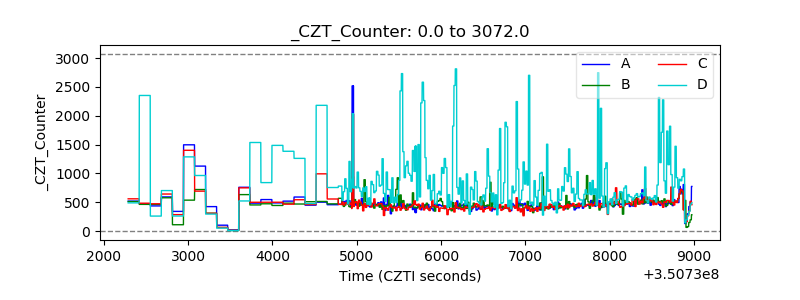 |
| +2.5 Volts monitor |  |
| +5 Volts monitor |  |
| _ROLL_ROT |  |
| _Roll_DEC |  |
| _Roll_RA | 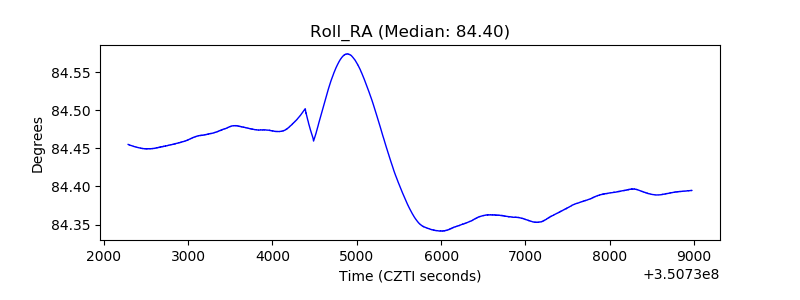 |
| Veto Counter | 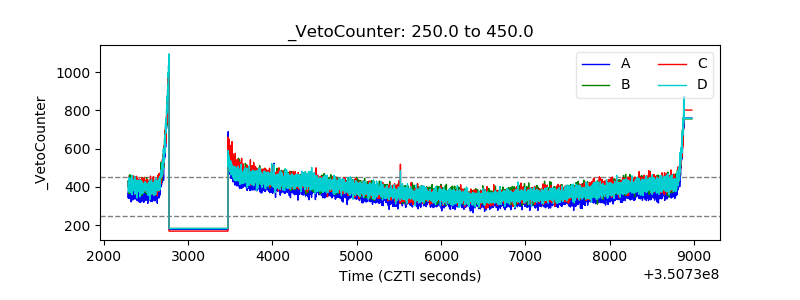 |