| Param | Original file | Final file |
|---|---|---|
| Filename | modeM0/AS1A10_094T20_9000004164_29060cztM0_level2.evt | modeM0/AS1A10_094T20_9000004164_29060cztM0_level2_quad_clean.evt |
| Size (bytes) | 248,621,760 | 56,871,360 |
| Size | 237.1 MB | 54.2 MB |
| Events in quadrant A | 1,481,413 | 386,122 |
| Events in quadrant B | 1,517,820 | 394,778 |
| Events in quadrant C | 1,475,169 | 376,490 |
| Events in quadrant D | 2,848,755 | 349,798 |
| Mode SS | |||
|---|---|---|---|
| Quadrant | BADHDUFLAG | Total packets | Discarded packets |
| A | 0 | 62 | 0 |
| B | 0 | 62 | 0 |
| C | 0 | 62 | 0 |
| D | 0 | 62 | 0 |
| Mode M9 | |||
|---|---|---|---|
| Quadrant | BADHDUFLAG | Total packets | Discarded packets |
| A | 0 | 7 | 0 |
| B | 0 | 7 | 0 |
| C | 0 | 7 | 0 |
| D | 0 | 7 | 0 |
| Mode M0 | |||
|---|---|---|---|
| Quadrant | BADHDUFLAG | Total packets | Discarded packets |
| A | 0 | 6257 | 1 |
| B | 0 | 6333 | 1 |
| C | 0 | 6221 | 1 |
| D | 0 | 10581 | 1 |
| Quadrant | Total seconds | Saturated seconds | Saturation percentage |
|---|---|---|---|
| A | 3015 | 77 | 2.553897% |
| B | 3015 | 76 | 2.520730% |
| C | 3015 | 99 | 3.283582% |
| D | 3015 | 335 | 11.111111% |
Noise dominated data is calculated using 1-second bins in cleaned event files. If a bin has >2000 counts, and if more than 50% of those come from <1% of pixels, then it is considered to be noise-dominated and hence unusable.
| Quadrant | # 1 sec bins | Bins with >0 counts | Bins with >2000 counts | High rate bins dominated by noise | Noise dominated (total time) | Noise dominated (detector-on time) | Marked lightcurve |
|---|---|---|---|---|---|---|---|
| A | 3715 | 3015 | 0 | 0 | 0.00% | 0.00% | 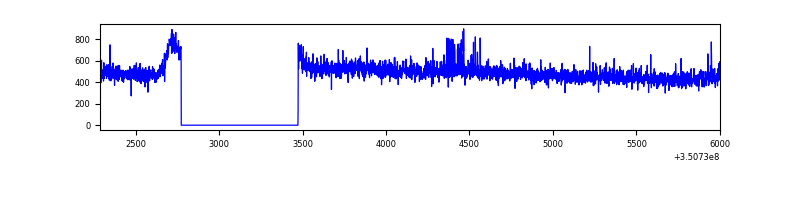 |
| B | 3714 | 3014 | 3 | 3 | 0.08% | 0.10% | 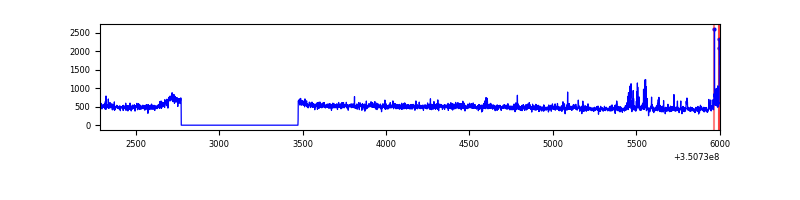 |
| C | 3715 | 3015 | 0 | 0 | 0.00% | 0.00% | 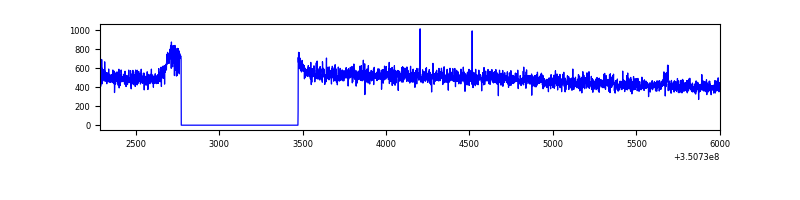 |
| D | 3715 | 3015 | 202 | 202 | 5.44% | 6.70% | 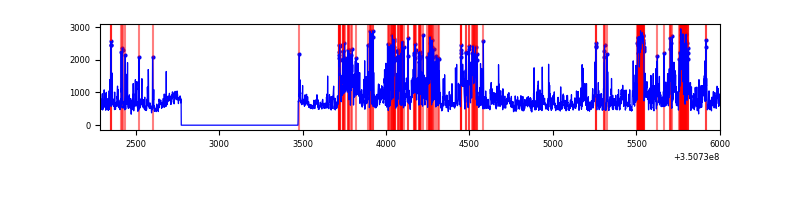 |
Top three noisy pixels from each quadrant. If the there are fewer than three noisy pixels in the level2.evt file, extra rows are filled as -1
| Pixel properties | Quadrant properties | ||||||
|---|---|---|---|---|---|---|---|
| Quadrant | DetID | PixID | Counts | Sigma | Mean | Median | Sigma |
| A | 6 | 16 | 16089 | 201.57 | 376 | 367 | 78.0 |
| A | 1 | 113 | 14145 | 176.65 | 376 | 367 | 78.0 |
| A | 13 | 254 | 5368 | 64.12 | 376 | 367 | 78.0 |
| B | 5 | 255 | 20829 | 280.71 | 370 | 360 | 72.9 |
| B | 10 | 246 | 15427 | 206.63 | 370 | 360 | 72.9 |
| B | 14 | 167 | 10148 | 134.23 | 370 | 360 | 72.9 |
| C | 14 | 238 | 57191 | 669.68 | 360 | 361 | 84.9 |
| C | 2 | 114 | 7196 | 80.54 | 360 | 361 | 84.9 |
| C | 2 | 16 | 2955 | 30.57 | 360 | 361 | 84.9 |
| D | 1 | 52 | 1015696 | 11776.66 | 356 | 344 | 86.2 |
| D | 8 | 195 | 433733 | 5026.71 | 356 | 344 | 86.2 |
| D | 2 | 250 | 40009 | 460.06 | 356 | 344 | 86.2 |
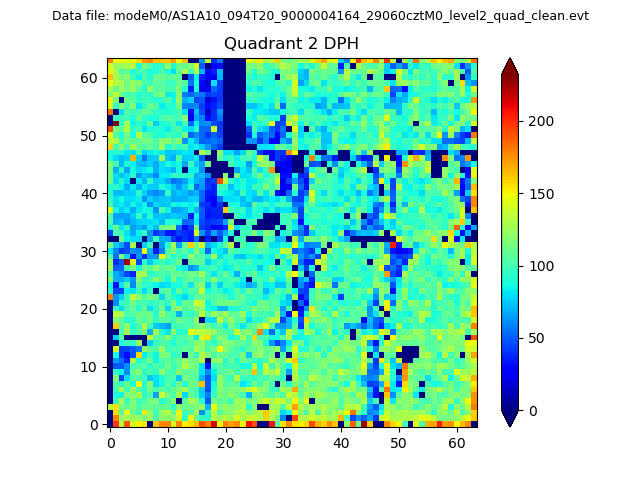
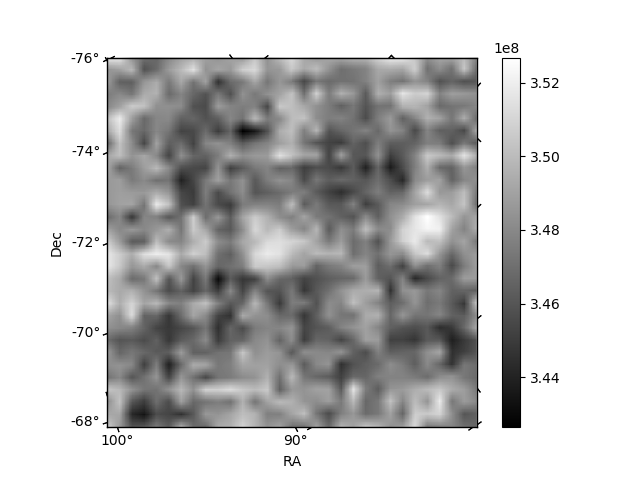
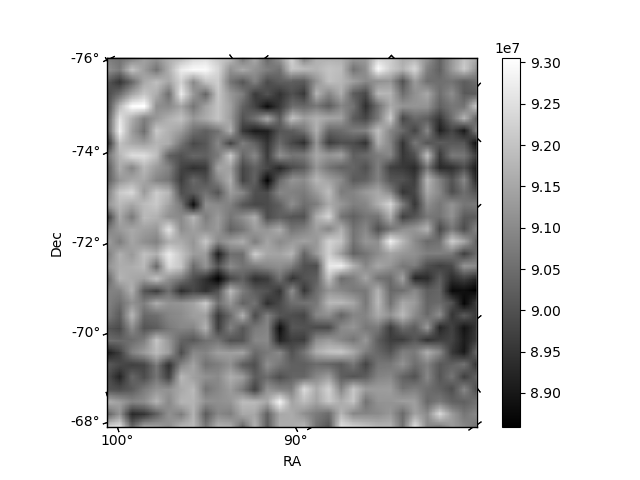
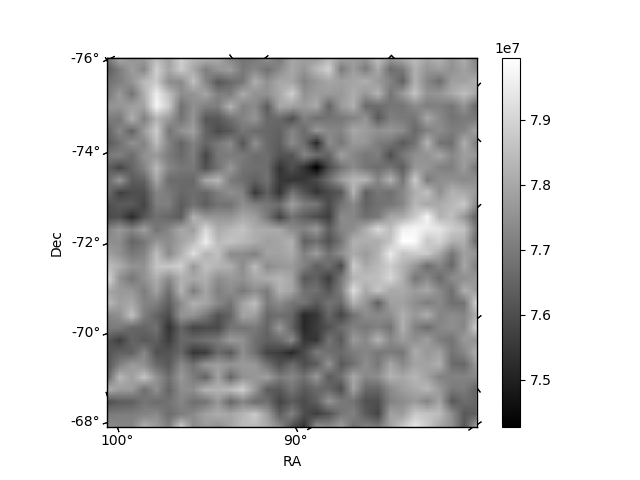
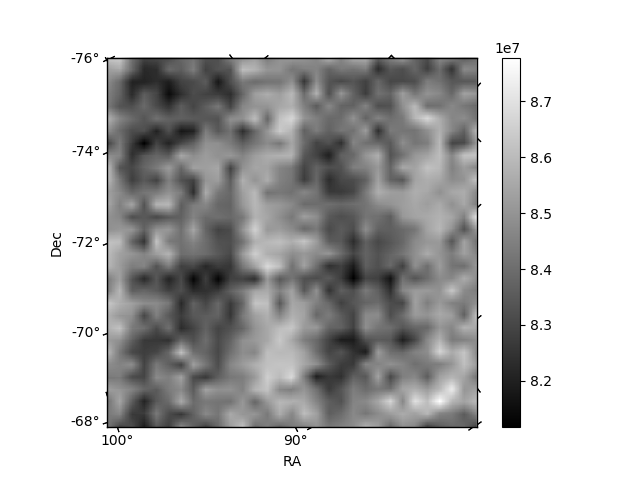
Histogram calculated using DETX and DETY for each event in the final _common_clean file
| Quadrant A | 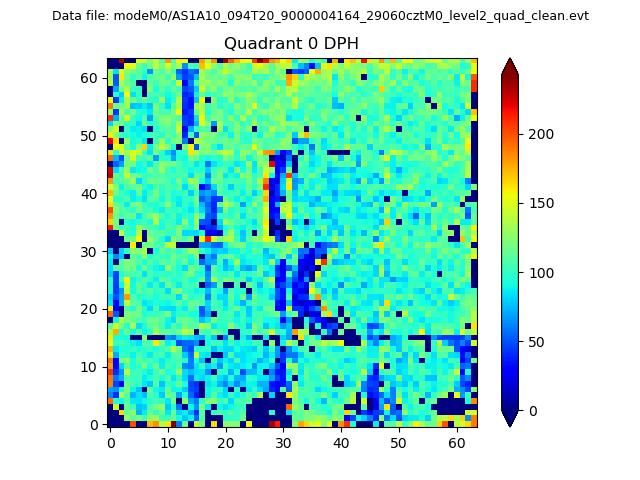 |
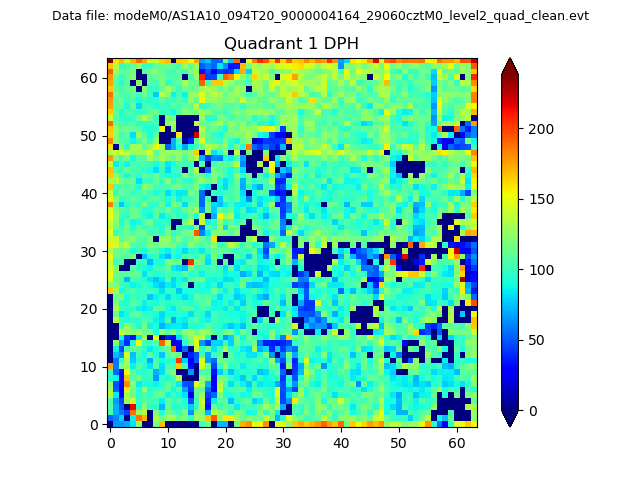 |
Quadrant B |
|---|---|---|---|
| Quadrant D | 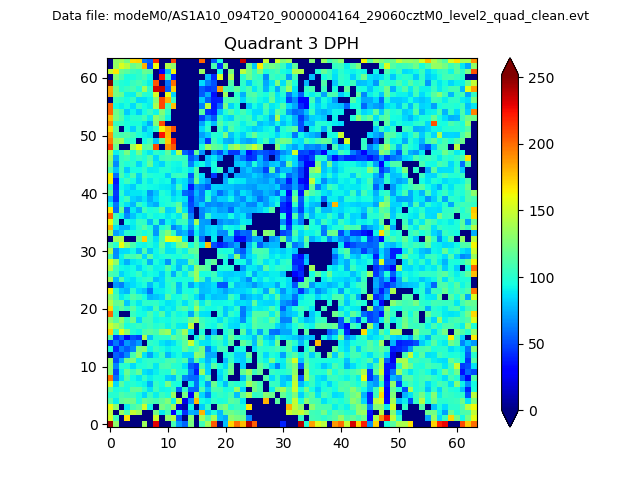 |
 |
Quadrant C |
| Plot type | Count rate plots | Images |
|---|---|---|
| Comparison with Poisson distribution Blue bars denote a histogram of data divided into 1 sec bins. Red curve is a Poisson curve with rate = median count rate of data. |
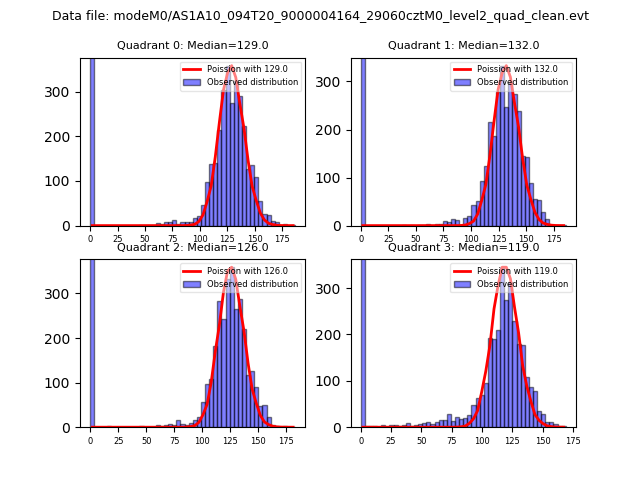 |
 |
| Quadrant-wise count rates Data is divided into 100 sec bins |
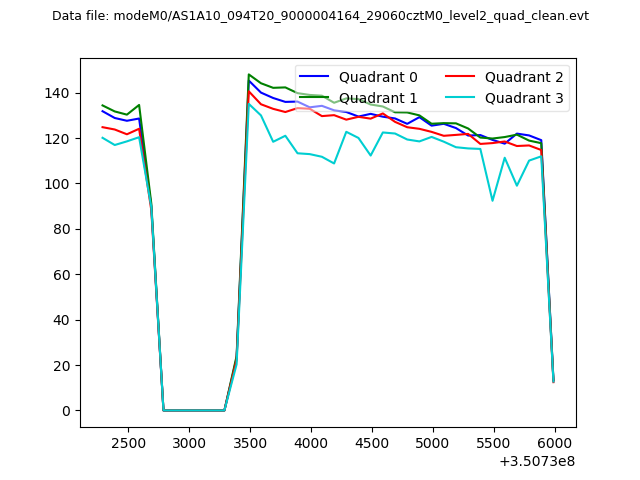 |
|
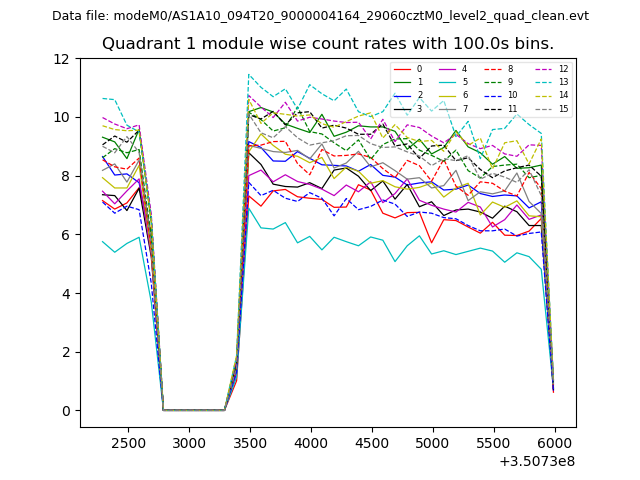
| Module-wise count rates for Quadrant A Data is divided into 100 sec bins |
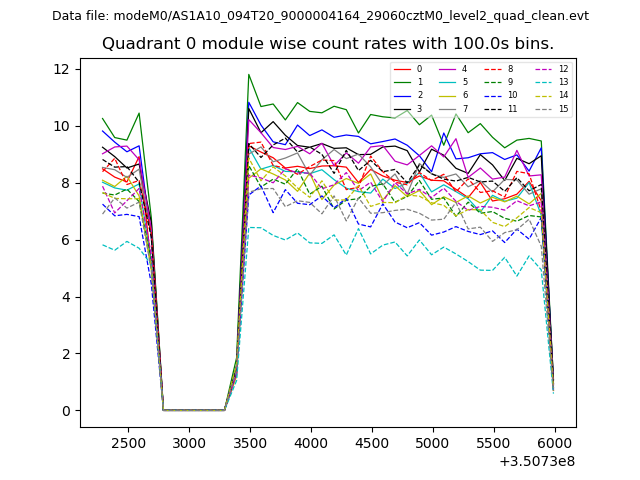 |
 |
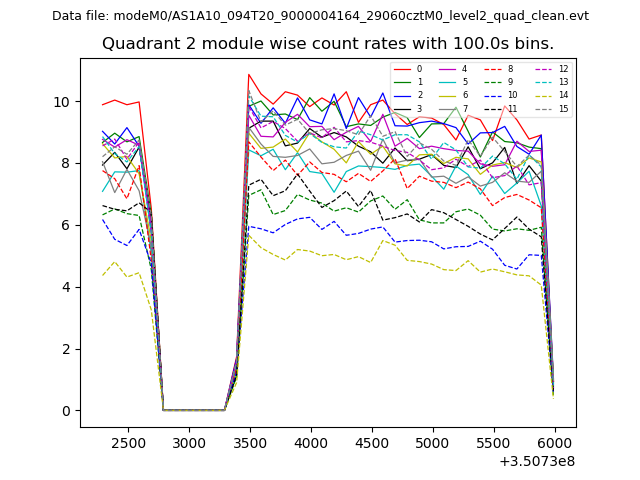
| Module-wise count rates for Quadrant B Data is divided into 100 sec bins |
 |
 |
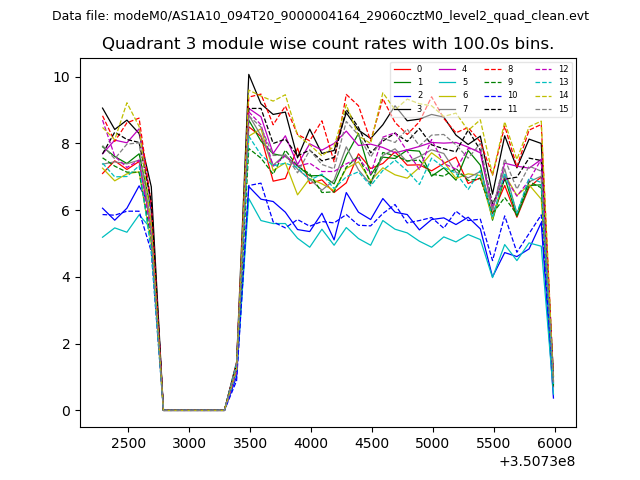
| Module-wise count rates for Quadrant C Data is divided into 100 sec bins |
 |
 |
| Module-wise count rates for Quadrant D Data is divided into 100 sec bins |
 |
 |
| Parameter | Plot |
|---|---|
| CZT HV Monitor | 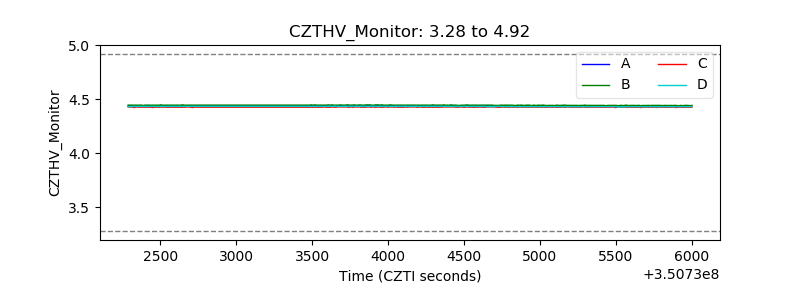 |
| D_VDD | 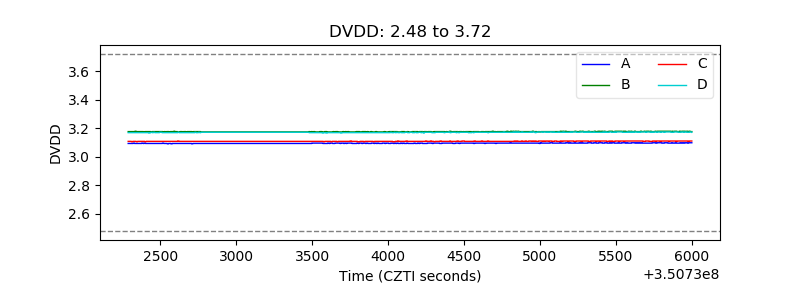 |
| Temperature 1 | 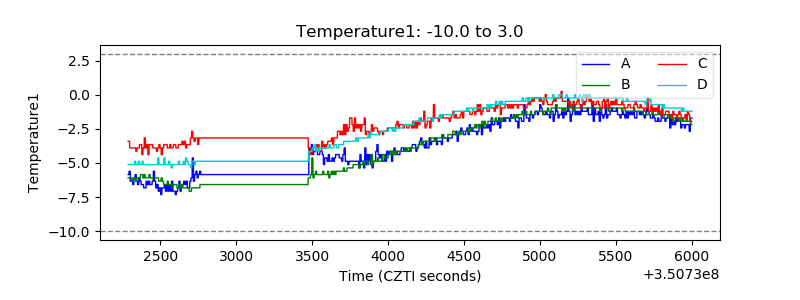 |
| Veto HV Monitor | 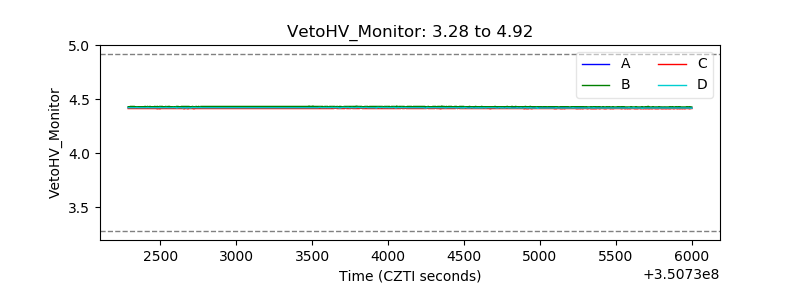 |
| Veto LLD | 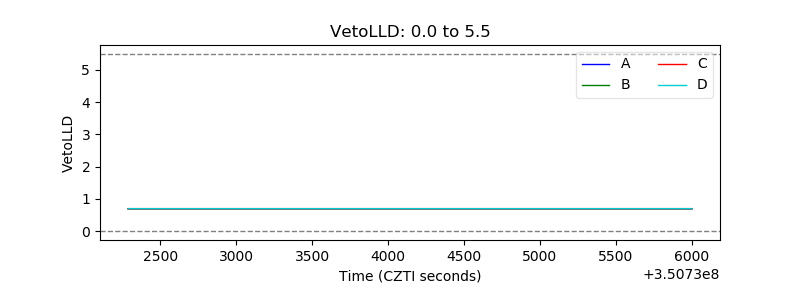 |
| Alpha Counter | 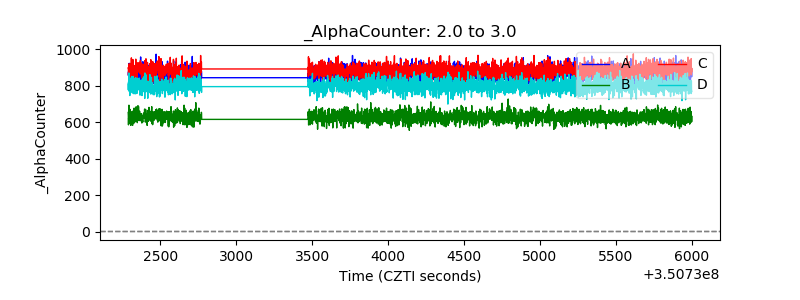 |
| _CPM_Rate | 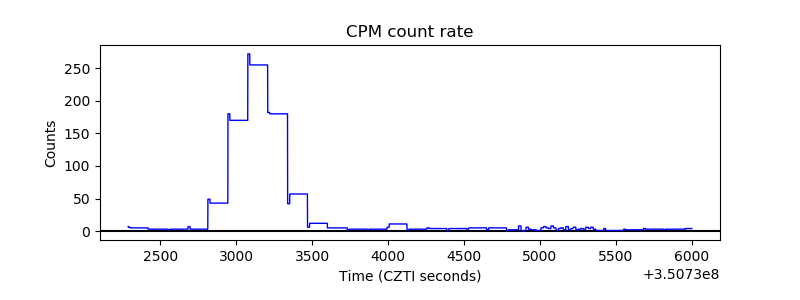 |
| CZT Counter | 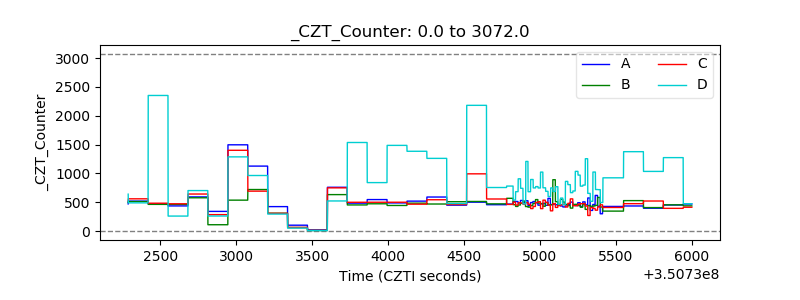 |
| +2.5 Volts monitor |  |
| +5 Volts monitor |  |
| _ROLL_ROT | 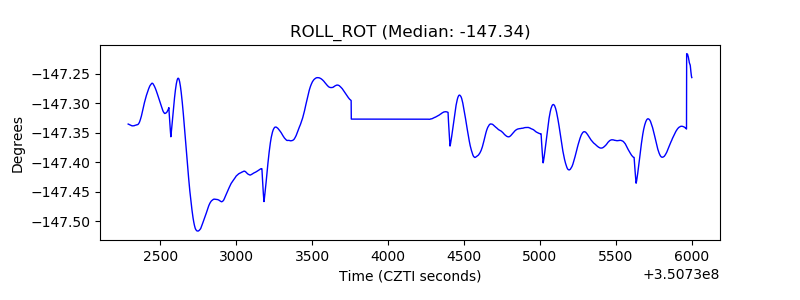 |
| _Roll_DEC |  |
| _Roll_RA | 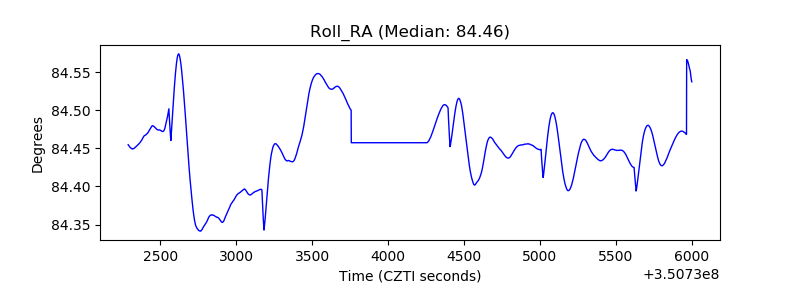 |
| Veto Counter | 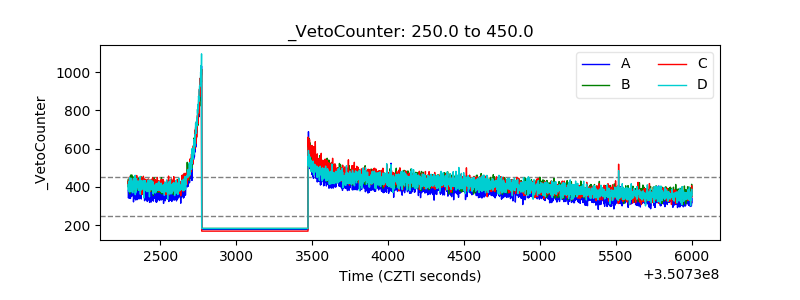 |