| Param | Original file | Final file |
|---|---|---|
| Filename | modeM0/AS1A10_094T22_9000004168cztM0_level2.fits | modeM0/AS1A10_094T22_9000004168cztM0_level2_quad_clean.evt |
| Size (bytes) | 34,799,040 | 8,686,080 |
| Size | 33.2 MB | 8.3 MB |
| Events in quadrant A | 223,540 | 7,120 |
| Events in quadrant B | 211,908 | 6,995 |
| Events in quadrant C | 211,286 | 6,456 |
| Events in quadrant D | 171,290 | 6,096 |
| Mode M0 | |||
|---|---|---|---|
| Quadrant | BADHDUFLAG | Total packets | Discarded packets |
| A | 0 | 7320 | 0 |
| B | 0 | 7331 | 0 |
| C | 0 | 7217 | 0 |
| D | 0 | 10299 | 0 |
| Mode SS | |||
|---|---|---|---|
| Quadrant | BADHDUFLAG | Total packets | Discarded packets |
| A | 0 | 70 | 0 |
| B | 0 | 66 | 0 |
| C | 0 | 76 | 0 |
| D | 0 | 64 | 0 |
| Mode M9 | |||
|---|---|---|---|
| Quadrant | BADHDUFLAG | Total packets | Discarded packets |
| A | 0 | 11 | 0 |
| B | 0 | 11 | 0 |
| C | 0 | 11 | 0 |
| D | 0 | 11 | 0 |
| Quadrant | Total seconds | Saturated seconds | Saturation percentage |
|---|---|---|---|
| A | 3380 | 52 | 1.538462% |
| B | 3358 | 57 | 1.697439% |
| C | 3372 | 69 | 2.046263% |
| D | 3129 | 213 | 6.807287% |
Noise dominated data is calculated using 1-second bins in cleaned event files. If a bin has >2000 counts, and if more than 50% of those come from <1% of pixels, then it is considered to be noise-dominated and hence unusable.
| Quadrant | # 1 sec bins | Bins with >0 counts | Bins with >2000 counts | High rate bins dominated by noise | Noise dominated (total time) | Noise dominated (detector-on time) | Marked lightcurve |
|---|---|---|---|---|---|---|---|
| A | 5979 | 3417 | 0 | 0 | 0.00% | 0.00% | 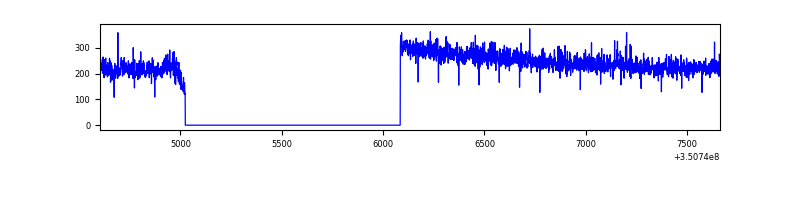 |
| B | 5979 | 3383 | 0 | 0 | 0.00% | 0.00% | 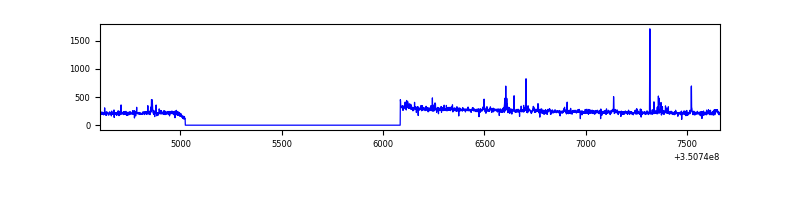 |
| C | 5979 | 3392 | 0 | 0 | 0.00% | 0.00% | 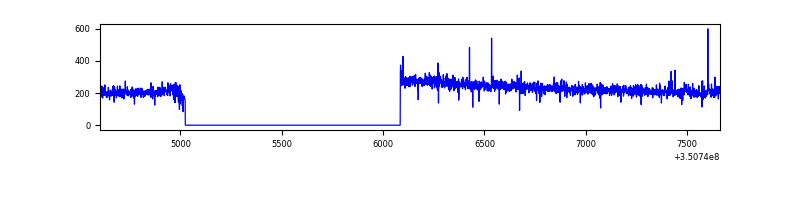 |
| D | 5979 | 3155 | 0 | 0 | 0.00% | 0.00% |  |
Top three noisy pixels from each quadrant. If the there are fewer than three noisy pixels in the level2.evt file, extra rows are filled as -1
| Pixel properties | Quadrant properties | ||||||
|---|---|---|---|---|---|---|---|
| Quadrant | DetID | PixID | Counts | Sigma | Mean | Median | Sigma |
| A | 0 | 29 | 200 | 9.09 | 58 | 55 | 15.9 |
| A | 9 | 19 | 198 | 8.97 | 58 | 55 | 15.9 |
| A | 7 | 110 | 188 | 8.34 | 58 | 55 | 15.9 |
| B | 2 | 9 | 209 | 11.89 | 56 | 54 | 13.0 |
| B | 2 | 8 | 151 | 7.44 | 56 | 54 | 13.0 |
| B | 2 | 245 | 150 | 7.36 | 56 | 54 | 13.0 |
| C | 3 | 202 | 156 | 6.55 | 55 | 52 | 15.9 |
| C | 12 | 241 | 150 | 6.18 | 55 | 52 | 15.9 |
| C | 9 | 242 | 149 | 6.11 | 55 | 52 | 15.9 |
| D | 14 | 238 | 132 | 6.01 | 48 | 44 | 14.6 |
| D | 1 | 31 | 132 | 6.01 | 48 | 44 | 14.6 |
| D | 6 | 38 | 130 | 5.87 | 48 | 44 | 14.6 |
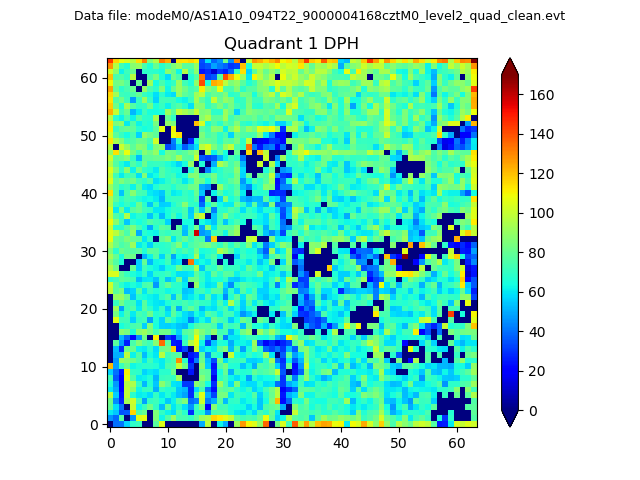
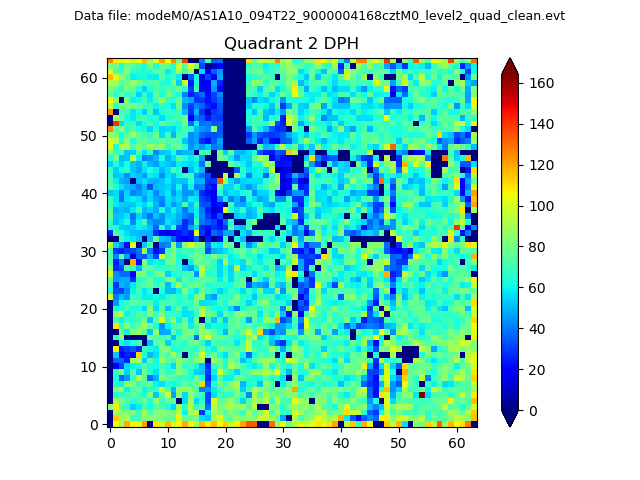
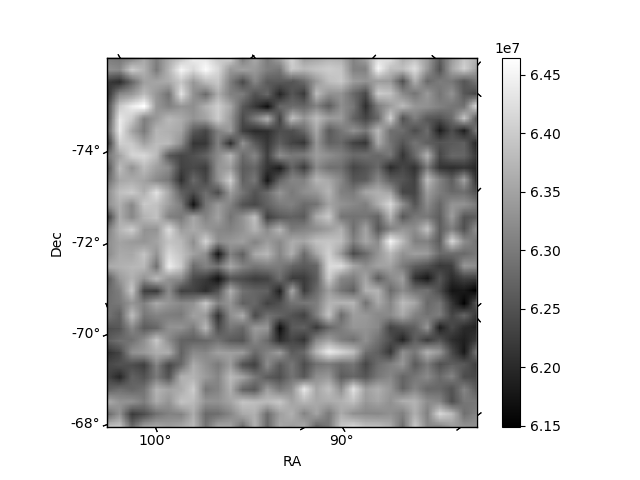
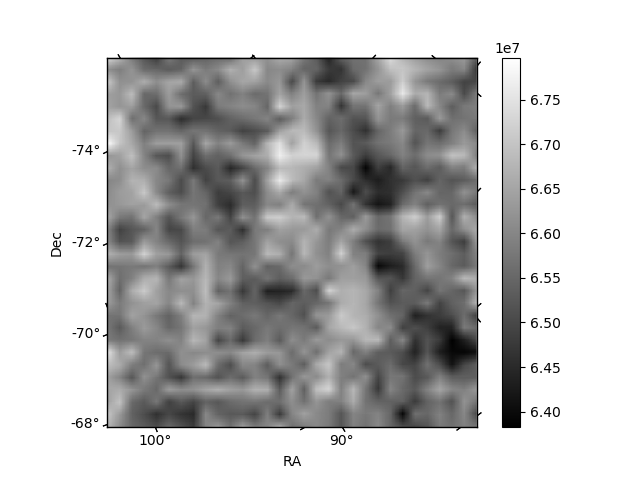
Histogram calculated using DETX and DETY for each event in the final _common_clean file
| Quadrant A | 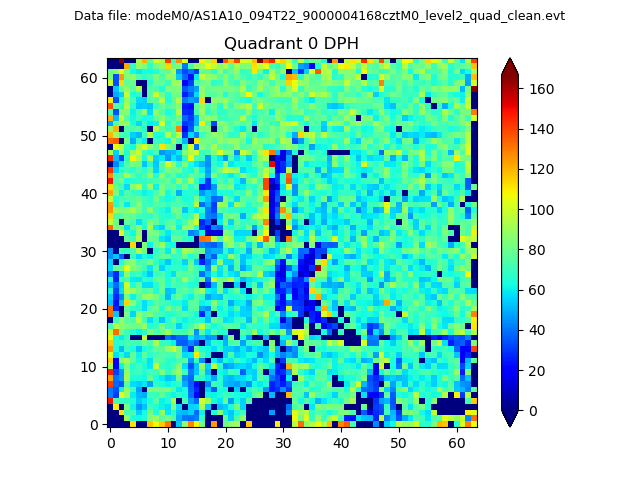 |
 |
Quadrant B |
|---|---|---|---|
| Quadrant D |  |
 |
Quadrant C |
| Plot type | Count rate plots | Images |
|---|---|---|
| Comparison with Poisson distribution Blue bars denote a histogram of data divided into 1 sec bins. Red curve is a Poisson curve with rate = median count rate of data. |
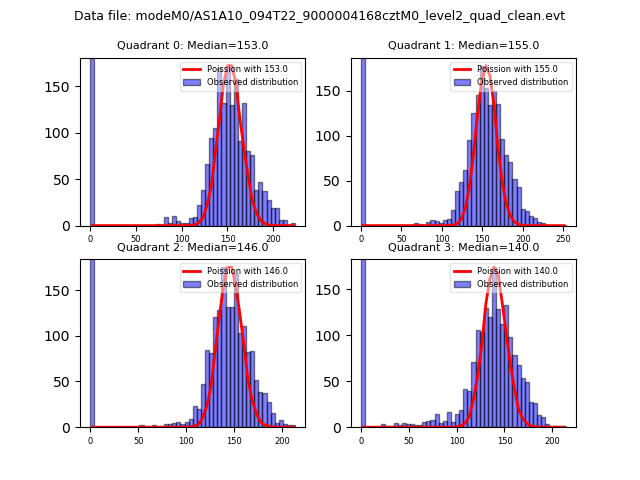 |
 |
| Quadrant-wise count rates Data is divided into 100 sec bins |
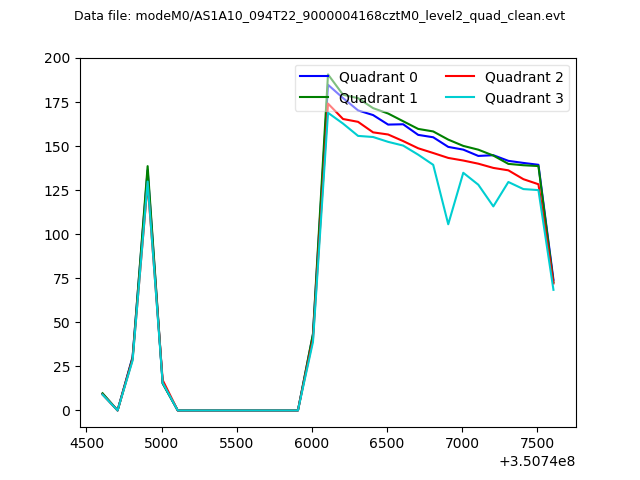 |
|
| Module-wise count rates for Quadrant A Data is divided into 100 sec bins |
 |
 |
| Module-wise count rates for Quadrant B Data is divided into 100 sec bins |
 |
 |
| Module-wise count rates for Quadrant C Data is divided into 100 sec bins |
 |
 |
| Module-wise count rates for Quadrant D Data is divided into 100 sec bins |
 |
 |
| Parameter | Plot |
|---|---|
| CZT HV Monitor |  |
| D_VDD | 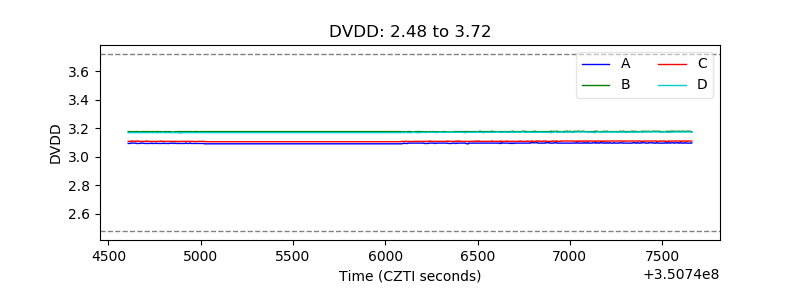 |
| Temperature 1 |  |
| Veto HV Monitor | 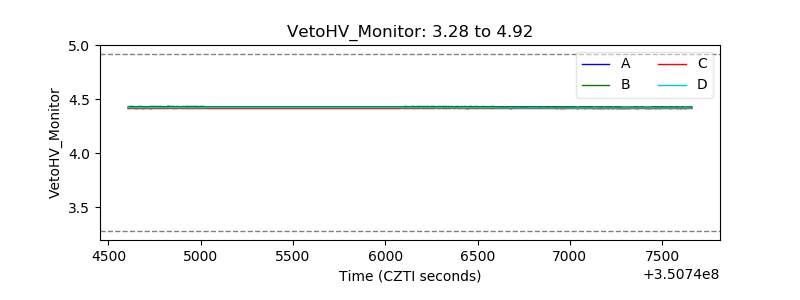 |
| Veto LLD |  |
| Alpha Counter |  |
| _CPM_Rate | 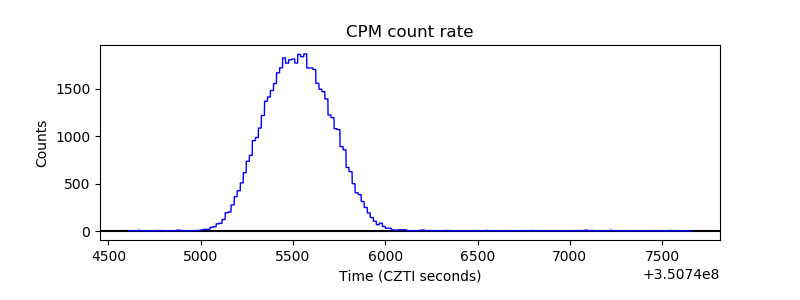 |
| CZT Counter | 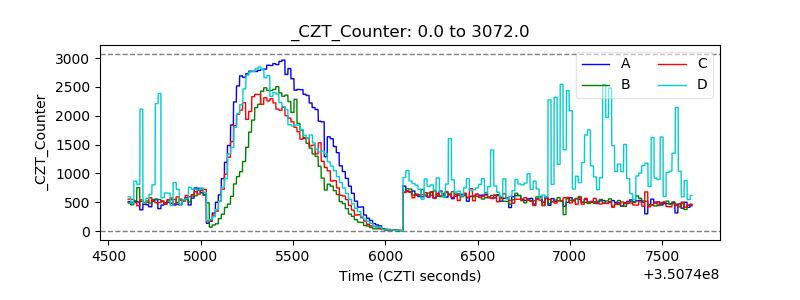 |
| +2.5 Volts monitor |  |
| +5 Volts monitor |  |
| _ROLL_ROT |  |
| _Roll_DEC |  |
| _Roll_RA |  |
| Veto Counter |  |