| Param | Original file | Final file |
|---|---|---|
| Filename | modeM0/AS1A10_094T22_9000004168_29061cztM0_level2.evt | modeM0/AS1A10_094T22_9000004168_29061cztM0_level2_quad_clean.evt |
| Size (bytes) | 179,326,080 | 38,664,000 |
| Size | 171.0 MB | 36.9 MB |
| Events in quadrant A | 1,095,055 | 265,377 |
| Events in quadrant B | 1,104,347 | 269,441 |
| Events in quadrant C | 1,077,866 | 252,150 |
| Events in quadrant D | 2,016,131 | 238,574 |
| Mode M0 | |||
|---|---|---|---|
| Quadrant | BADHDUFLAG | Total packets | Discarded packets |
| A | 0 | 4544 | 1 |
| B | 0 | 4555 | 1 |
| C | 0 | 4467 | 1 |
| D | 0 | 7448 | 1 |
| Mode SS | |||
|---|---|---|---|
| Quadrant | BADHDUFLAG | Total packets | Discarded packets |
| A | 0 | 40 | 0 |
| B | 0 | 40 | 0 |
| C | 0 | 40 | 0 |
| D | 0 | 40 | 0 |
| Mode M9 | |||
|---|---|---|---|
| Quadrant | BADHDUFLAG | Total packets | Discarded packets |
| A | 0 | 11 | 0 |
| B | 0 | 11 | 0 |
| C | 0 | 11 | 0 |
| D | 0 | 11 | 0 |
| Quadrant | Total seconds | Saturated seconds | Saturation percentage |
|---|---|---|---|
| A | 1999 | 52 | 2.601301% |
| B | 1999 | 55 | 2.751376% |
| C | 1999 | 64 | 3.201601% |
| D | 1999 | 210 | 10.505253% |
Noise dominated data is calculated using 1-second bins in cleaned event files. If a bin has >2000 counts, and if more than 50% of those come from <1% of pixels, then it is considered to be noise-dominated and hence unusable.
| Quadrant | # 1 sec bins | Bins with >0 counts | Bins with >2000 counts | High rate bins dominated by noise | Noise dominated (total time) | Noise dominated (detector-on time) | Marked lightcurve |
|---|---|---|---|---|---|---|---|
| A | 3058 | 1998 | 0 | 0 | 0.00% | 0.00% | 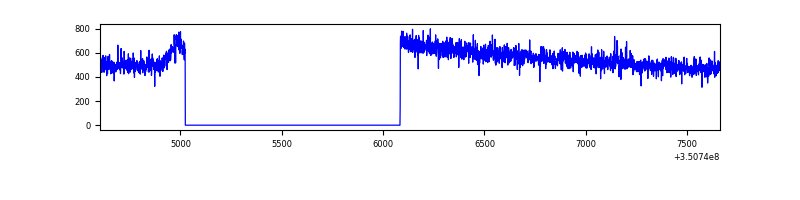 |
| B | 3058 | 1998 | 1 | 1 | 0.03% | 0.05% | 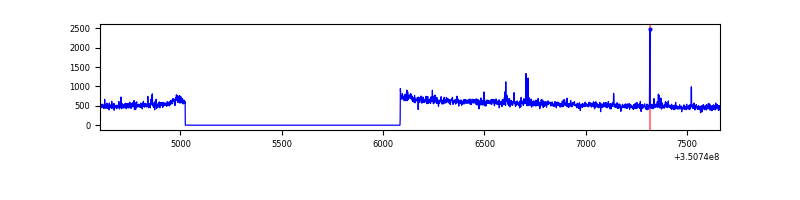 |
| C | 3058 | 1998 | 0 | 0 | 0.00% | 0.00% | 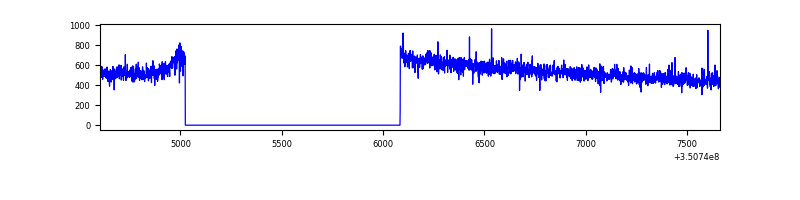 |
| D | 3058 | 1998 | 155 | 155 | 5.07% | 7.76% | 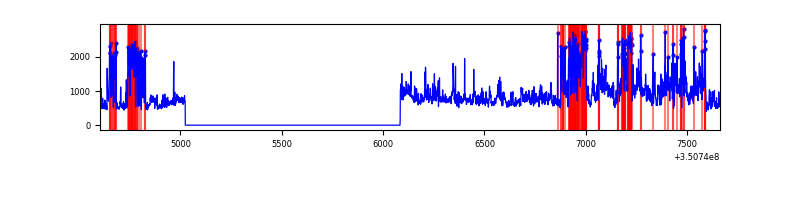 |
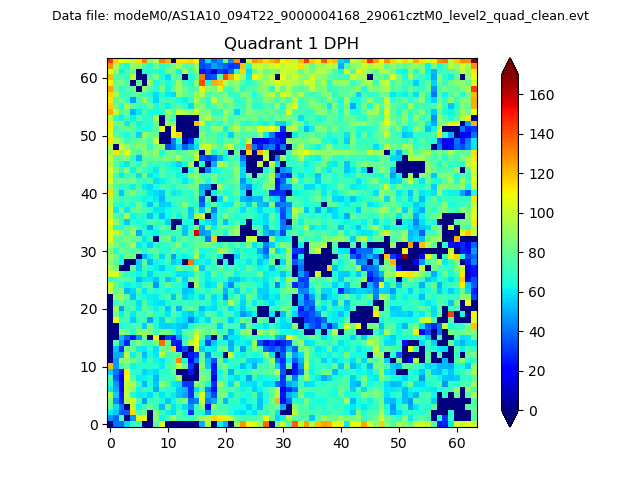
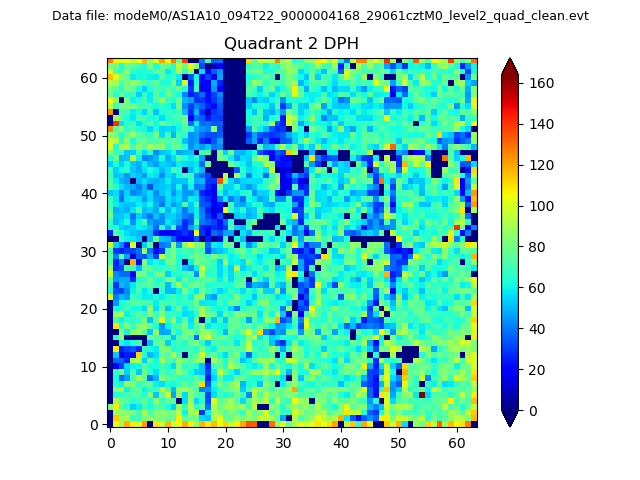
Top three noisy pixels from each quadrant. If the there are fewer than three noisy pixels in the level2.evt file, extra rows are filled as -1
| Pixel properties | Quadrant properties | ||||||
|---|---|---|---|---|---|---|---|
| Quadrant | DetID | PixID | Counts | Sigma | Mean | Median | Sigma |
| A | 13 | 254 | 3821 | 61.06 | 282 | 275 | 58.1 |
| A | 3 | 137 | 2653 | 40.95 | 282 | 275 | 58.1 |
| A | 6 | 16 | 2497 | 38.26 | 282 | 275 | 58.1 |
| B | 10 | 246 | 9663 | 175.62 | 276 | 270 | 53.5 |
| B | 3 | 209 | 6158 | 110.09 | 276 | 270 | 53.5 |
| B | 12 | 111 | 6048 | 108.03 | 276 | 270 | 53.5 |
| C | 14 | 238 | 42889 | 678.8 | 263 | 264 | 62.8 |
| C | 2 | 114 | 5035 | 75.98 | 263 | 264 | 62.8 |
| C | 13 | 61 | 1762 | 23.86 | 263 | 264 | 62.8 |
| D | 1 | 52 | 507021 | 7997.72 | 264 | 257 | 63.4 |
| D | 8 | 195 | 245338 | 3867.86 | 264 | 257 | 63.4 |
| D | 12 | 233 | 238751 | 3763.9 | 264 | 257 | 63.4 |
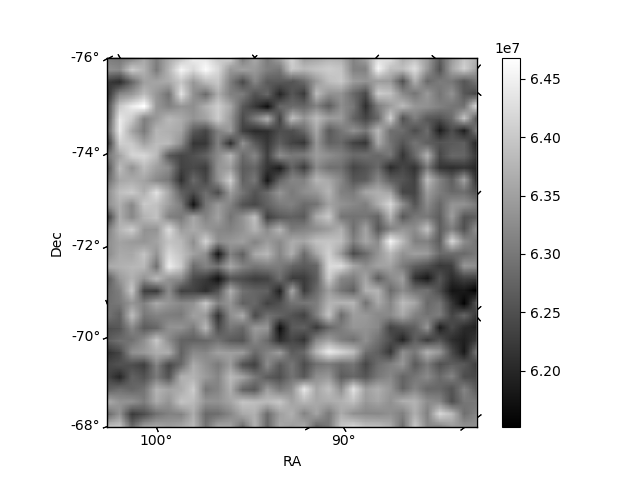
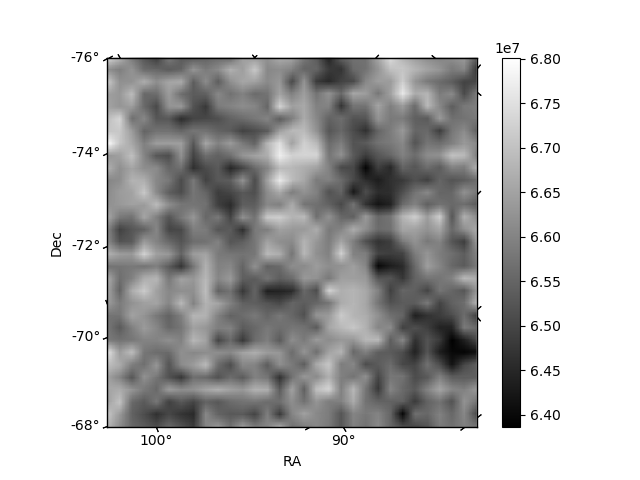
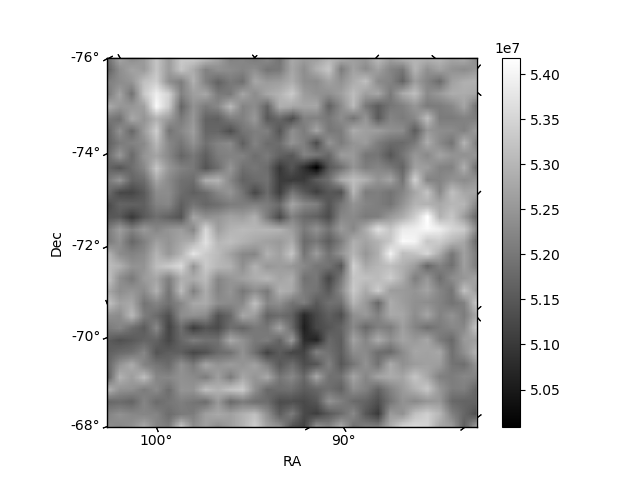
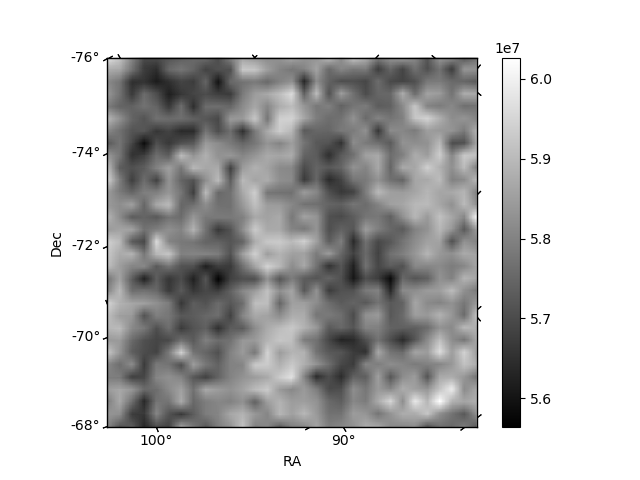
Histogram calculated using DETX and DETY for each event in the final _common_clean file
| Quadrant A | 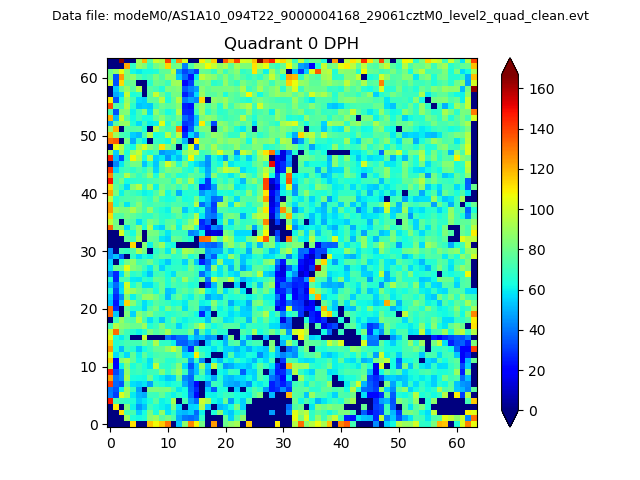 |
 |
Quadrant B |
|---|---|---|---|
| Quadrant D | 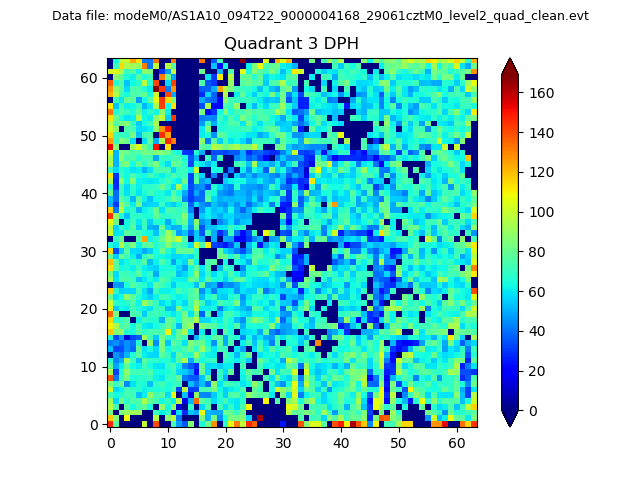 |
 |
Quadrant C |
| Plot type | Count rate plots | Images |
|---|---|---|
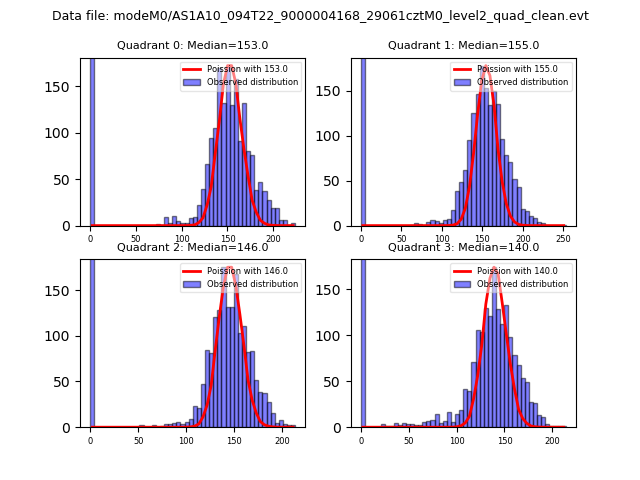
| Comparison with Poisson distribution Blue bars denote a histogram of data divided into 1 sec bins. Red curve is a Poisson curve with rate = median count rate of data. |
 |
 |
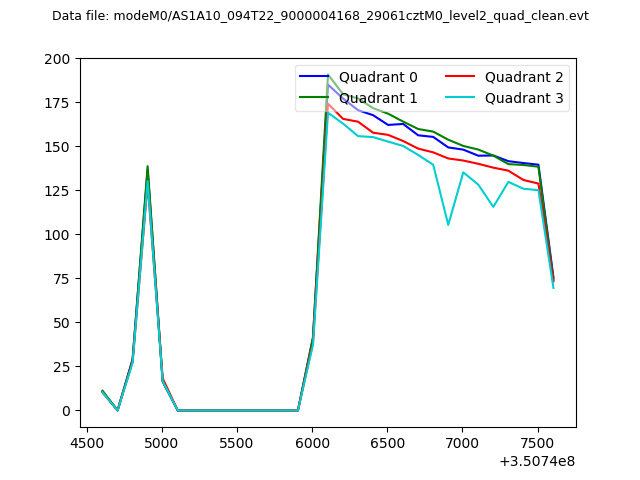
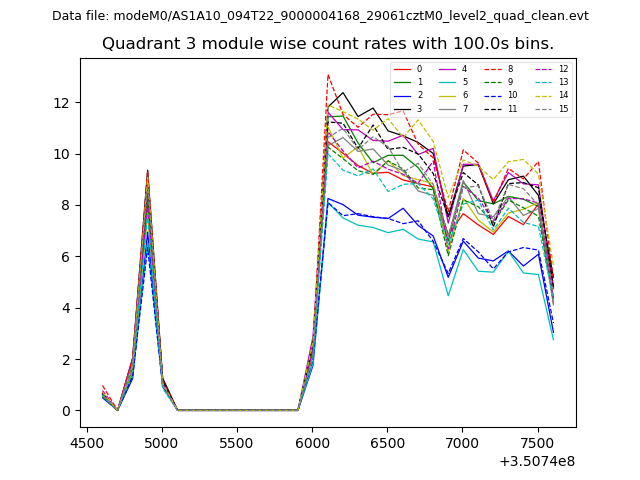
| Quadrant-wise count rates Data is divided into 100 sec bins |
 |
|
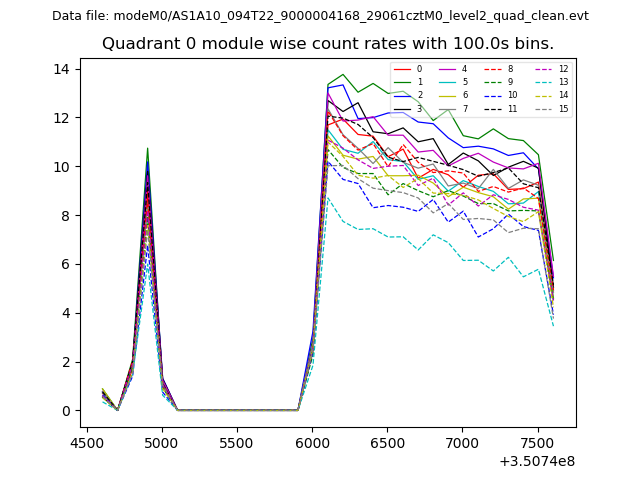
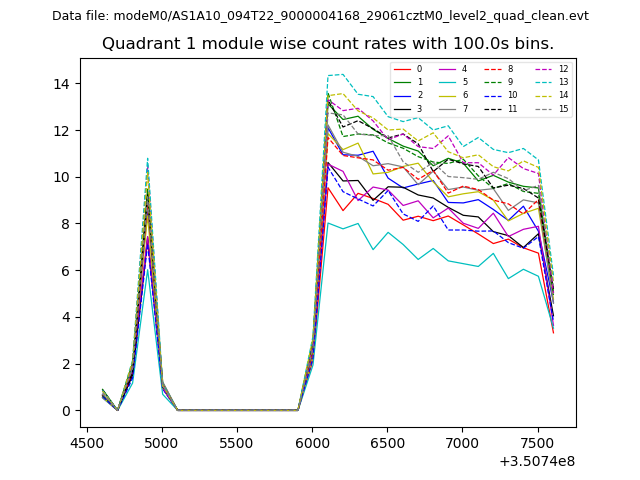
| Module-wise count rates for Quadrant A Data is divided into 100 sec bins |
 |
 |
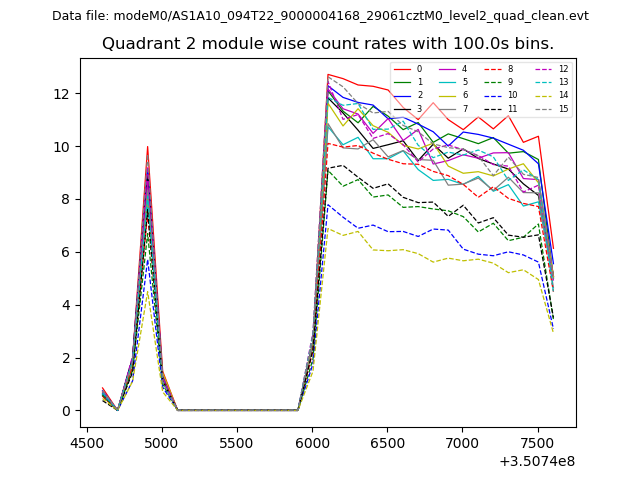
| Module-wise count rates for Quadrant B Data is divided into 100 sec bins |
 |
 |
| Module-wise count rates for Quadrant C Data is divided into 100 sec bins |
 |
 |
| Module-wise count rates for Quadrant D Data is divided into 100 sec bins |
 |
 |
| Parameter | Plot |
|---|---|
| CZT HV Monitor | 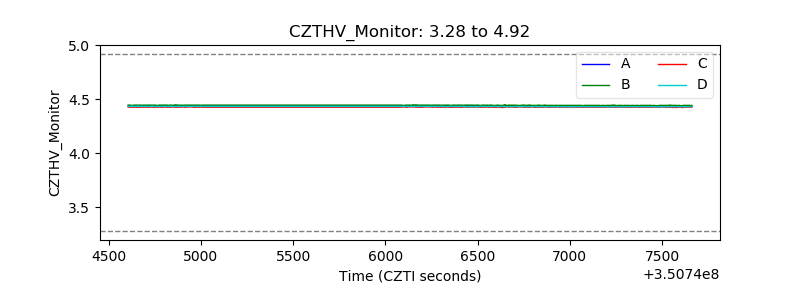 |
| D_VDD | 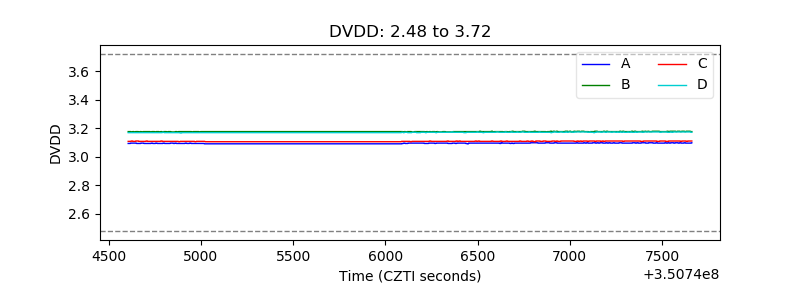 |
| Temperature 1 | 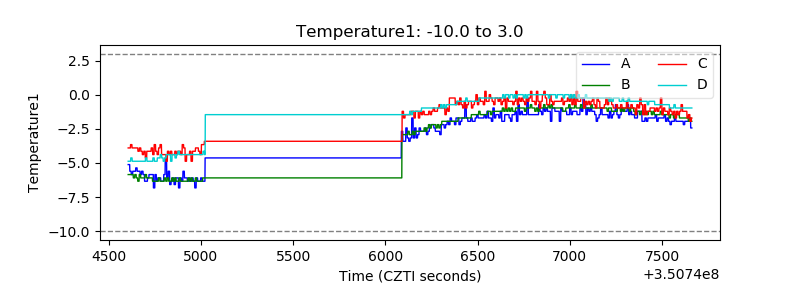 |
| Veto HV Monitor | 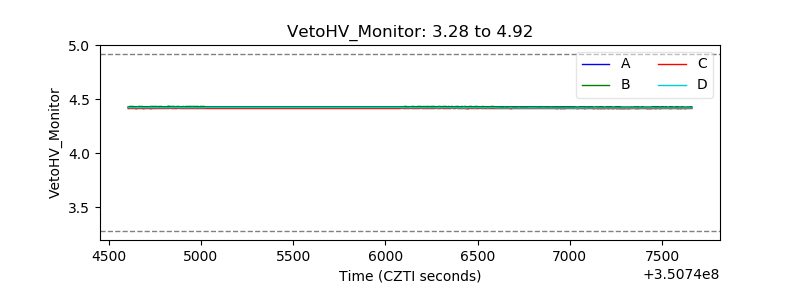 |
| Veto LLD | 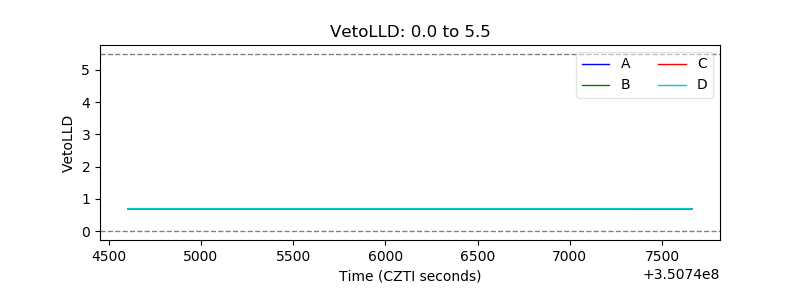 |
| Alpha Counter | 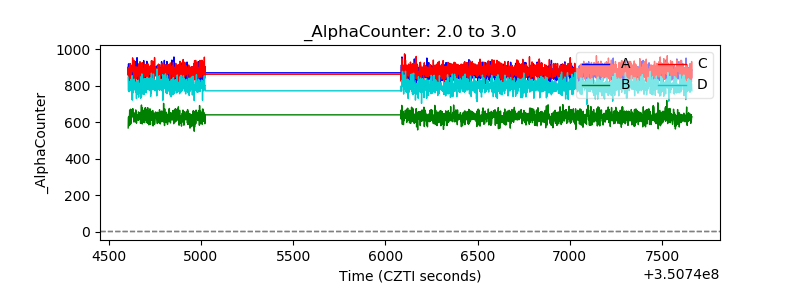 |
| _CPM_Rate | 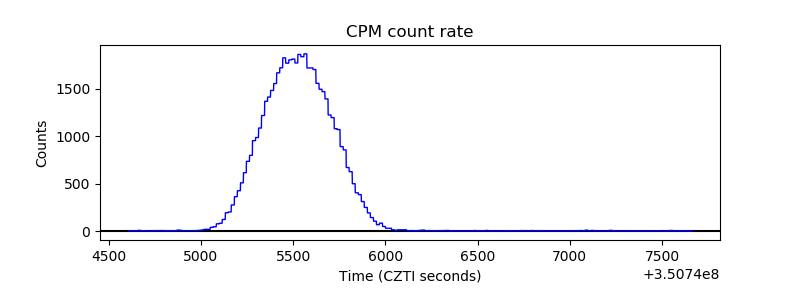 |
| CZT Counter | 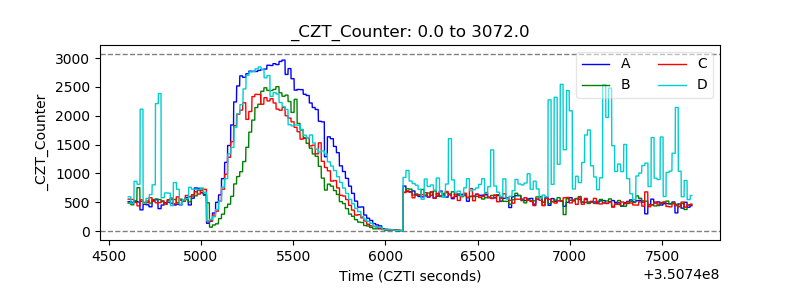 |
| +2.5 Volts monitor |  |
| +5 Volts monitor |  |
| _ROLL_ROT | 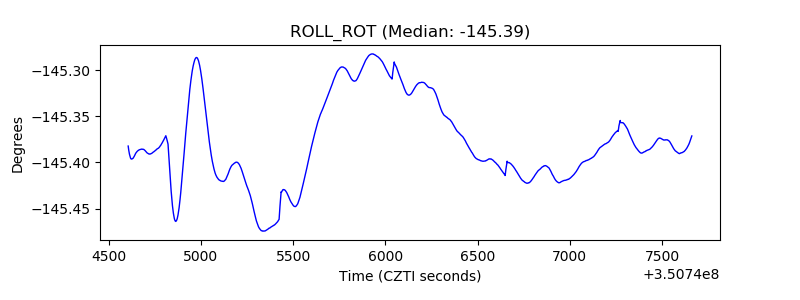 |
| _Roll_DEC | 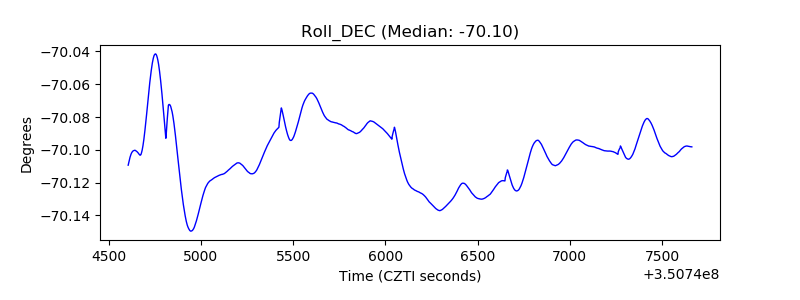 |
| _Roll_RA | 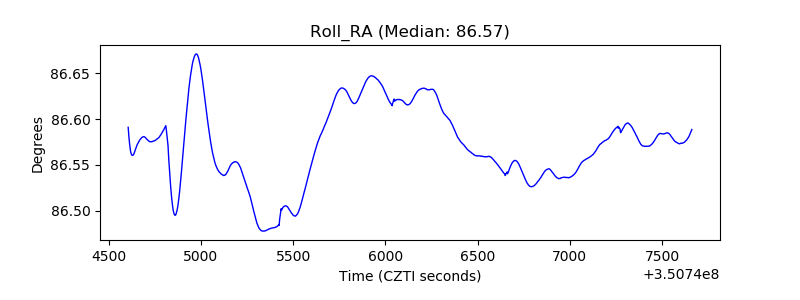 |
| Veto Counter | 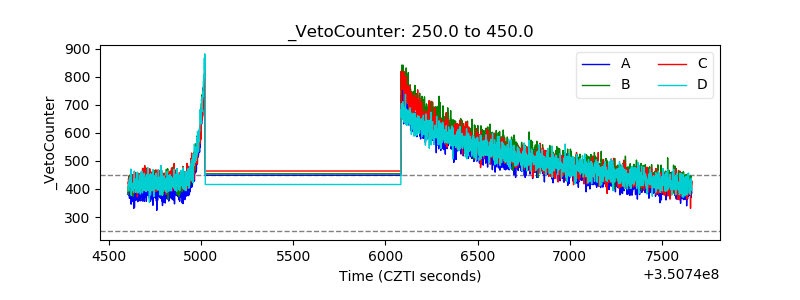 |