| Param | Original file | Final file |
|---|---|---|
| Filename | modeM0/AS1A10_097T04_9000004170cztM0_level2.fits | modeM0/AS1A10_097T04_9000004170cztM0_level2_quad_clean.evt |
| Size (bytes) | 635,797,440 | 524,387,520 |
| Size | 606.3 MB | 500.1 MB |
| Events in quadrant A | 3,951,550 | 3,027,327 |
| Events in quadrant B | 3,814,932 | 3,060,463 |
| Events in quadrant C | 3,837,082 | 2,871,865 |
| Events in quadrant D | 3,296,976 | 2,566,019 |
| Mode SS | |||
|---|---|---|---|
| Quadrant | BADHDUFLAG | Total packets | Discarded packets |
| A | 0 | 1288 | 0 |
| B | 0 | 1288 | 0 |
| C | 0 | 1288 | 0 |
| D | 0 | 1288 | 0 |
| Mode M9 | |||
|---|---|---|---|
| Quadrant | BADHDUFLAG | Total packets | Discarded packets |
| A | 0 | 98 | 0 |
| B | 0 | 97 | 0 |
| C | 0 | 98 | 0 |
| D | 0 | 98 | 0 |
| Mode M0 | |||
|---|---|---|---|
| Quadrant | BADHDUFLAG | Total packets | Discarded packets |
| A | 0 | 137054 | 0 |
| B | 0 | 135161 | 0 |
| C | 0 | 134779 | 0 |
| D | 0 | 174988 | 0 |
| Quadrant | Total seconds | Saturated seconds | Saturation percentage |
|---|---|---|---|
| A | 63491 | 1325 | 2.086910% |
| B | 63495 | 1221 | 1.922986% |
| C | 63483 | 1400 | 2.205315% |
| D | 63490 | 2512 | 3.956529% |
Noise dominated data is calculated using 1-second bins in cleaned event files. If a bin has >2000 counts, and if more than 50% of those come from <1% of pixels, then it is considered to be noise-dominated and hence unusable.
| Quadrant | # 1 sec bins | Bins with >0 counts | Bins with >2000 counts | High rate bins dominated by noise | Noise dominated (total time) | Noise dominated (detector-on time) | Marked lightcurve |
|---|---|---|---|---|---|---|---|
| A | 72108 | 63479 | 0 | 0 | 0.00% | 0.00% | 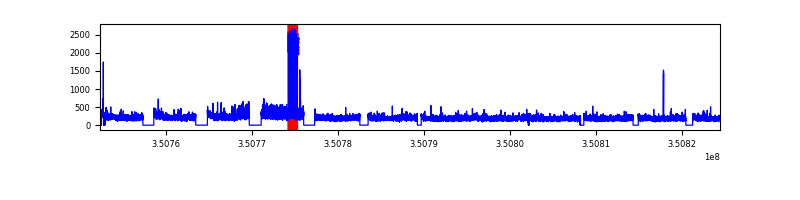 |
| B | 72108 | 63482 | 0 | 0 | 0.00% | 0.00% | 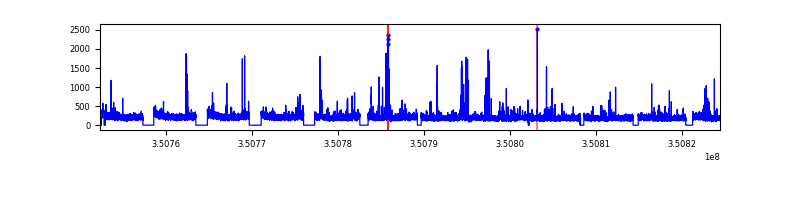 |
| C | 72108 | 63469 | 0 | 0 | 0.00% | 0.00% |  |
| D | 72108 | 63442 | 0 | 0 | 0.00% | 0.00% |  |
Top three noisy pixels from each quadrant. If the there are fewer than three noisy pixels in the level2.evt file, extra rows are filled as -1
| Pixel properties | Quadrant properties | ||||||
|---|---|---|---|---|---|---|---|
| Quadrant | DetID | PixID | Counts | Sigma | Mean | Median | Sigma |
| A | 0 | 29 | 3781 | 11.01 | 1029 | 966 | 255.7 |
| A | 7 | 110 | 3163 | 8.59 | 1029 | 966 | 255.7 |
| A | 0 | 30 | 3086 | 8.29 | 1029 | 966 | 255.7 |
| B | 2 | 9 | 2986 | 10.22 | 1009 | 963 | 197.9 |
| B | 2 | 8 | 2526 | 7.9 | 1009 | 963 | 197.9 |
| B | 5 | 128 | 2517 | 7.85 | 1009 | 963 | 197.9 |
| C | 1 | 81 | 2992 | 7.96 | 1013 | 951 | 256.6 |
| C | 1 | 80 | 2897 | 7.58 | 1013 | 951 | 256.6 |
| C | 12 | 241 | 2666 | 6.68 | 1013 | 951 | 256.6 |
| D | 3 | 14 | 2424 | 6.24 | 940 | 854 | 251.7 |
| D | 15 | 46 | 2402 | 6.15 | 940 | 854 | 251.7 |
| D | 6 | 67 | 2289 | 5.7 | 940 | 854 | 251.7 |
Histogram calculated using DETX and DETY for each event in the final _common_clean file
| Quadrant A | 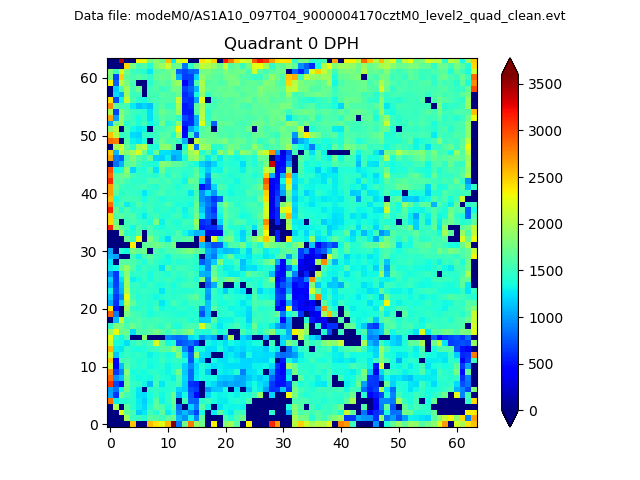 |
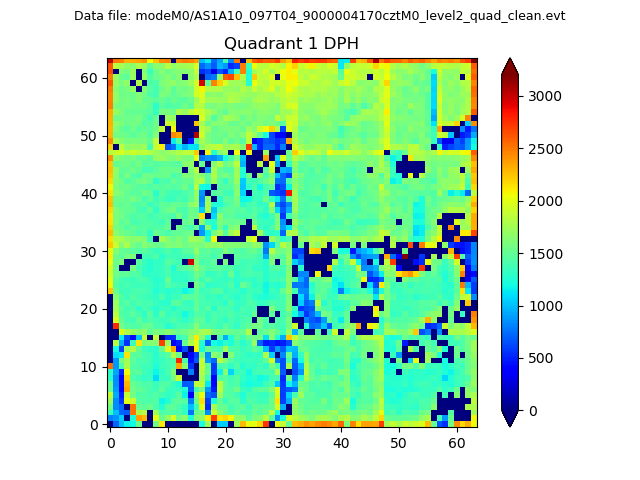 |
Quadrant B |
|---|---|---|---|
| Quadrant D |  |
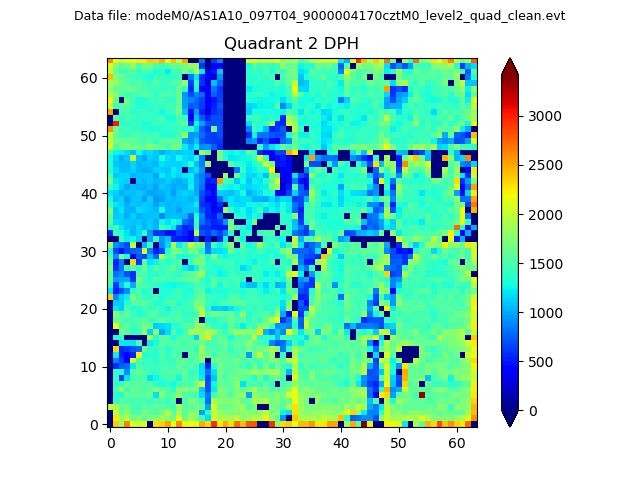 |
Quadrant C |
| Plot type | Count rate plots | Images |
|---|---|---|
| Comparison with Poisson distribution Blue bars denote a histogram of data divided into 1 sec bins. Red curve is a Poisson curve with rate = median count rate of data. |
 |
 |
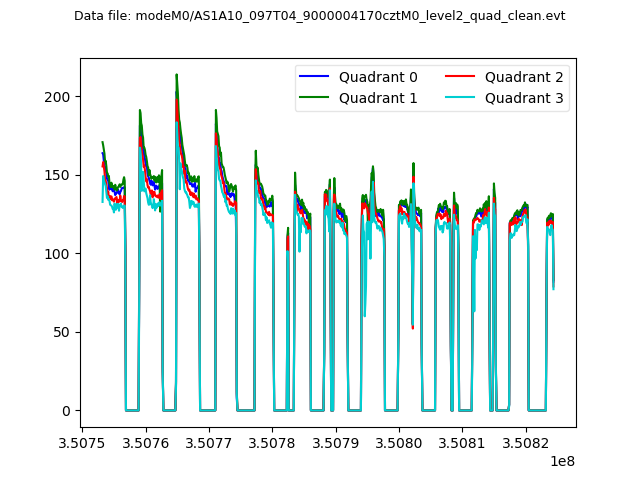
| Quadrant-wise count rates Data is divided into 100 sec bins |
 |
|
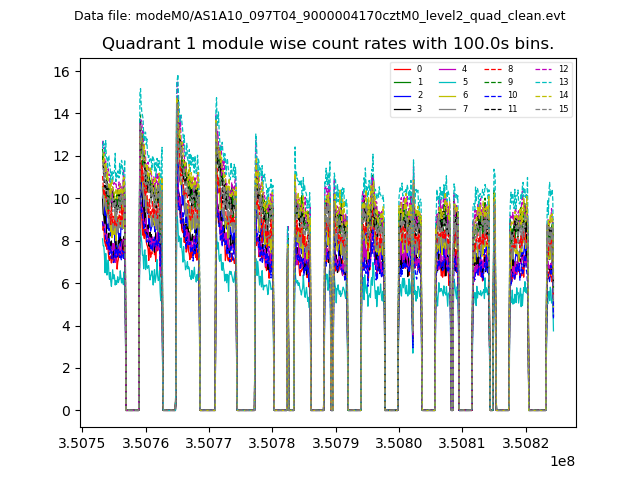
| Module-wise count rates for Quadrant A Data is divided into 100 sec bins |
 |
 |
| Module-wise count rates for Quadrant B Data is divided into 100 sec bins |
 |
 |
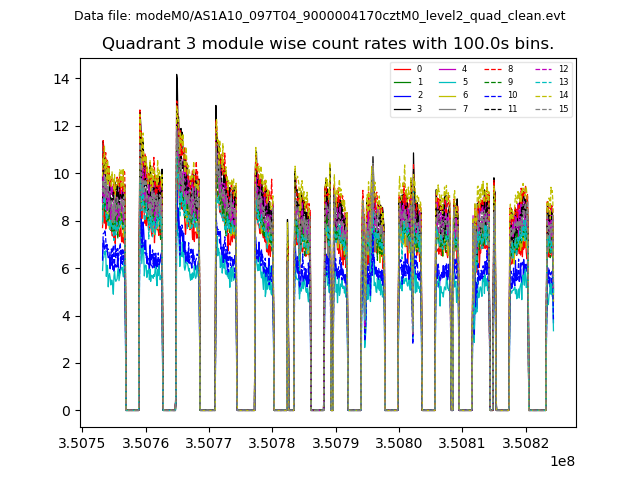
| Module-wise count rates for Quadrant C Data is divided into 100 sec bins |
 |
 |
| Module-wise count rates for Quadrant D Data is divided into 100 sec bins |
 |
 |
| Parameter | Plot |
|---|---|
| CZT HV Monitor |  |
| D_VDD |  |
| Temperature 1 | 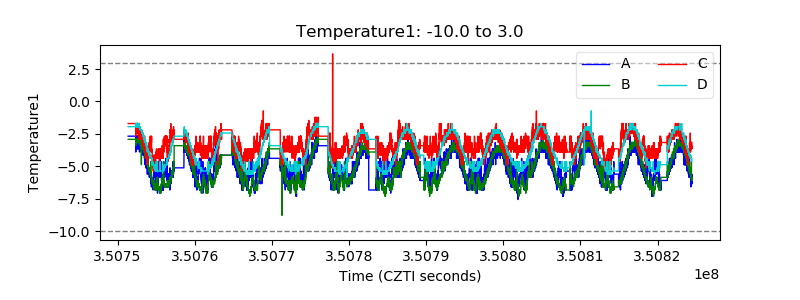 |
| Veto HV Monitor |  |
| Veto LLD |  |
| Alpha Counter |  |
| _CPM_Rate | 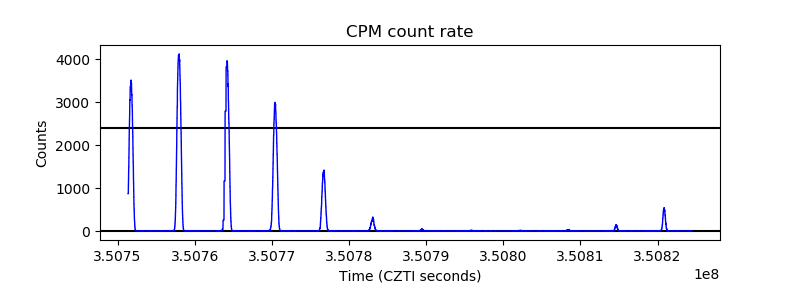 |
| CZT Counter |  |
| +2.5 Volts monitor | 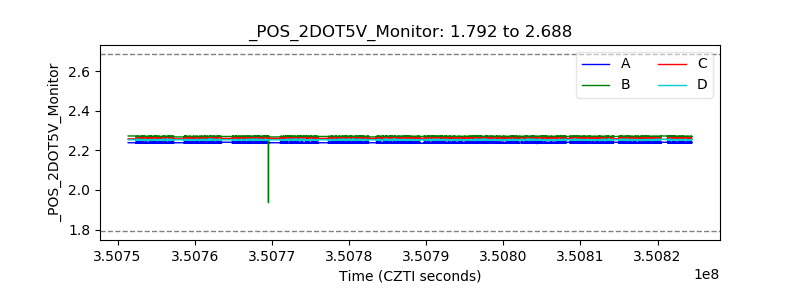 |
| +5 Volts monitor |  |
| _ROLL_ROT |  |
| _Roll_DEC | 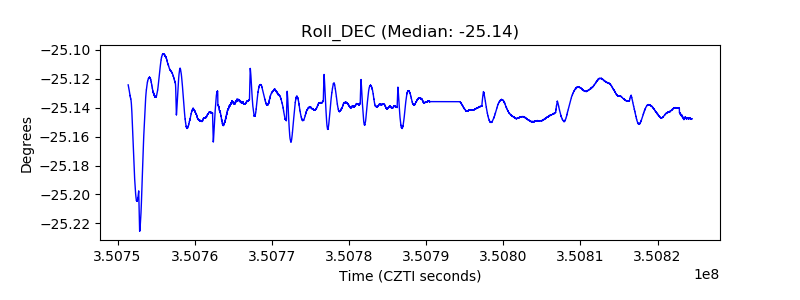 |
| _Roll_RA | 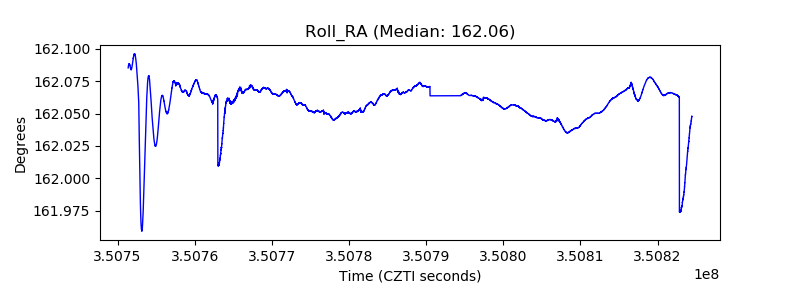 |
| Veto Counter | 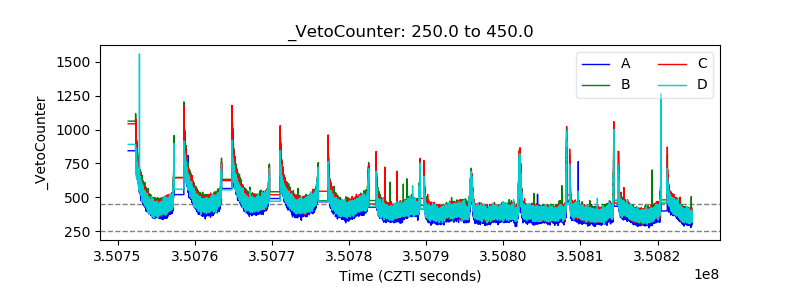 |