| Param | Original file | Final file |
|---|---|---|
| Filename | modeM0/AS1A10_097T04_9000004170_29065cztM0_level2.evt | modeM0/AS1A10_097T04_9000004170_29065cztM0_level2_quad_clean.evt |
| Size (bytes) | 558,809,280 | 120,769,920 |
| Size | 532.9 MB | 115.2 MB |
| Events in quadrant A | 3,701,839 | 817,176 |
| Events in quadrant B | 3,854,512 | 843,705 |
| Events in quadrant C | 3,729,962 | 784,275 |
| Events in quadrant D | 5,173,020 | 735,433 |
| Mode SS | |||
|---|---|---|---|
| Quadrant | BADHDUFLAG | Total packets | Discarded packets |
| A | 0 | 140 | 0 |
| B | 0 | 140 | 0 |
| C | 0 | 140 | 0 |
| D | 0 | 140 | 0 |
| Mode M9 | |||
|---|---|---|---|
| Quadrant | BADHDUFLAG | Total packets | Discarded packets |
| A | 0 | 26 | 0 |
| B | 0 | 26 | 0 |
| C | 0 | 26 | 0 |
| D | 0 | 26 | 0 |
| Mode M0 | |||
|---|---|---|---|
| Quadrant | BADHDUFLAG | Total packets | Discarded packets |
| A | 0 | 15295 | 2 |
| B | 0 | 15781 | 2 |
| C | 0 | 15382 | 2 |
| D | 0 | 20006 | 2 |
| Quadrant | Total seconds | Saturated seconds | Saturation percentage |
|---|---|---|---|
| A | 6853 | 117 | 1.707281% |
| B | 6854 | 193 | 2.815874% |
| C | 6854 | 161 | 2.348993% |
| D | 6854 | 189 | 2.757514% |
Noise dominated data is calculated using 1-second bins in cleaned event files. If a bin has >2000 counts, and if more than 50% of those come from <1% of pixels, then it is considered to be noise-dominated and hence unusable.
| Quadrant | # 1 sec bins | Bins with >0 counts | Bins with >2000 counts | High rate bins dominated by noise | Noise dominated (total time) | Noise dominated (detector-on time) | Marked lightcurve |
|---|---|---|---|---|---|---|---|
| A | 9472 | 6852 | 0 | 0 | 0.00% | 0.00% | 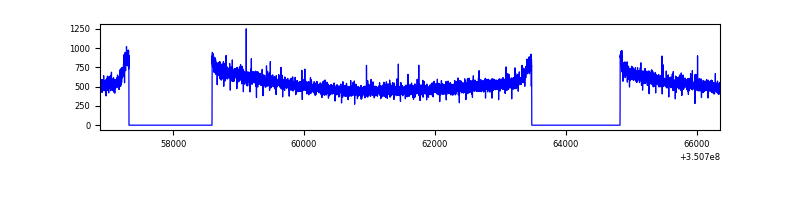 |
| B | 9473 | 6853 | 38 | 38 | 0.40% | 0.55% | 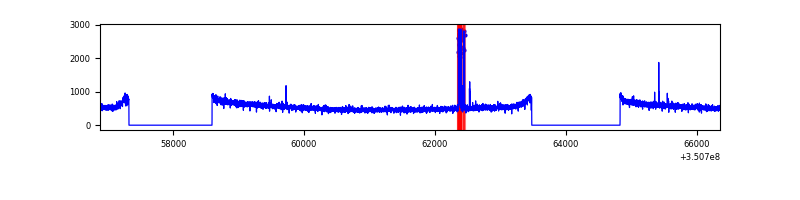 |
| C | 9473 | 6853 | 0 | 0 | 0.00% | 0.00% | 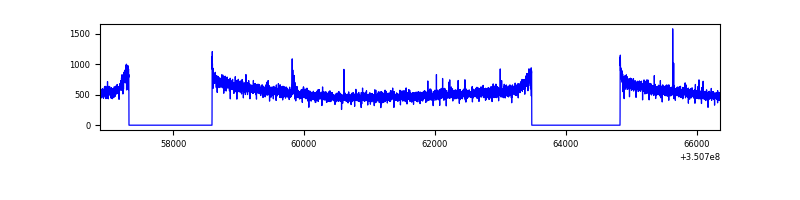 |
| D | 9473 | 6853 | 154 | 154 | 1.63% | 2.25% | 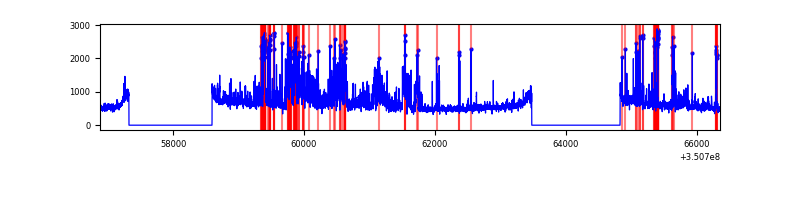 |
Top three noisy pixels from each quadrant. If the there are fewer than three noisy pixels in the level2.evt file, extra rows are filled as -1
| Pixel properties | Quadrant properties | ||||||
|---|---|---|---|---|---|---|---|
| Quadrant | DetID | PixID | Counts | Sigma | Mean | Median | Sigma |
| A | 13 | 254 | 11782 | 57.39 | 956 | 941 | 188.9 |
| A | 6 | 16 | 9643 | 46.06 | 956 | 941 | 188.9 |
| A | 3 | 137 | 9001 | 42.66 | 956 | 941 | 188.9 |
| B | 4 | 80 | 109591 | 612.64 | 955 | 934 | 177.4 |
| B | 12 | 111 | 21691 | 117.03 | 955 | 934 | 177.4 |
| B | 11 | 111 | 19531 | 104.85 | 955 | 934 | 177.4 |
| C | 14 | 238 | 149282 | 701.93 | 910 | 917 | 211.4 |
| C | 2 | 114 | 16167 | 72.15 | 910 | 917 | 211.4 |
| C | 2 | 16 | 8584 | 36.27 | 910 | 917 | 211.4 |
| D | 7 | 80 | 846554 | 4025.16 | 896 | 872 | 210.1 |
| D | 1 | 52 | 588867 | 2798.66 | 896 | 872 | 210.1 |
| D | 8 | 195 | 354511 | 1683.2 | 896 | 872 | 210.1 |
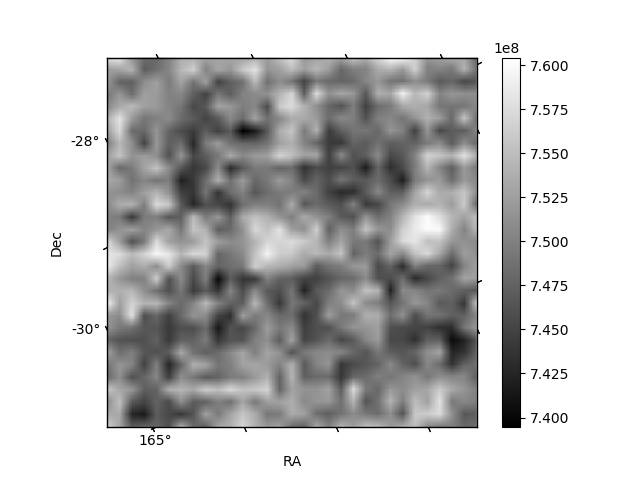
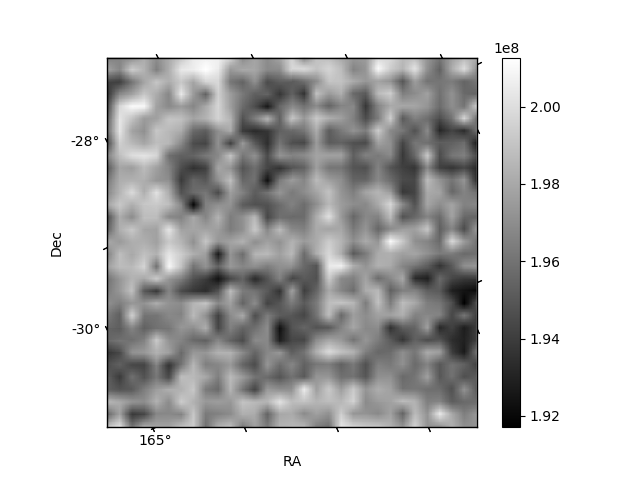
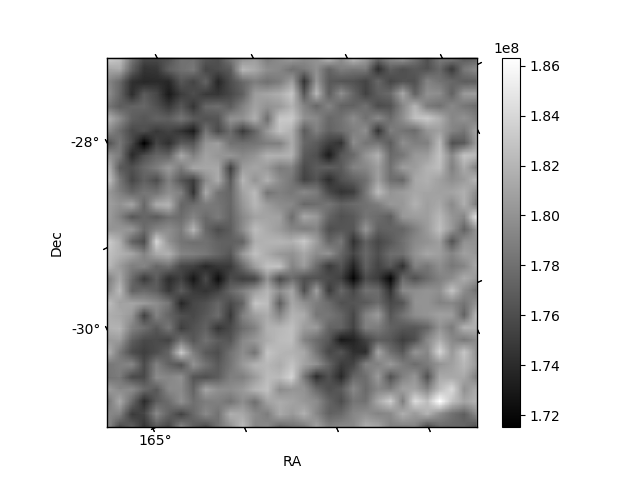
Histogram calculated using DETX and DETY for each event in the final _common_clean file
| Quadrant A | 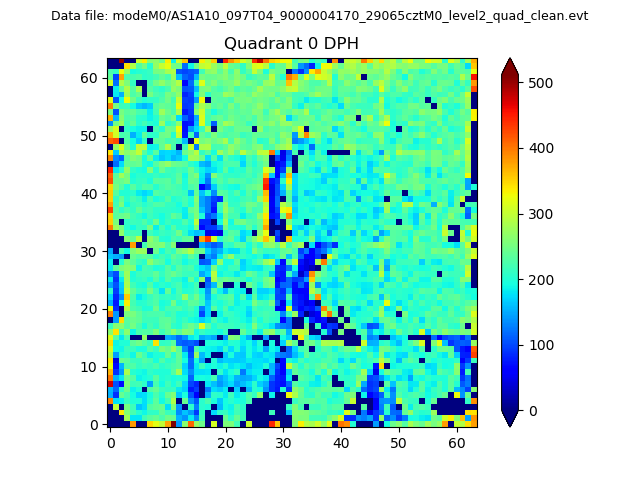 |
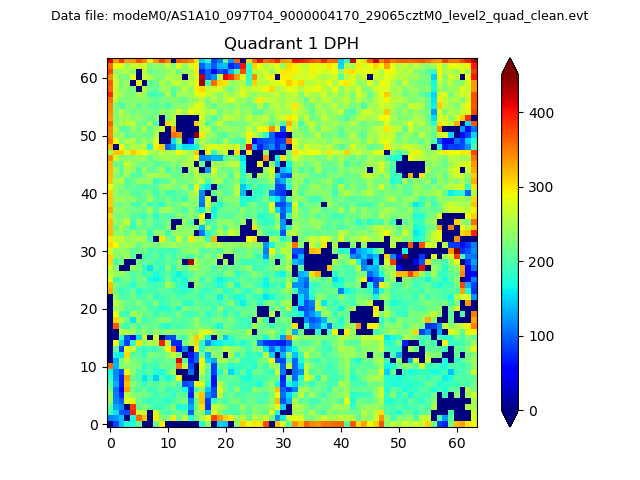 |
Quadrant B |
|---|---|---|---|
| Quadrant D | 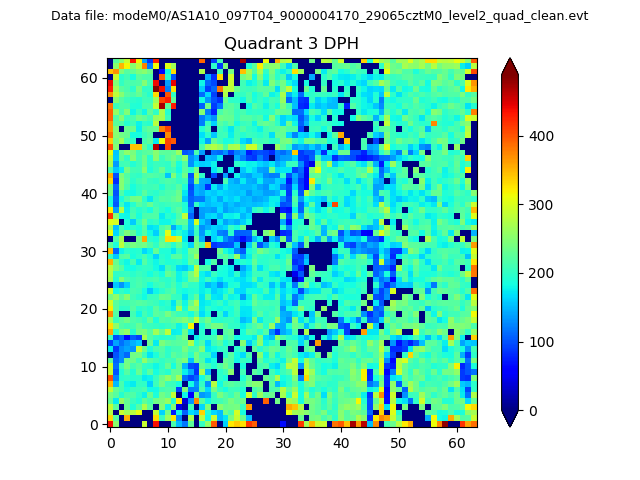 |
 |
Quadrant C |
| Plot type | Count rate plots | Images |
|---|---|---|
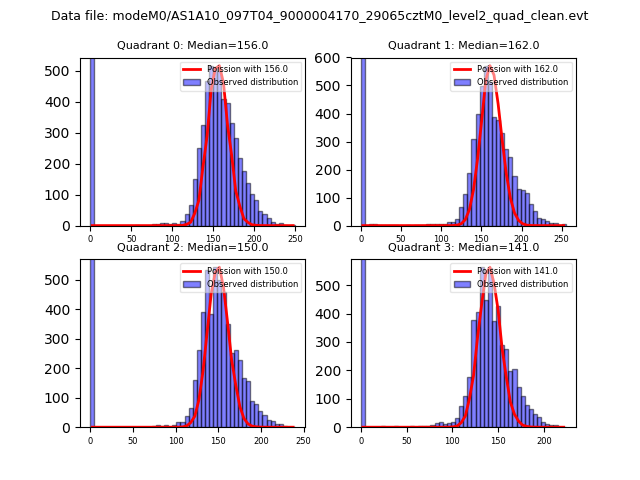
| Comparison with Poisson distribution Blue bars denote a histogram of data divided into 1 sec bins. Red curve is a Poisson curve with rate = median count rate of data. |
 |
 |
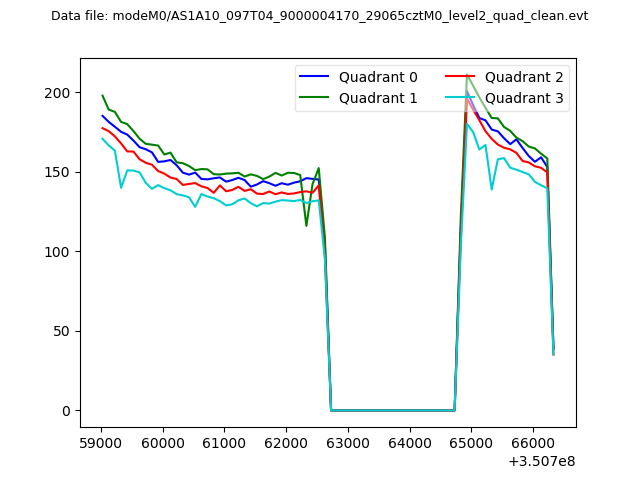
| Quadrant-wise count rates Data is divided into 100 sec bins |
 |
|
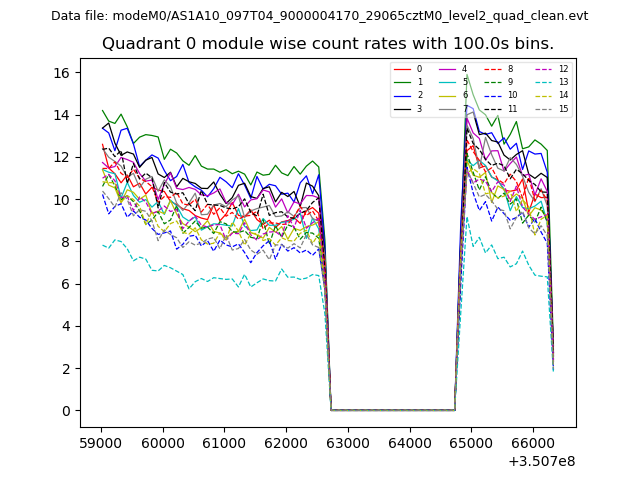
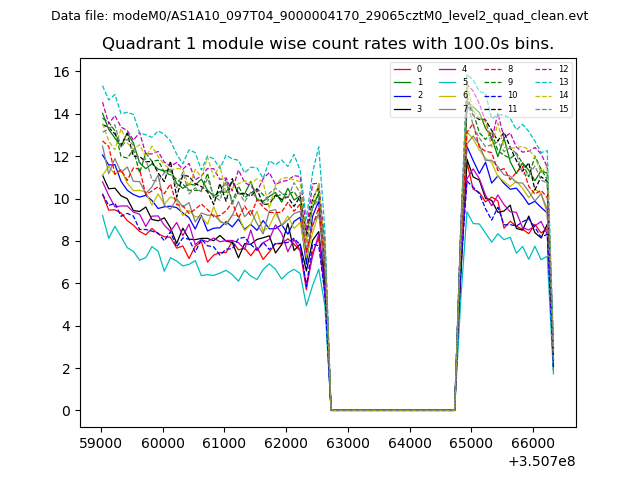
| Module-wise count rates for Quadrant A Data is divided into 100 sec bins |
 |
 |
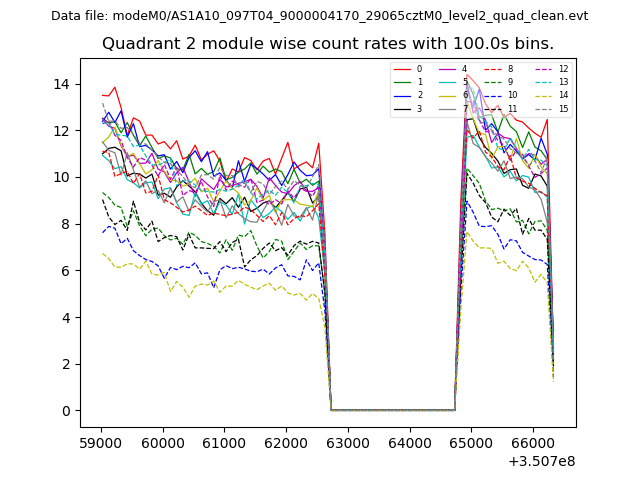
| Module-wise count rates for Quadrant B Data is divided into 100 sec bins |
 |
 |
| Module-wise count rates for Quadrant C Data is divided into 100 sec bins |
 |
 |
| Module-wise count rates for Quadrant D Data is divided into 100 sec bins |
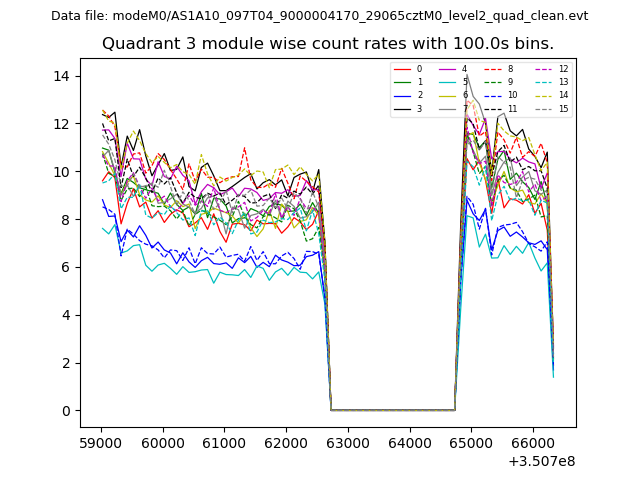 |
 |
| Parameter | Plot |
|---|---|
| CZT HV Monitor | 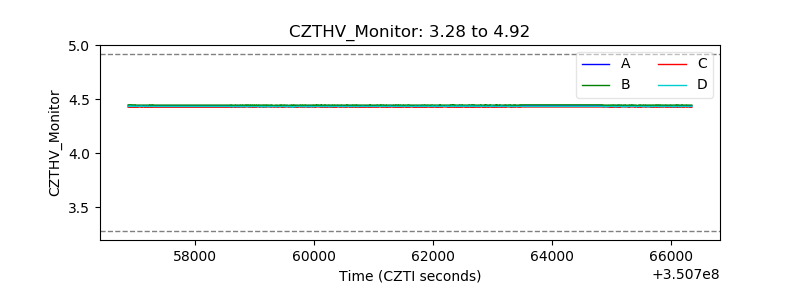 |
| D_VDD | 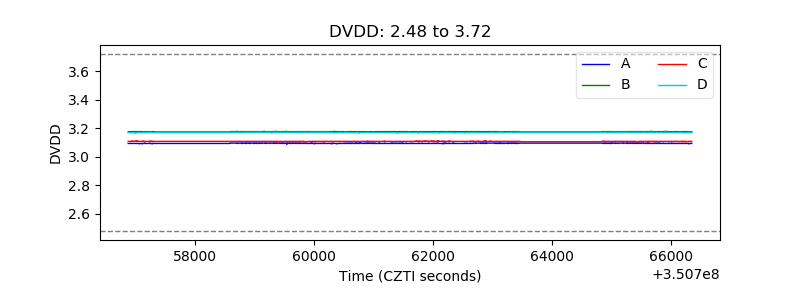 |
| Temperature 1 | 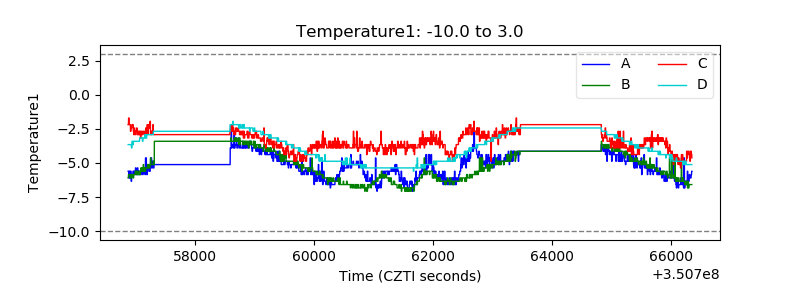 |
| Veto HV Monitor | 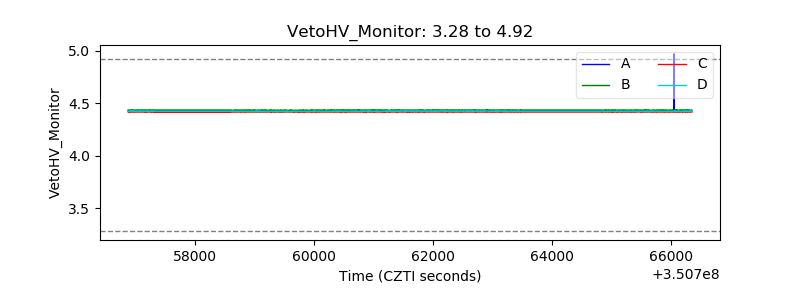 |
| Veto LLD | 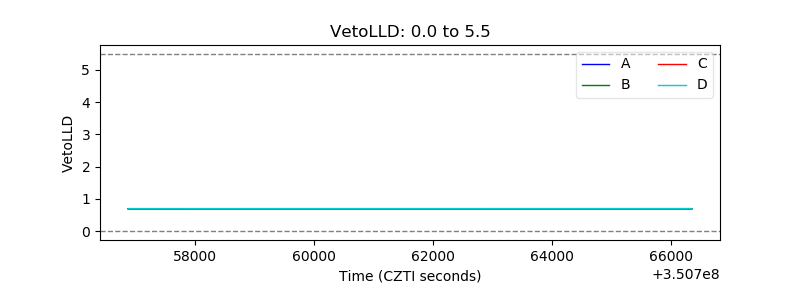 |
| Alpha Counter | 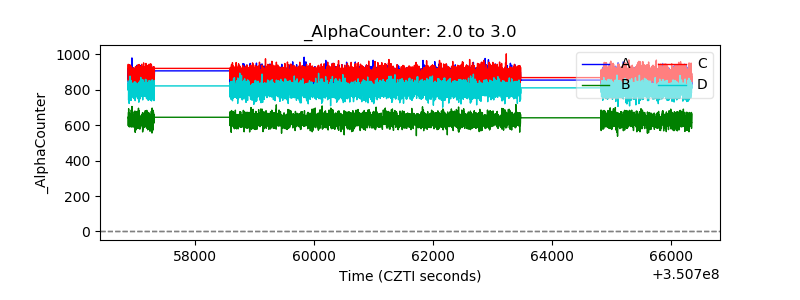 |
| _CPM_Rate | 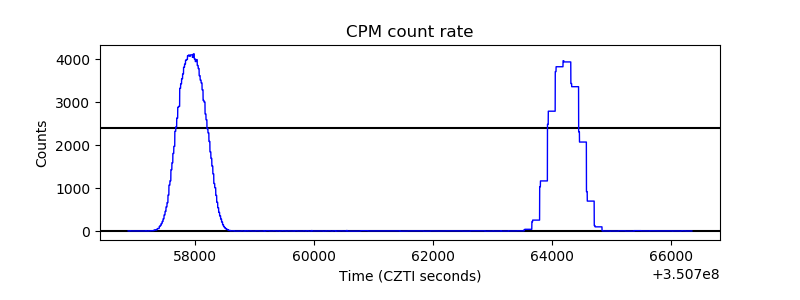 |
| CZT Counter |  |
| +2.5 Volts monitor |  |
| +5 Volts monitor | 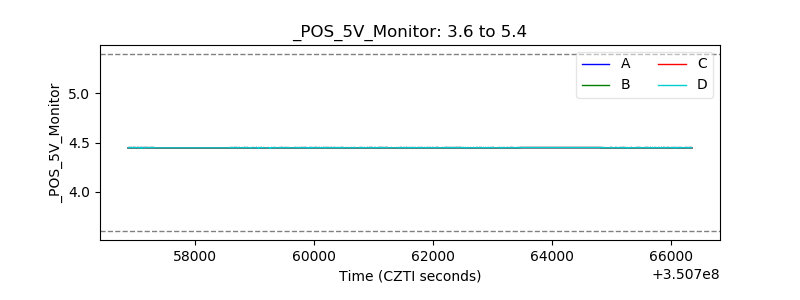 |
| _ROLL_ROT | 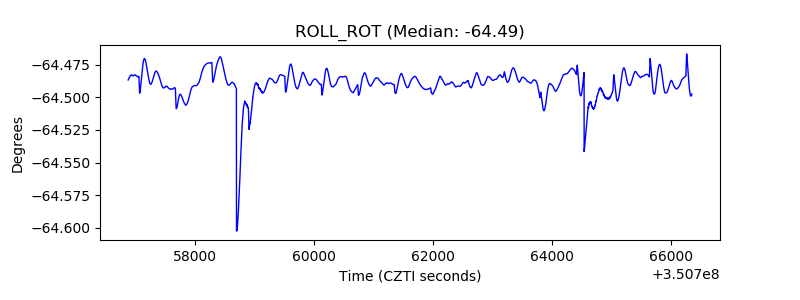 |
| _Roll_DEC | 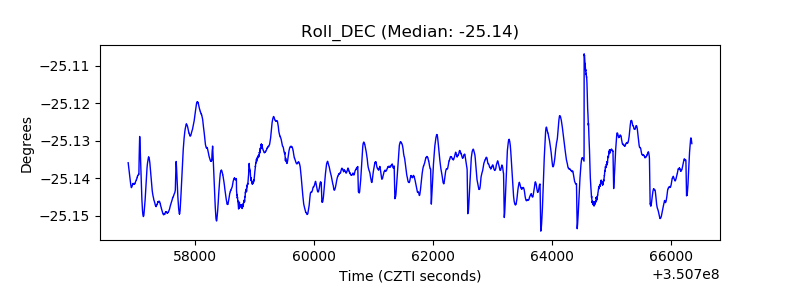 |
| _Roll_RA | 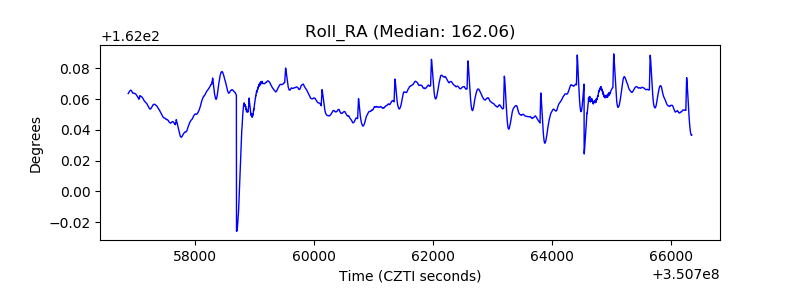 |
| Veto Counter | 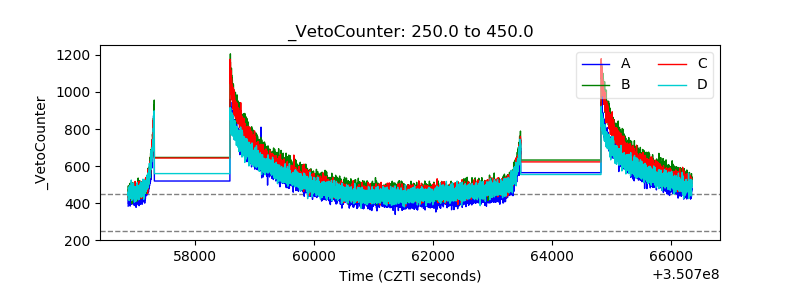 |