| Param | Original file | Final file |
|---|---|---|
| Filename | modeM0/AS1A10_097T04_9000004170_29070cztM0_level2.evt | modeM0/AS1A10_097T04_9000004170_29070cztM0_level2_quad_clean.evt |
| Size (bytes) | 673,459,200 | 125,651,520 |
| Size | 642.3 MB | 119.8 MB |
| Events in quadrant A | 4,083,354 | 827,130 |
| Events in quadrant B | 4,323,777 | 843,237 |
| Events in quadrant C | 4,260,434 | 798,619 |
| Events in quadrant D | 7,151,347 | 744,906 |
| Mode SS | |||
|---|---|---|---|
| Quadrant | BADHDUFLAG | Total packets | Discarded packets |
| A | 0 | 170 | 0 |
| B | 0 | 170 | 0 |
| C | 0 | 170 | 0 |
| D | 0 | 170 | 0 |
| Mode M9 | |||
|---|---|---|---|
| Quadrant | BADHDUFLAG | Total packets | Discarded packets |
| A | 0 | 5 | 0 |
| B | 0 | 5 | 0 |
| C | 0 | 5 | 0 |
| D | 0 | 5 | 0 |
| Mode M0 | |||
|---|---|---|---|
| Quadrant | BADHDUFLAG | Total packets | Discarded packets |
| A | 0 | 17757 | 1 |
| B | 0 | 18356 | 1 |
| C | 0 | 17956 | 1 |
| D | 0 | 27135 | 1 |
| Quadrant | Total seconds | Saturated seconds | Saturation percentage |
|---|---|---|---|
| A | 8517 | 155 | 1.819890% |
| B | 8518 | 315 | 3.698051% |
| C | 8518 | 368 | 4.320263% |
| D | 8518 | 826 | 9.697112% |
Noise dominated data is calculated using 1-second bins in cleaned event files. If a bin has >2000 counts, and if more than 50% of those come from <1% of pixels, then it is considered to be noise-dominated and hence unusable.
| Quadrant | # 1 sec bins | Bins with >0 counts | Bins with >2000 counts | High rate bins dominated by noise | Noise dominated (total time) | Noise dominated (detector-on time) | Marked lightcurve |
|---|---|---|---|---|---|---|---|
| A | 8972 | 8517 | 0 | 0 | 0.00% | 0.00% | 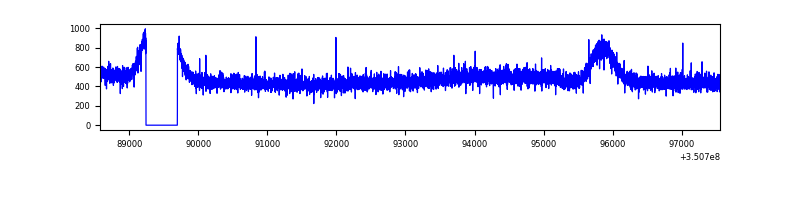 |
| B | 8973 | 8518 | 24 | 24 | 0.27% | 0.28% | 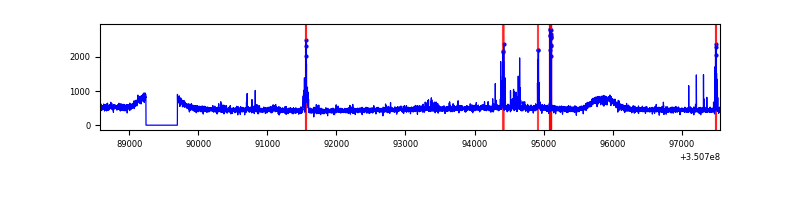 |
| C | 8973 | 8518 | 2 | 2 | 0.02% | 0.02% | 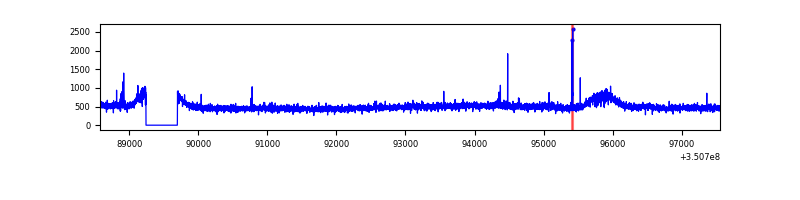 |
| D | 8973 | 8519 | 587 | 587 | 6.54% | 6.89% | 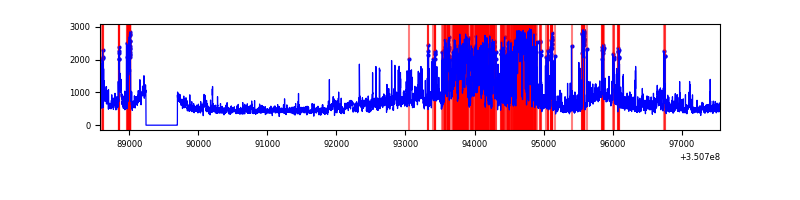 |
Top three noisy pixels from each quadrant. If the there are fewer than three noisy pixels in the level2.evt file, extra rows are filled as -1
| Pixel properties | Quadrant properties | ||||||
|---|---|---|---|---|---|---|---|
| Quadrant | DetID | PixID | Counts | Sigma | Mean | Median | Sigma |
| A | 13 | 254 | 14155 | 61.44 | 1058 | 1032 | 213.6 |
| A | 3 | 137 | 11142 | 47.34 | 1058 | 1032 | 213.6 |
| A | 0 | 226 | 9008 | 37.35 | 1058 | 1032 | 213.6 |
| B | 10 | 246 | 138254 | 673.93 | 1049 | 1019 | 203.6 |
| B | 15 | 222 | 39929 | 191.08 | 1049 | 1019 | 203.6 |
| B | 12 | 111 | 26463 | 124.95 | 1049 | 1019 | 203.6 |
| C | 14 | 238 | 162310 | 669.31 | 1020 | 1025 | 241.0 |
| C | 3 | 233 | 63436 | 259.0 | 1020 | 1025 | 241.0 |
| C | 2 | 16 | 33781 | 135.93 | 1020 | 1025 | 241.0 |
| D | 1 | 52 | 2154455 | 9068.63 | 990 | 959 | 237.5 |
| D | 8 | 195 | 1036558 | 4361.03 | 990 | 959 | 237.5 |
| D | 7 | 238 | 150037 | 627.79 | 990 | 959 | 237.5 |
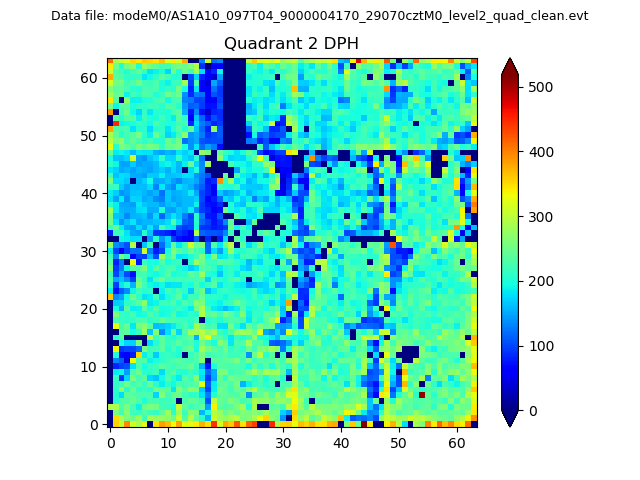
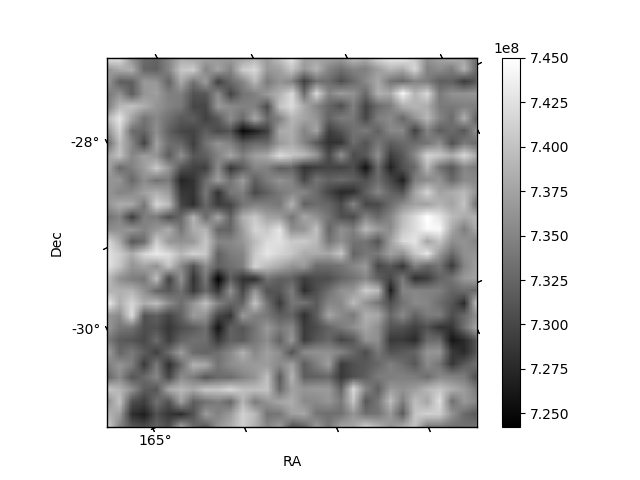
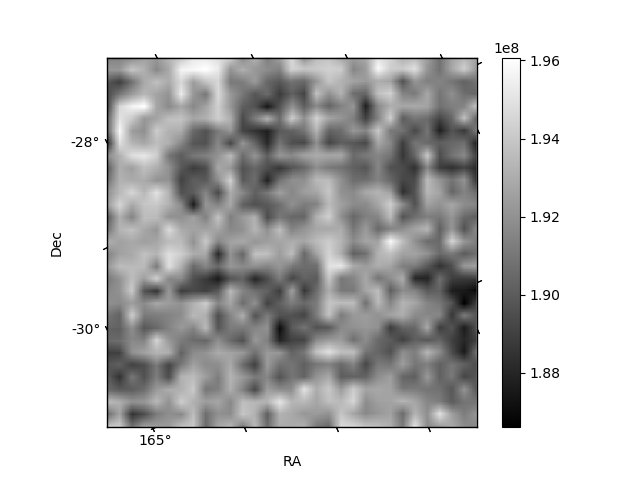
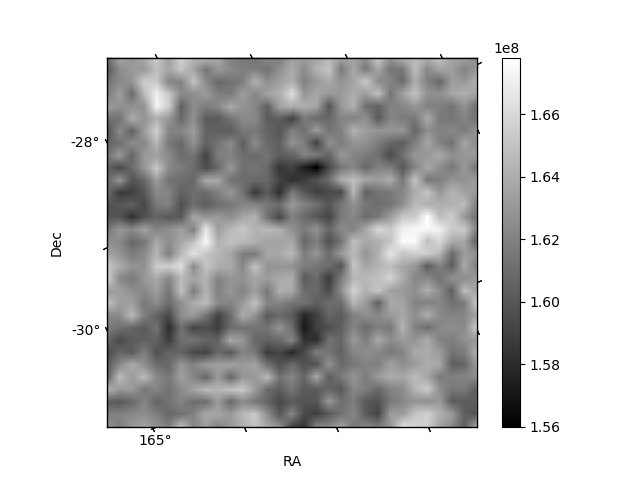
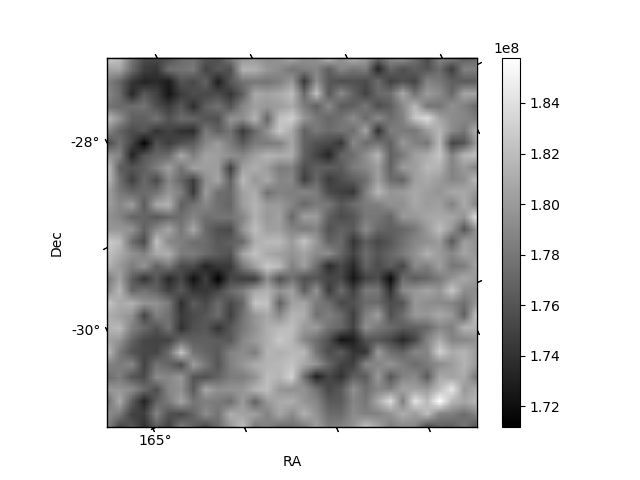
Histogram calculated using DETX and DETY for each event in the final _common_clean file
| Quadrant A | 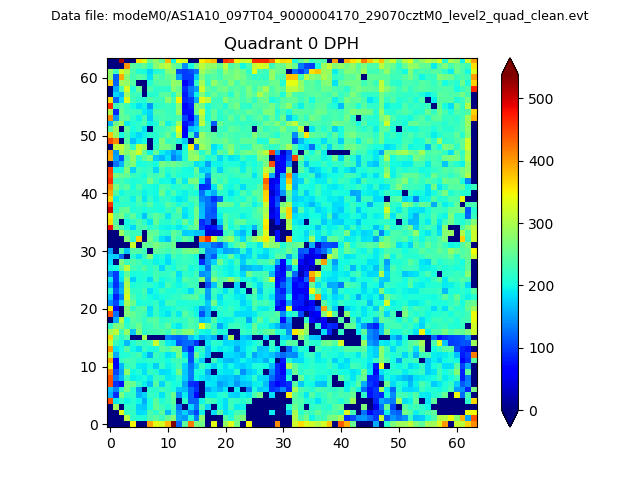 |
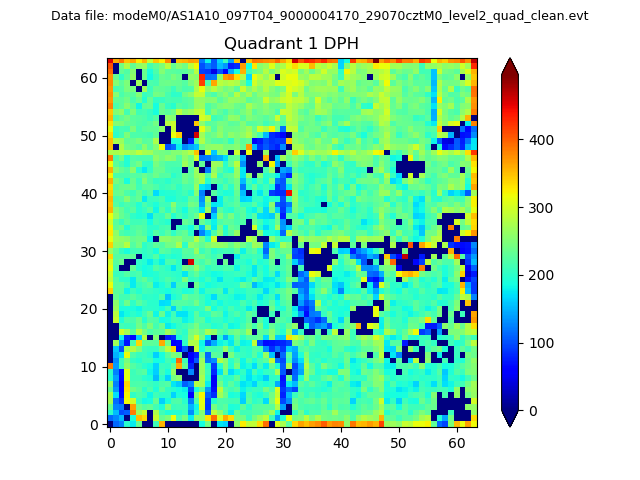 |
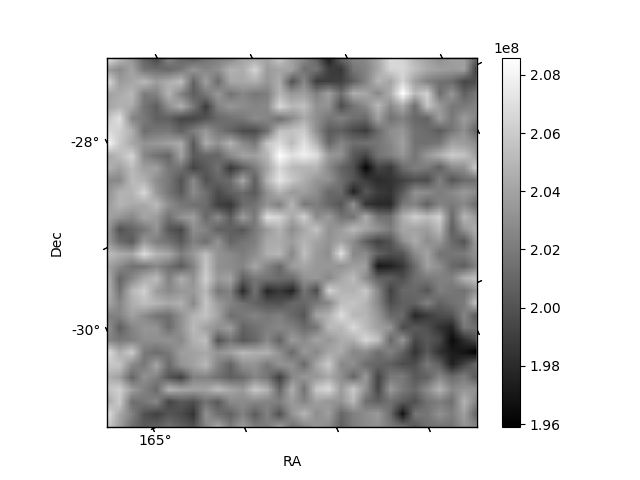
Quadrant B |
|---|---|---|---|
| Quadrant D | 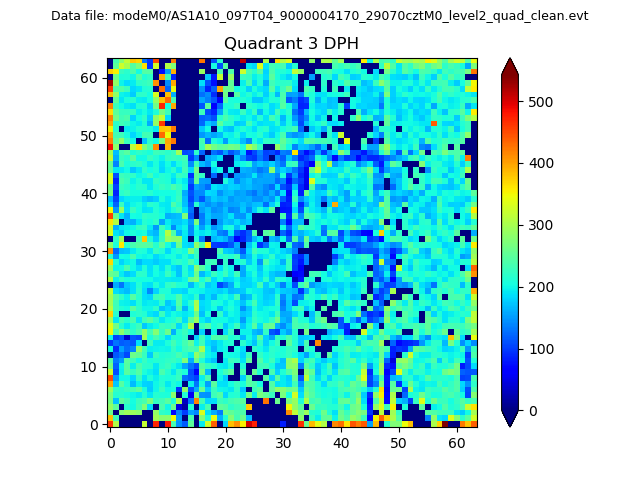 |
 |
Quadrant C |
| Plot type | Count rate plots | Images |
|---|---|---|
| Comparison with Poisson distribution Blue bars denote a histogram of data divided into 1 sec bins. Red curve is a Poisson curve with rate = median count rate of data. |
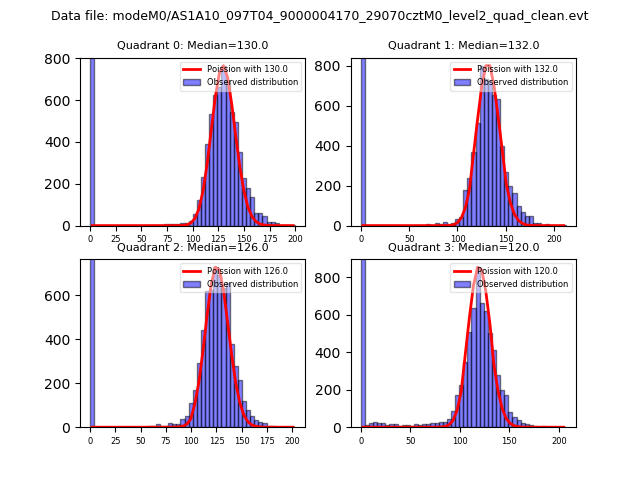 |
 |
| Quadrant-wise count rates Data is divided into 100 sec bins |
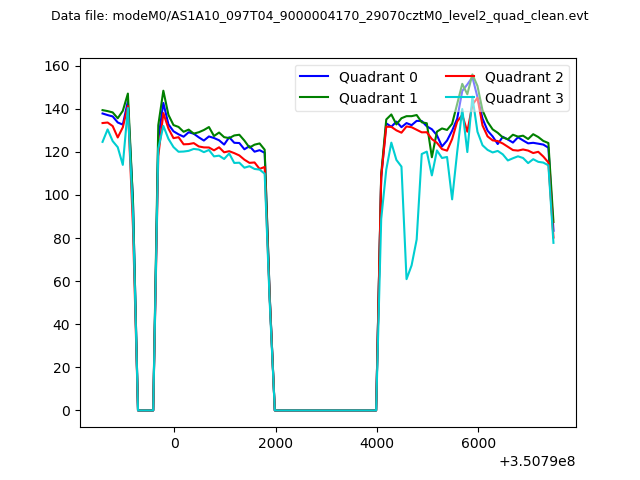 |
|
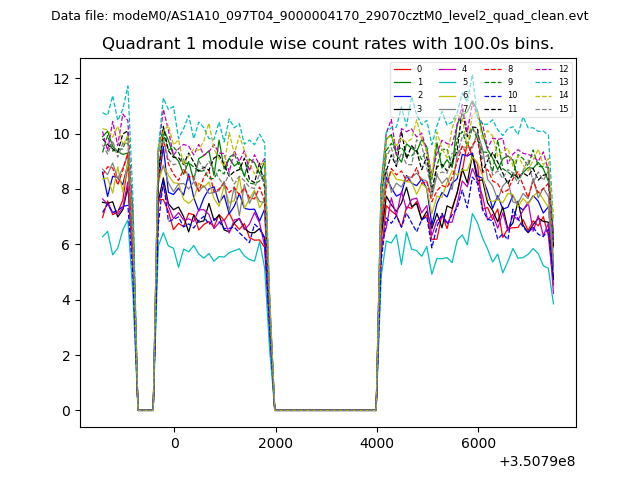
| Module-wise count rates for Quadrant A Data is divided into 100 sec bins |
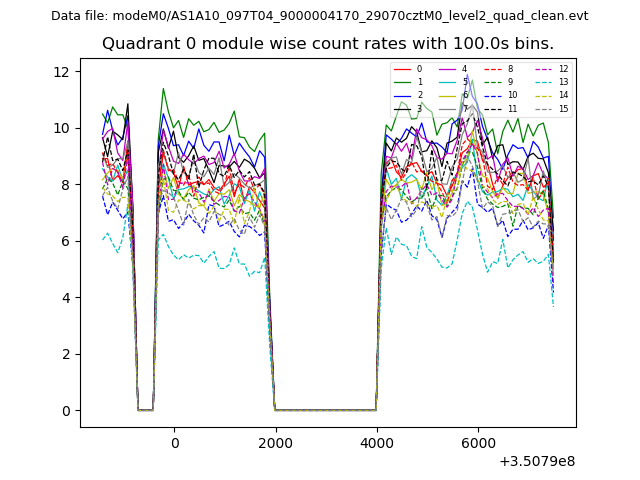 |
 |
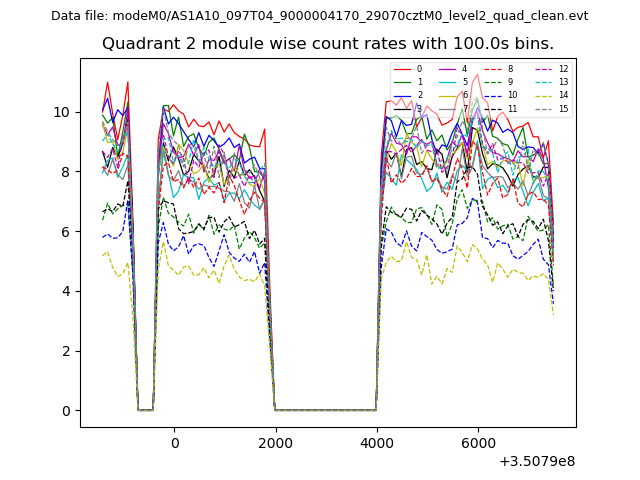
| Module-wise count rates for Quadrant B Data is divided into 100 sec bins |
 |
 |
| Module-wise count rates for Quadrant C Data is divided into 100 sec bins |
 |
 |
| Module-wise count rates for Quadrant D Data is divided into 100 sec bins |
 |
 |
| Parameter | Plot |
|---|---|
| CZT HV Monitor | 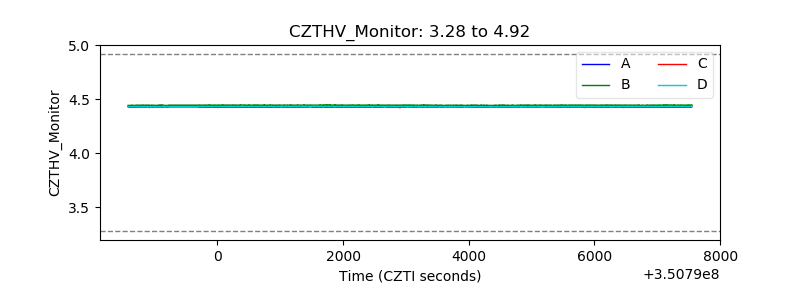 |
| D_VDD |  |
| Temperature 1 | 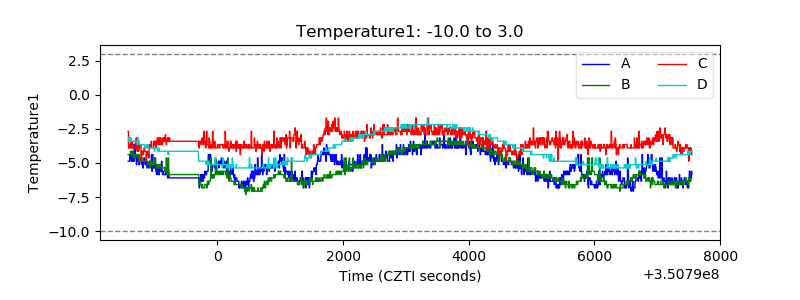 |
| Veto HV Monitor | 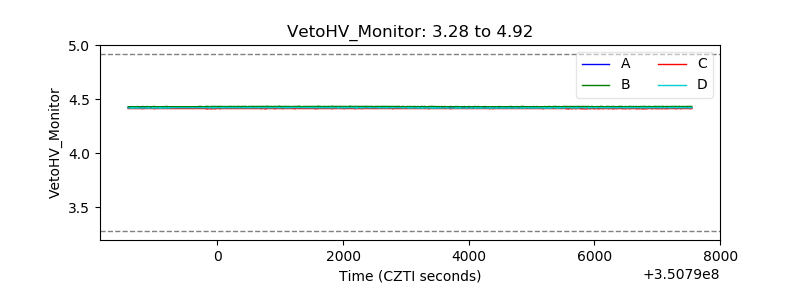 |
| Veto LLD |  |
| Alpha Counter | 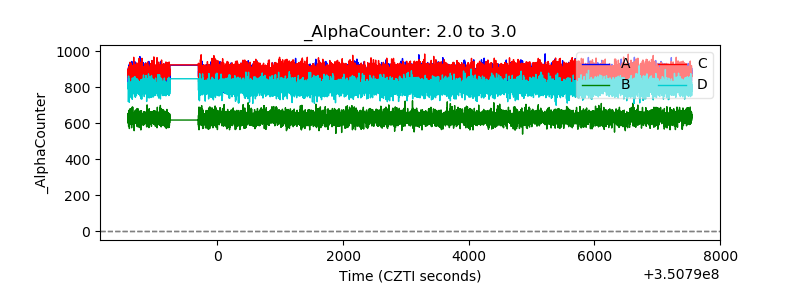 |
| _CPM_Rate | 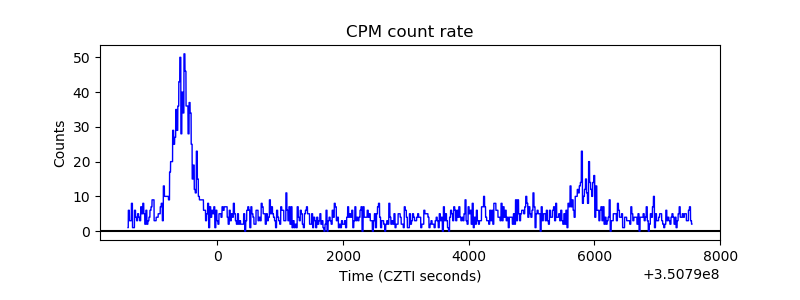 |
| CZT Counter | 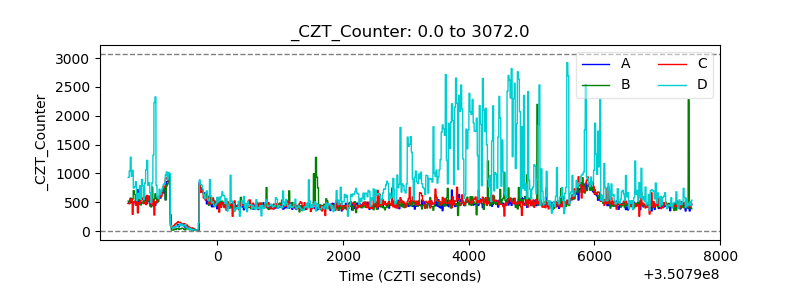 |
| +2.5 Volts monitor |  |
| +5 Volts monitor |  |
| _ROLL_ROT |  |
| _Roll_DEC | 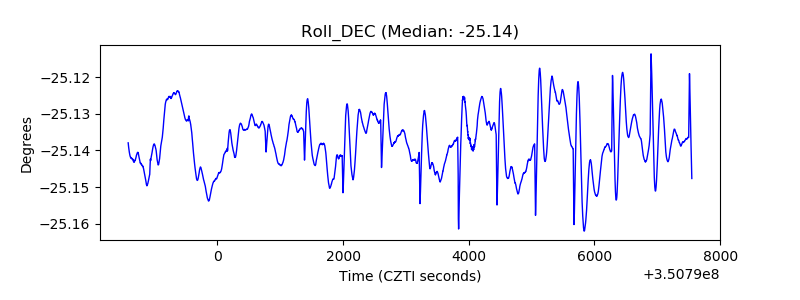 |
| _Roll_RA | 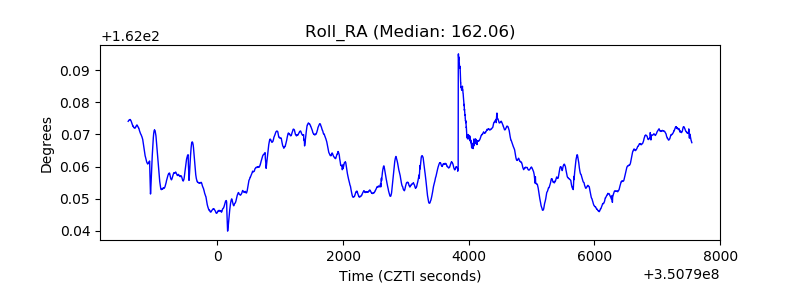 |
| Veto Counter |  |