| Param | Original file | Final file |
|---|---|---|
| Filename | modeM0/AS1A10_097T04_9000004170_29071cztM0_level2.evt | modeM0/AS1A10_097T04_9000004170_29071cztM0_level2_quad_clean.evt |
| Size (bytes) | 614,733,120 | 122,719,680 |
| Size | 586.3 MB | 117.0 MB |
| Events in quadrant A | 4,128,236 | 798,686 |
| Events in quadrant B | 4,231,352 | 813,444 |
| Events in quadrant C | 4,395,785 | 767,447 |
| Events in quadrant D | 5,280,687 | 741,965 |
| Mode SS | |||
|---|---|---|---|
| Quadrant | BADHDUFLAG | Total packets | Discarded packets |
| A | 0 | 172 | 0 |
| B | 0 | 172 | 0 |
| C | 0 | 172 | 0 |
| D | 0 | 172 | 0 |
| Mode M9 | |||
|---|---|---|---|
| Quadrant | BADHDUFLAG | Total packets | Discarded packets |
| A | 0 | 1 | 0 |
| B | 0 | 1 | 0 |
| C | 0 | 1 | 0 |
| D | 0 | 1 | 0 |
| Mode M0 | |||
|---|---|---|---|
| Quadrant | BADHDUFLAG | Total packets | Discarded packets |
| A | 0 | 17960 | 1 |
| B | 0 | 18151 | 1 |
| C | 0 | 18410 | 1 |
| D | 0 | 21232 | 1 |
| Quadrant | Total seconds | Saturated seconds | Saturation percentage |
|---|---|---|---|
| A | 8565 | 310 | 3.619381% |
| B | 8566 | 442 | 5.159935% |
| C | 8566 | 511 | 5.965445% |
| D | 8566 | 423 | 4.938127% |
Noise dominated data is calculated using 1-second bins in cleaned event files. If a bin has >2000 counts, and if more than 50% of those come from <1% of pixels, then it is considered to be noise-dominated and hence unusable.
| Quadrant | # 1 sec bins | Bins with >0 counts | Bins with >2000 counts | High rate bins dominated by noise | Noise dominated (total time) | Noise dominated (detector-on time) | Marked lightcurve |
|---|---|---|---|---|---|---|---|
| A | 8655 | 8565 | 0 | 0 | 0.00% | 0.00% | 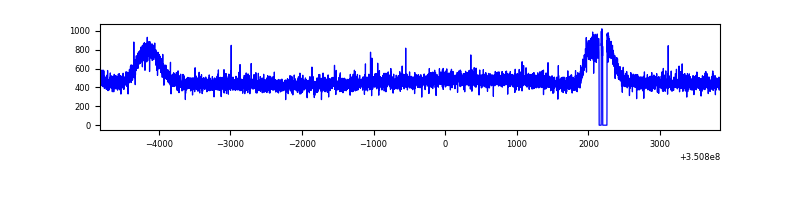 |
| B | 8655 | 8566 | 8 | 8 | 0.09% | 0.09% | 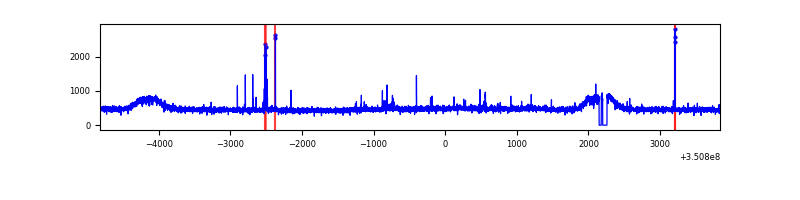 |
| C | 8656 | 8566 | 12 | 12 | 0.14% | 0.14% | 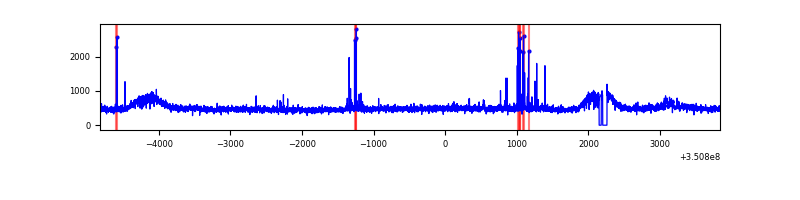 |
| D | 8656 | 8567 | 119 | 119 | 1.37% | 1.39% | 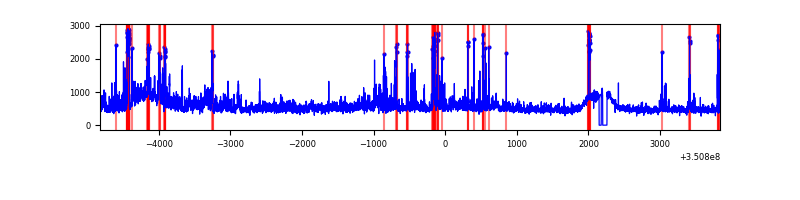 |
Top three noisy pixels from each quadrant. If the there are fewer than three noisy pixels in the level2.evt file, extra rows are filled as -1
| Pixel properties | Quadrant properties | ||||||
|---|---|---|---|---|---|---|---|
| Quadrant | DetID | PixID | Counts | Sigma | Mean | Median | Sigma |
| A | 13 | 254 | 14007 | 60.09 | 1068 | 1045 | 215.7 |
| A | 3 | 137 | 11316 | 47.62 | 1068 | 1045 | 215.7 |
| A | 0 | 226 | 8909 | 36.46 | 1068 | 1045 | 215.7 |
| B | 10 | 246 | 41254 | 197.63 | 1056 | 1024 | 203.6 |
| B | 12 | 111 | 26713 | 126.2 | 1056 | 1024 | 203.6 |
| B | 11 | 111 | 24220 | 113.95 | 1056 | 1024 | 203.6 |
| C | 14 | 238 | 162497 | 669.67 | 1026 | 1031 | 241.1 |
| C | 3 | 233 | 121282 | 498.73 | 1026 | 1031 | 241.1 |
| C | 2 | 16 | 92212 | 378.17 | 1026 | 1031 | 241.1 |
| D | 1 | 52 | 520009 | 2121.33 | 1026 | 993 | 244.7 |
| D | 8 | 195 | 435494 | 1775.9 | 1026 | 993 | 244.7 |
| D | 7 | 238 | 255315 | 1039.47 | 1026 | 993 | 244.7 |
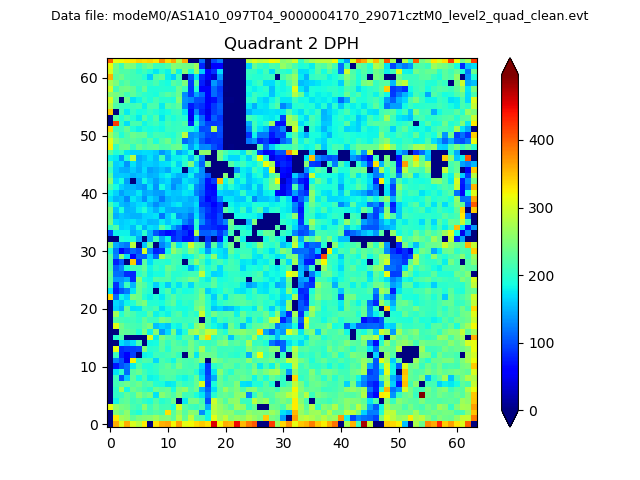
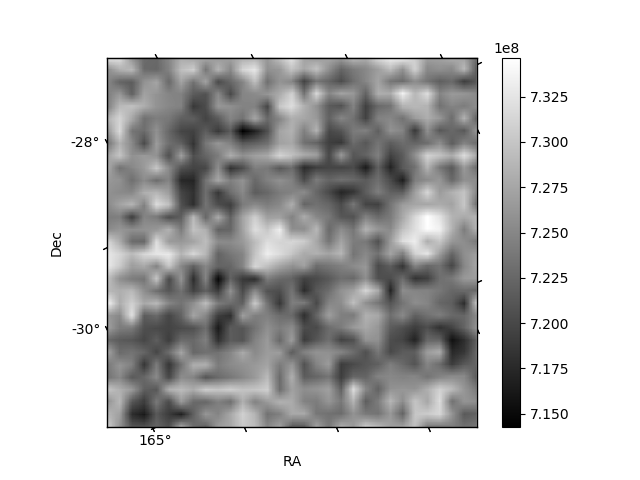
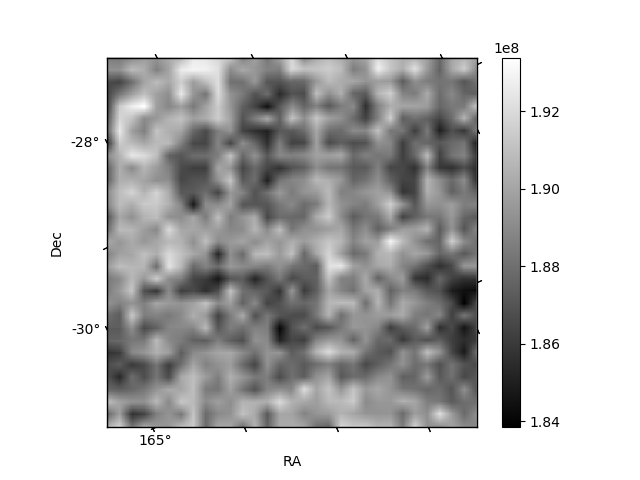
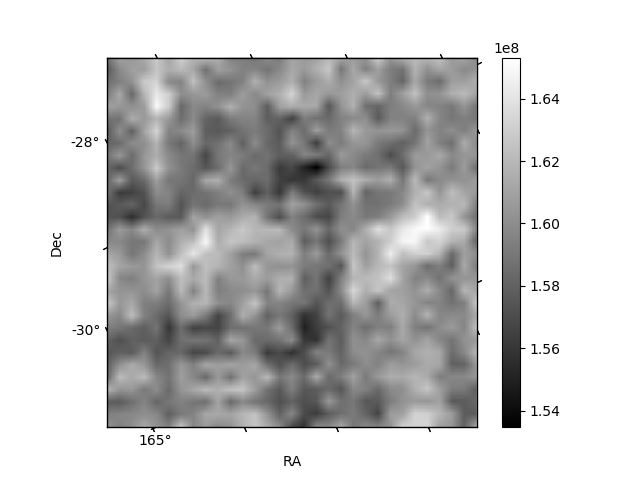
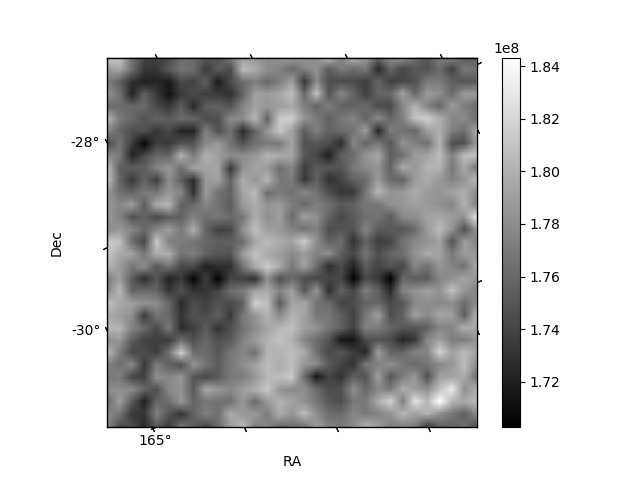
Histogram calculated using DETX and DETY for each event in the final _common_clean file
| Quadrant A | 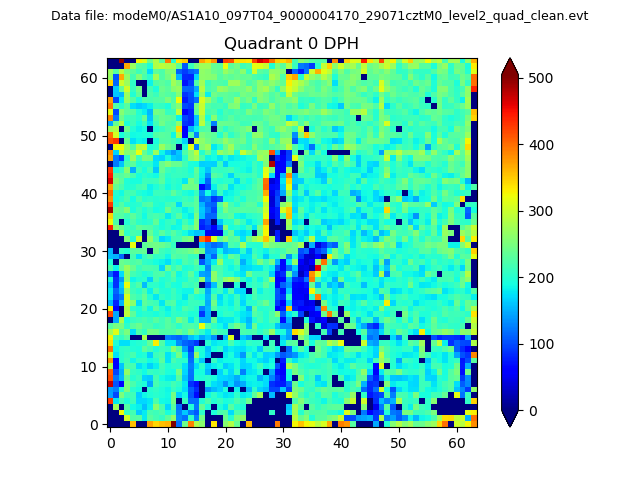 |
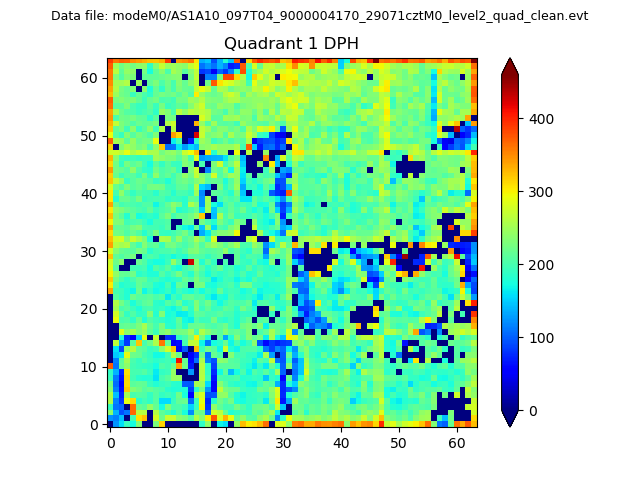 |
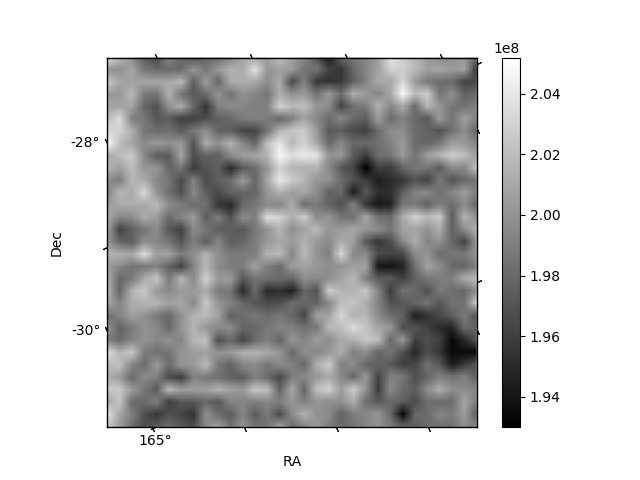
Quadrant B |
|---|---|---|---|
| Quadrant D | 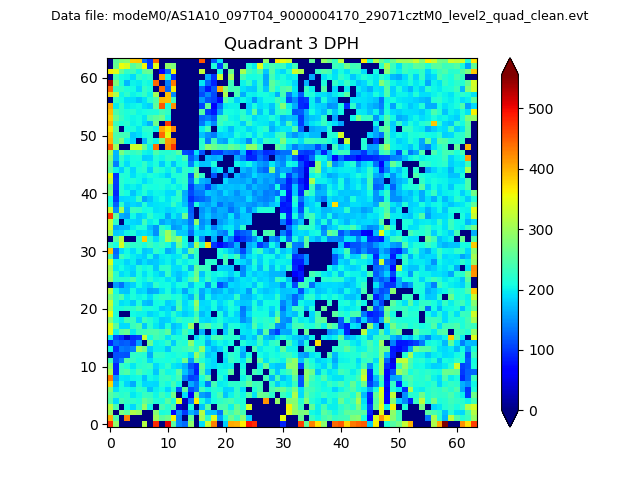 |
 |
Quadrant C |
| Plot type | Count rate plots | Images |
|---|---|---|
| Comparison with Poisson distribution Blue bars denote a histogram of data divided into 1 sec bins. Red curve is a Poisson curve with rate = median count rate of data. |
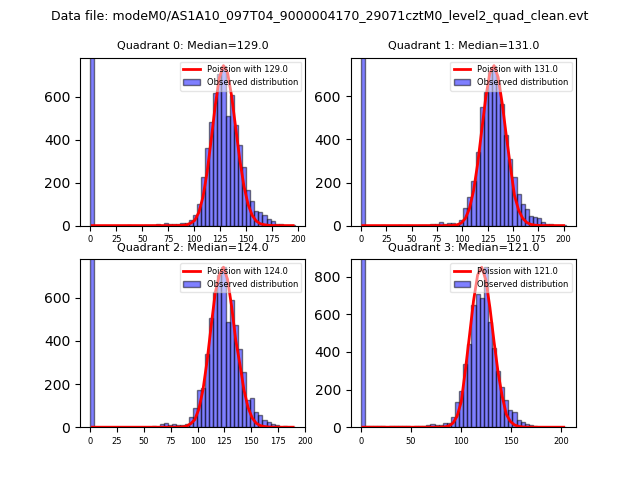 |
 |
| Quadrant-wise count rates Data is divided into 100 sec bins |
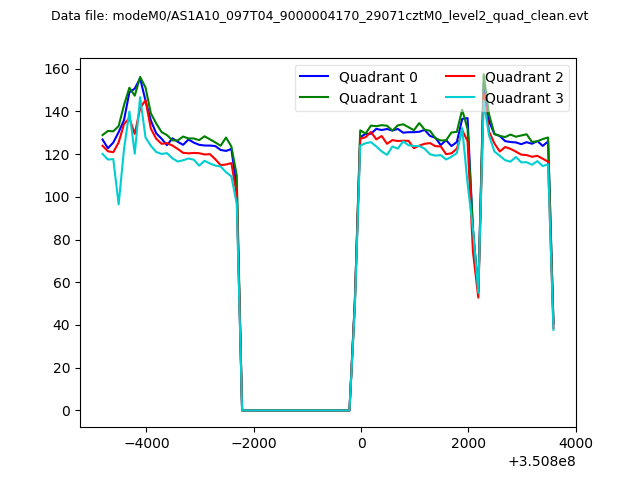 |
|
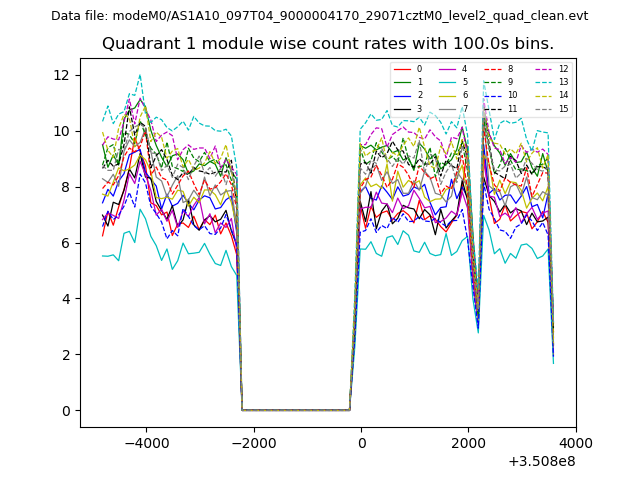
| Module-wise count rates for Quadrant A Data is divided into 100 sec bins |
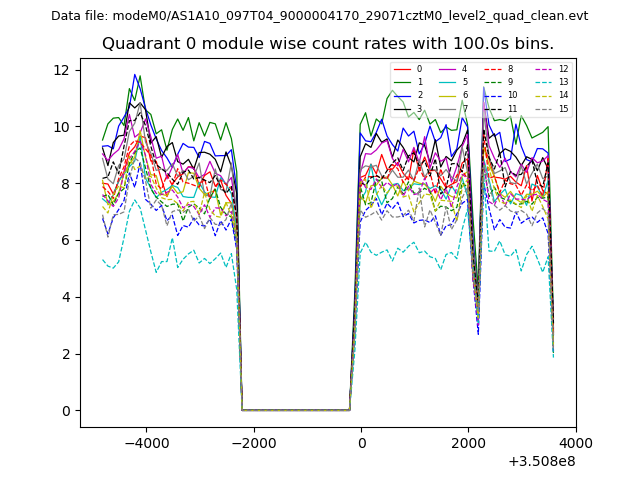 |
 |
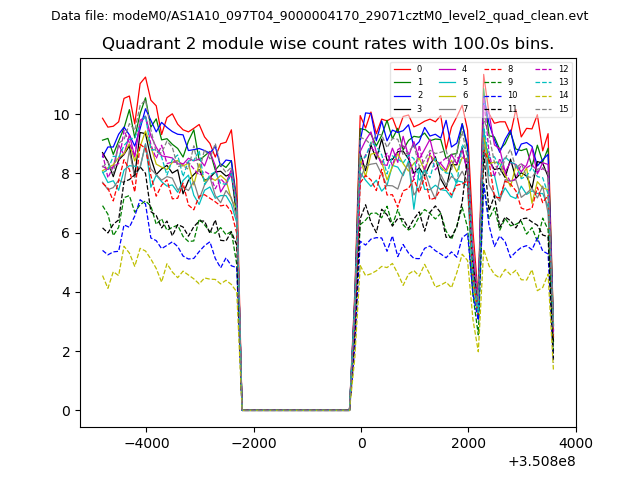
| Module-wise count rates for Quadrant B Data is divided into 100 sec bins |
 |
 |
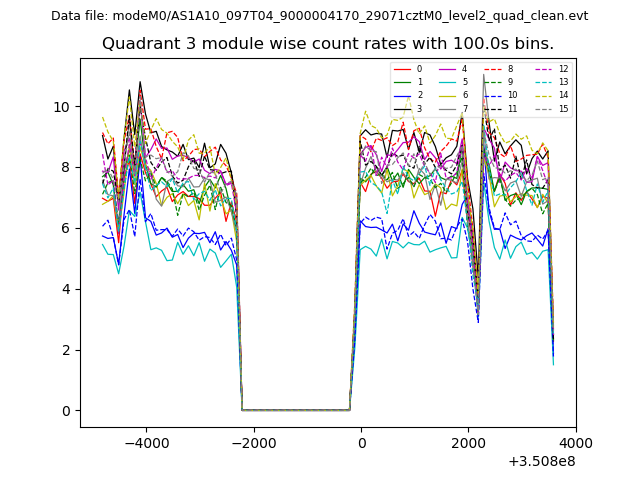
| Module-wise count rates for Quadrant C Data is divided into 100 sec bins |
 |
 |
| Module-wise count rates for Quadrant D Data is divided into 100 sec bins |
 |
 |
| Parameter | Plot |
|---|---|
| CZT HV Monitor | 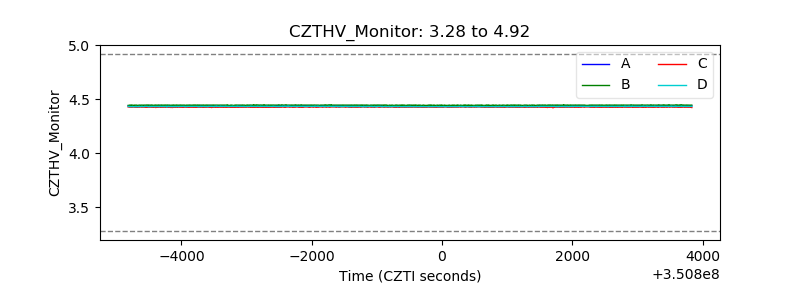 |
| D_VDD | 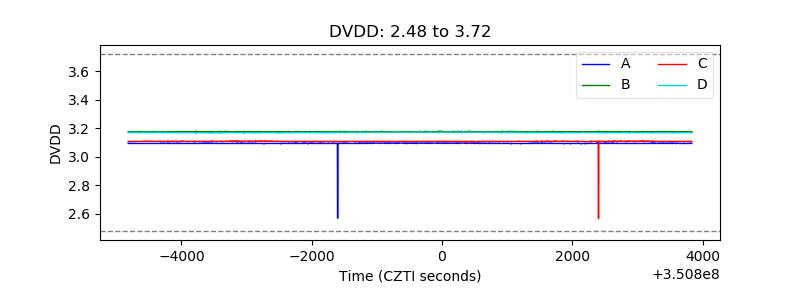 |
| Temperature 1 | 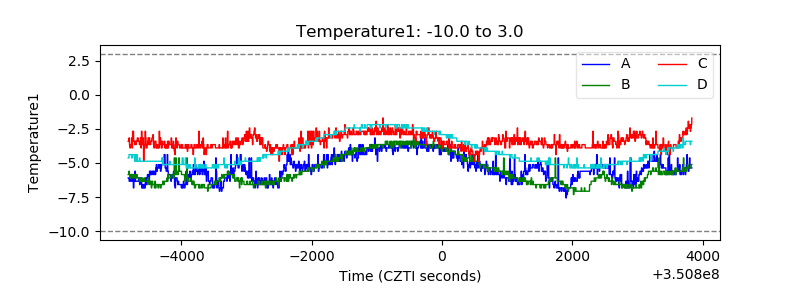 |
| Veto HV Monitor |  |
| Veto LLD | 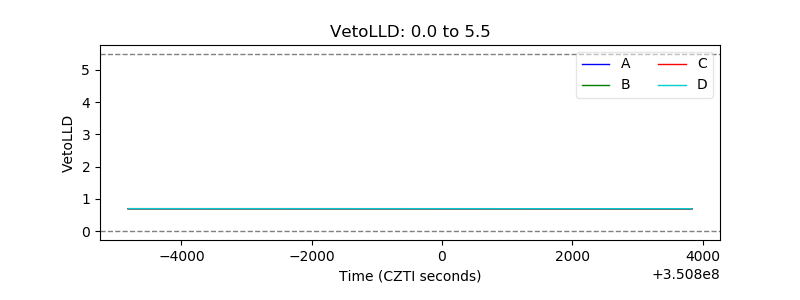 |
| Alpha Counter | 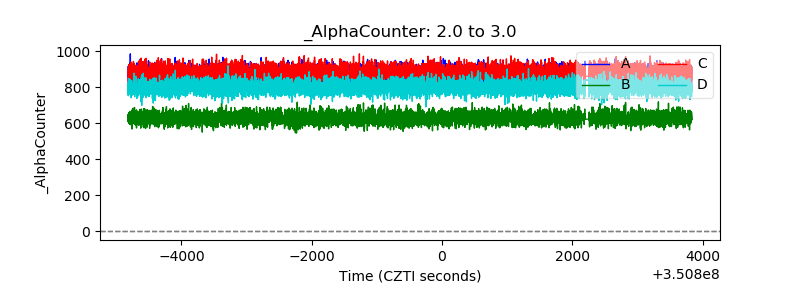 |
| _CPM_Rate | 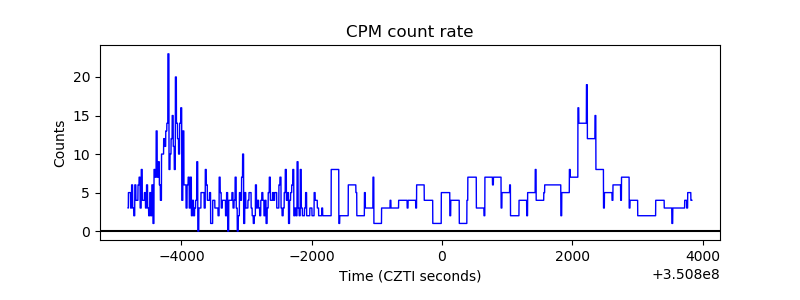 |
| CZT Counter | 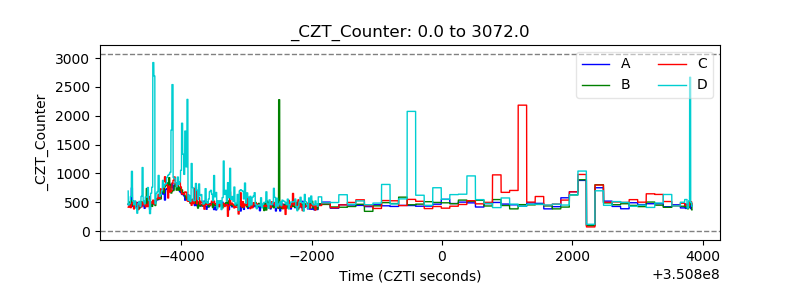 |
| +2.5 Volts monitor |  |
| +5 Volts monitor | 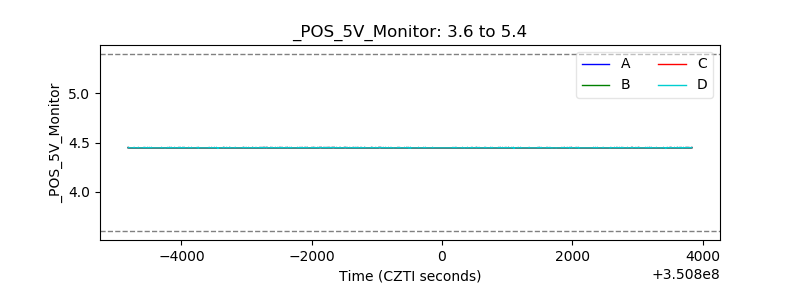 |
| _ROLL_ROT | 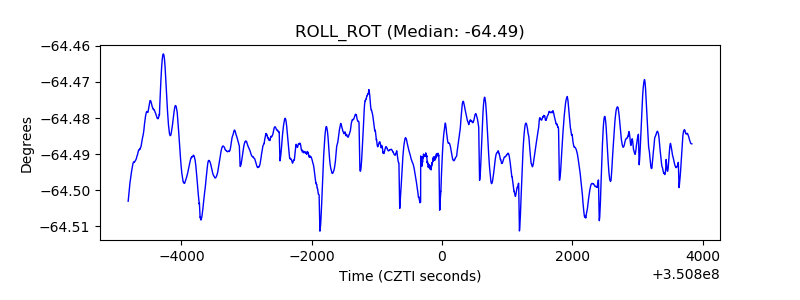 |
| _Roll_DEC | 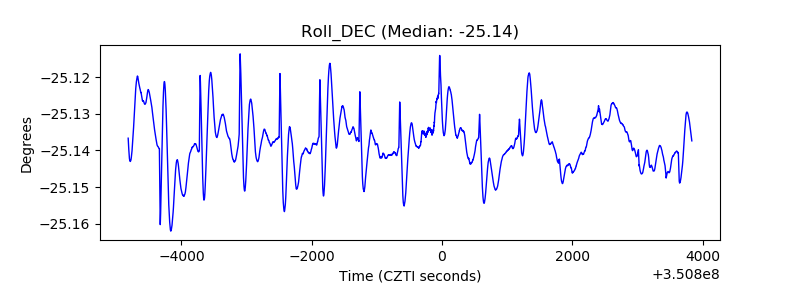 |
| _Roll_RA | 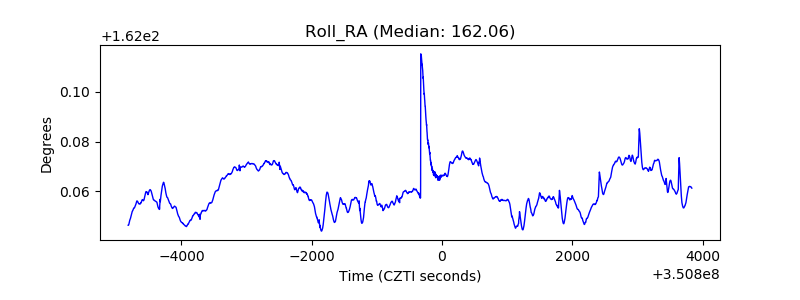 |
| Veto Counter | 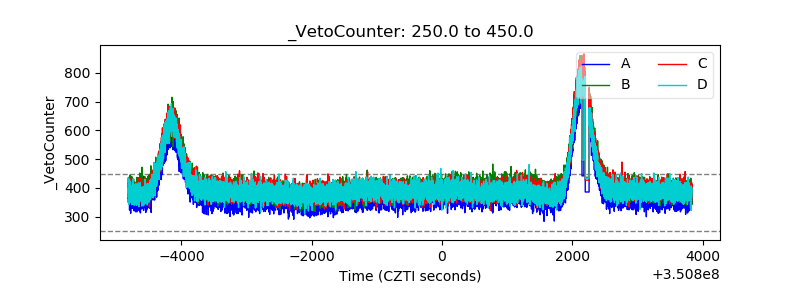 |