| Param | Original file | Final file |
|---|---|---|
| Filename | modeM0/AS1A10_097T04_9000004170_29074cztM0_level2.evt | modeM0/AS1A10_097T04_9000004170_29074cztM0_level2_quad_clean.evt |
| Size (bytes) | 1,423,033,920 | 224,233,920 |
| Size | 1.3 GB | 213.8 MB |
| Events in quadrant A | 8,999,106 | 1,399,193 |
| Events in quadrant B | 9,168,738 | 1,420,859 |
| Events in quadrant C | 9,743,145 | 1,357,189 |
| Events in quadrant D | 13,898,217 | 1,300,181 |
| Mode SS | |||
|---|---|---|---|
| Quadrant | BADHDUFLAG | Total packets | Discarded packets |
| A | 0 | 390 | 0 |
| B | 0 | 390 | 0 |
| C | 0 | 390 | 0 |
| D | 0 | 390 | 0 |
| Mode M9 | |||
|---|---|---|---|
| Quadrant | BADHDUFLAG | Total packets | Discarded packets |
| A | 0 | 20 | 0 |
| B | 0 | 20 | 0 |
| C | 0 | 20 | 0 |
| D | 0 | 20 | 0 |
| Mode M0 | |||
|---|---|---|---|
| Quadrant | BADHDUFLAG | Total packets | Discarded packets |
| A | 0 | 39320 | 5 |
| B | 0 | 39468 | 4 |
| C | 0 | 40648 | 4 |
| D | 0 | 53992 | 4 |
| Quadrant | Total seconds | Saturated seconds | Saturation percentage |
|---|---|---|---|
| A | 19063 | 425 | 2.229450% |
| B | 19064 | 499 | 2.617499% |
| C | 19064 | 600 | 3.147293% |
| D | 19064 | 898 | 4.710449% |
Noise dominated data is calculated using 1-second bins in cleaned event files. If a bin has >2000 counts, and if more than 50% of those come from <1% of pixels, then it is considered to be noise-dominated and hence unusable.
| Quadrant | # 1 sec bins | Bins with >0 counts | Bins with >2000 counts | High rate bins dominated by noise | Noise dominated (total time) | Noise dominated (detector-on time) | Marked lightcurve |
|---|---|---|---|---|---|---|---|
| A | 20952 | 19062 | 0 | 0 | 0.00% | 0.00% | 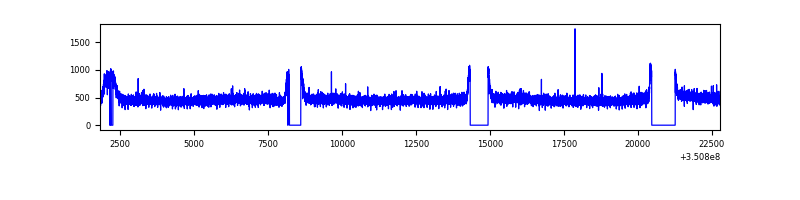 |
| B | 20954 | 19065 | 4 | 4 | 0.02% | 0.02% | 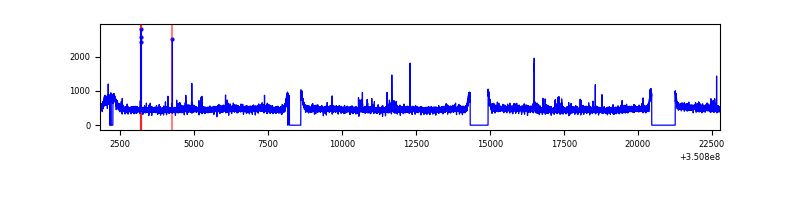 |
| C | 20954 | 19064 | 12 | 12 | 0.06% | 0.06% | 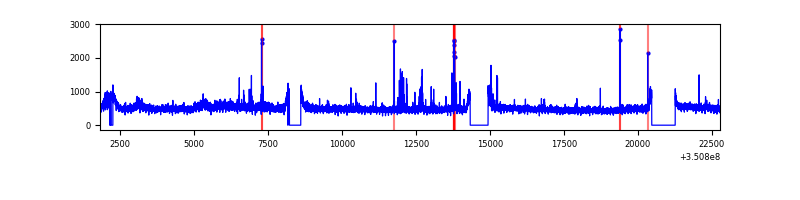 |
| D | 20955 | 19066 | 533 | 533 | 2.54% | 2.80% | 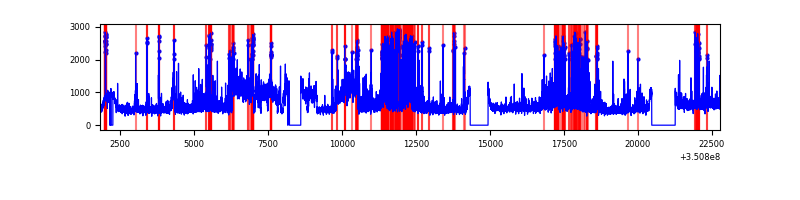 |
Top three noisy pixels from each quadrant. If the there are fewer than three noisy pixels in the level2.evt file, extra rows are filled as -1
| Pixel properties | Quadrant properties | ||||||
|---|---|---|---|---|---|---|---|
| Quadrant | DetID | PixID | Counts | Sigma | Mean | Median | Sigma |
| A | 13 | 254 | 29614 | 58.38 | 2325 | 2270 | 468.4 |
| A | 3 | 137 | 24254 | 46.93 | 2325 | 2270 | 468.4 |
| A | 0 | 226 | 19459 | 36.7 | 2325 | 2270 | 468.4 |
| B | 12 | 111 | 57886 | 125.49 | 2307 | 2245 | 443.4 |
| B | 11 | 111 | 52312 | 112.91 | 2307 | 2245 | 443.4 |
| B | 14 | 111 | 49900 | 107.47 | 2307 | 2245 | 443.4 |
| C | 3 | 233 | 417331 | 787.07 | 2245 | 2258 | 527.4 |
| C | 14 | 238 | 358466 | 675.45 | 2245 | 2258 | 527.4 |
| C | 2 | 16 | 175095 | 327.74 | 2245 | 2258 | 527.4 |
| D | 8 | 195 | 2831492 | 5303.59 | 2236 | 2175 | 533.5 |
| D | 1 | 52 | 1938084 | 3628.89 | 2236 | 2175 | 533.5 |
| D | 2 | 250 | 300808 | 559.79 | 2236 | 2175 | 533.5 |
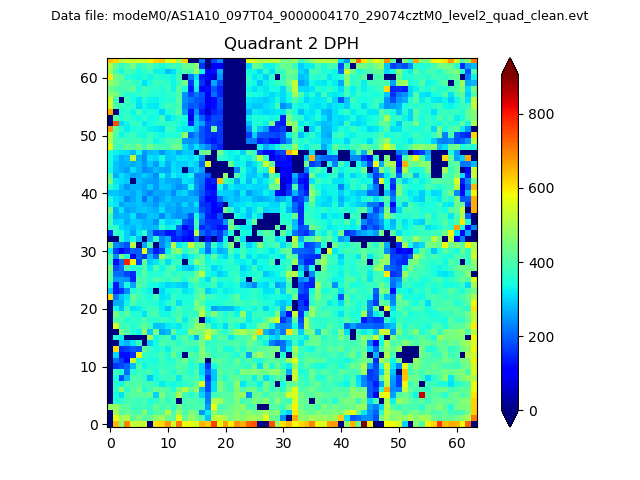
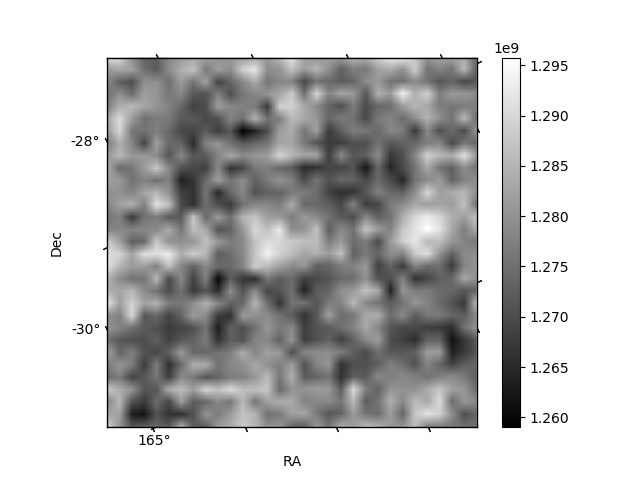
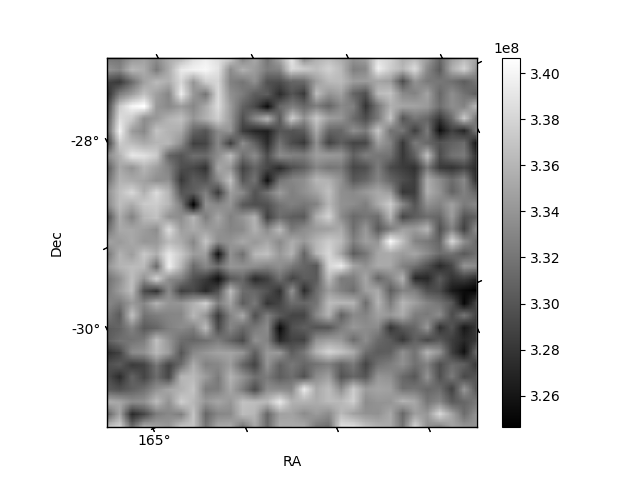
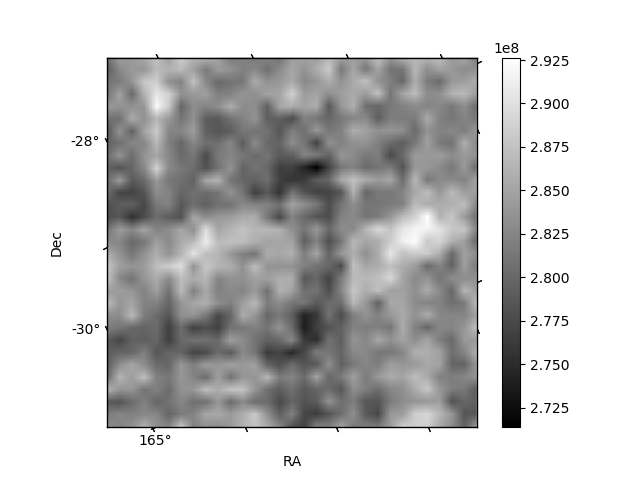
Histogram calculated using DETX and DETY for each event in the final _common_clean file
| Quadrant A | 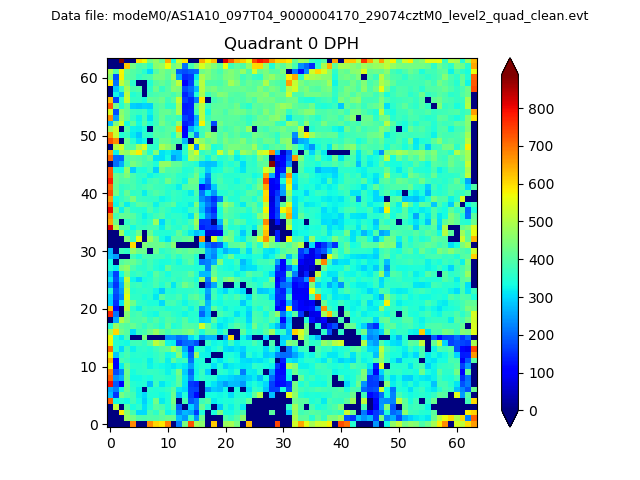 |
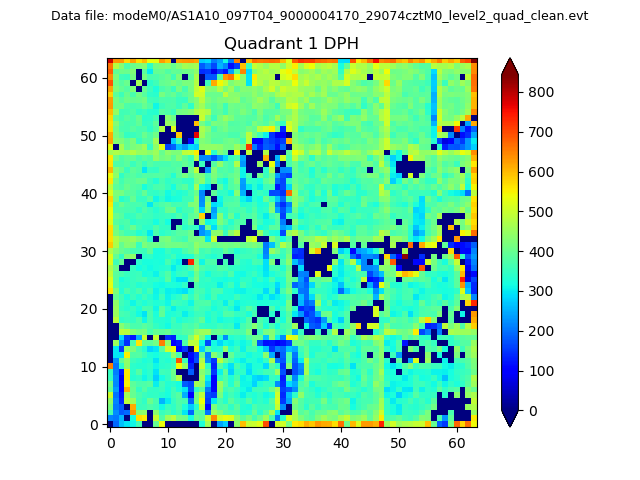 |
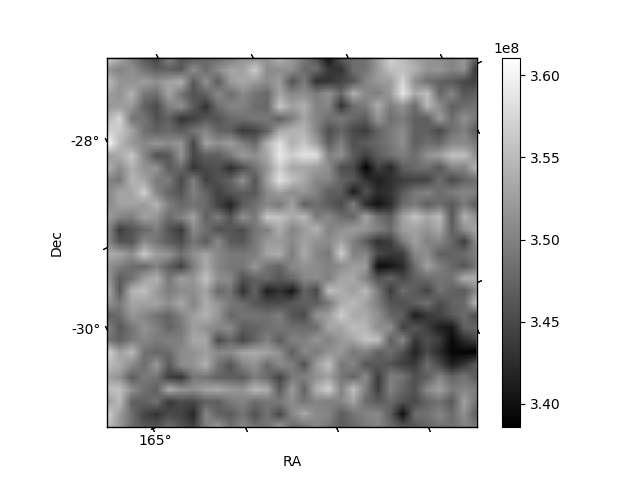
Quadrant B |
|---|---|---|---|
| Quadrant D | 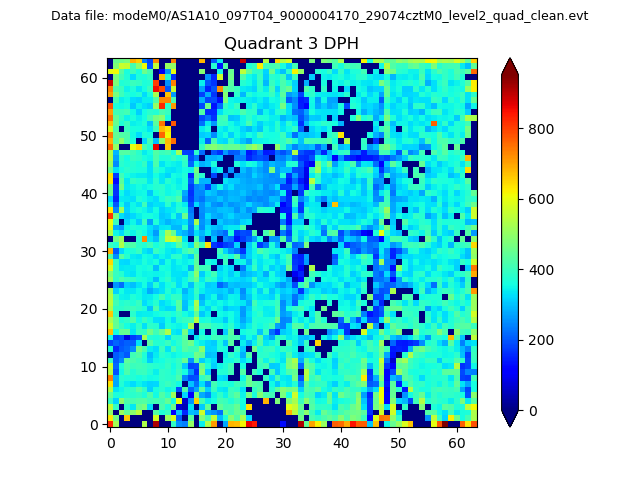 |
 |
Quadrant C |
| Plot type | Count rate plots | Images |
|---|---|---|
| Comparison with Poisson distribution Blue bars denote a histogram of data divided into 1 sec bins. Red curve is a Poisson curve with rate = median count rate of data. |
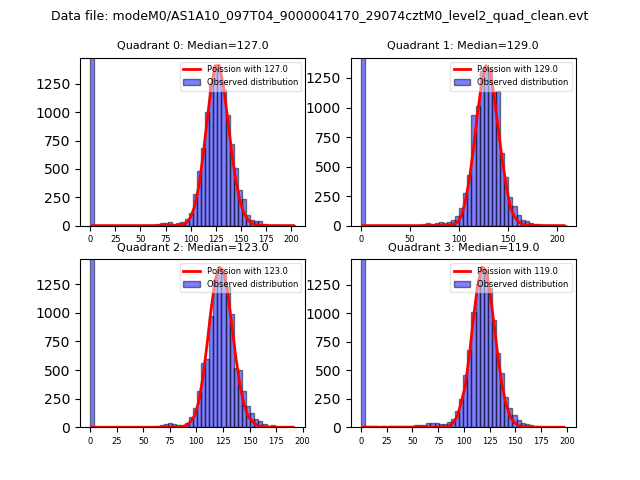 |
 |
| Quadrant-wise count rates Data is divided into 100 sec bins |
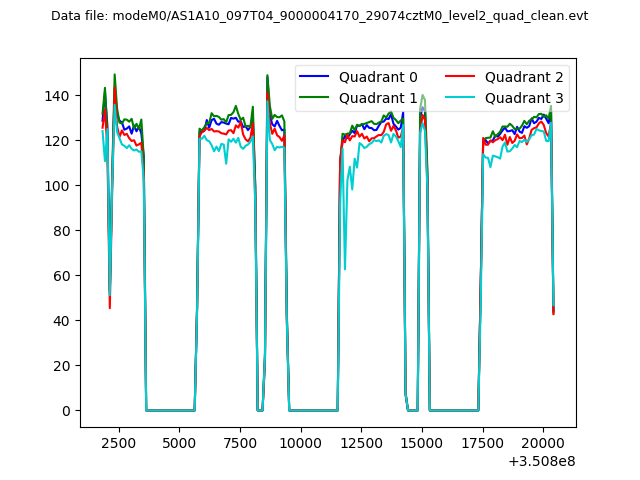 |
|
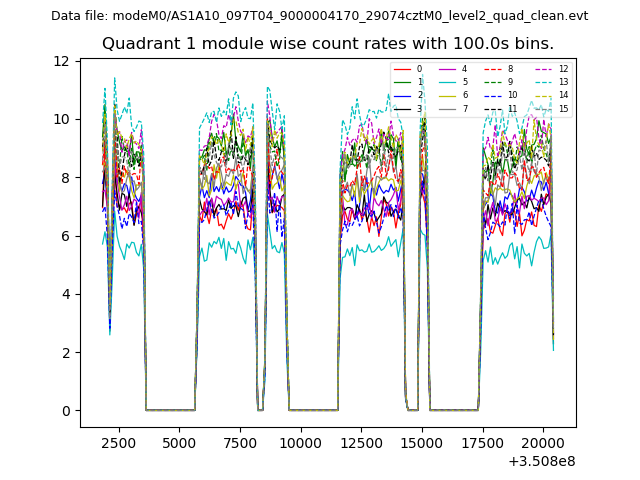
| Module-wise count rates for Quadrant A Data is divided into 100 sec bins |
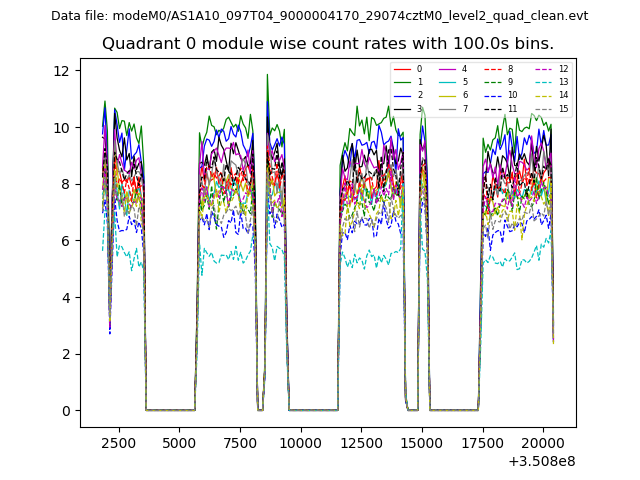 |
 |
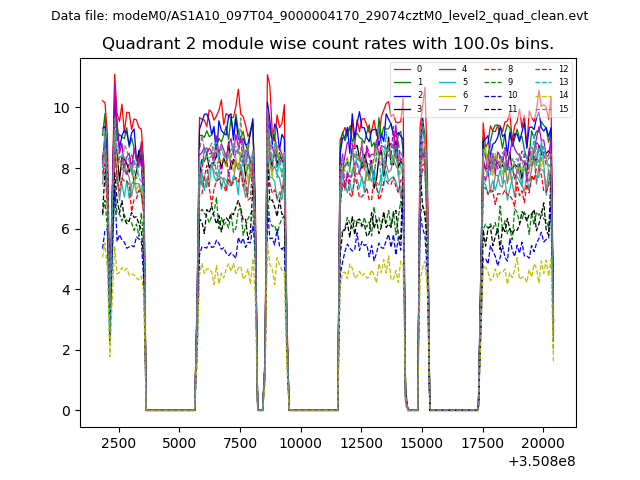
| Module-wise count rates for Quadrant B Data is divided into 100 sec bins |
 |
 |
| Module-wise count rates for Quadrant C Data is divided into 100 sec bins |
 |
 |
| Module-wise count rates for Quadrant D Data is divided into 100 sec bins |
 |
 |
| Parameter | Plot |
|---|---|
| CZT HV Monitor | 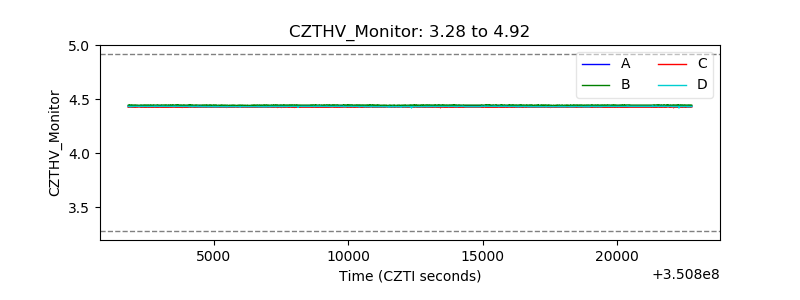 |
| D_VDD | 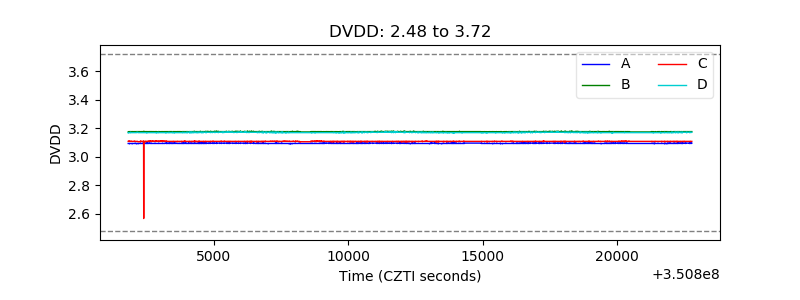 |
| Temperature 1 |  |
| Veto HV Monitor | 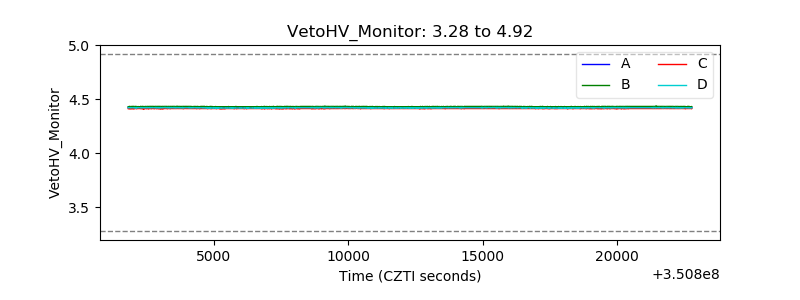 |
| Veto LLD | 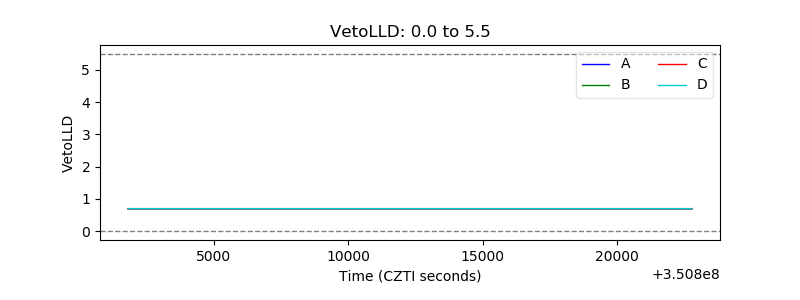 |
| Alpha Counter | 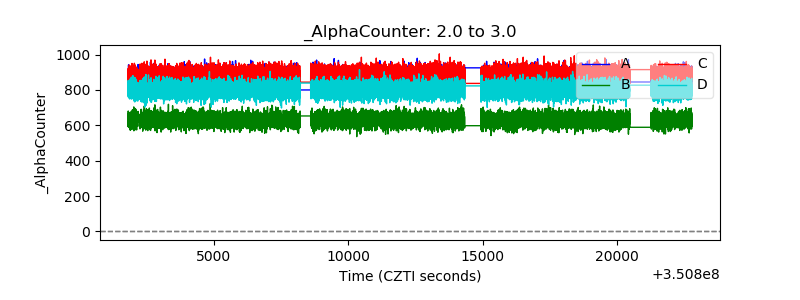 |
| _CPM_Rate | 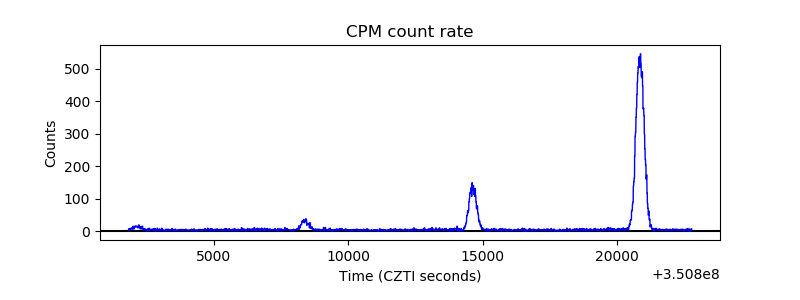 |
| CZT Counter | 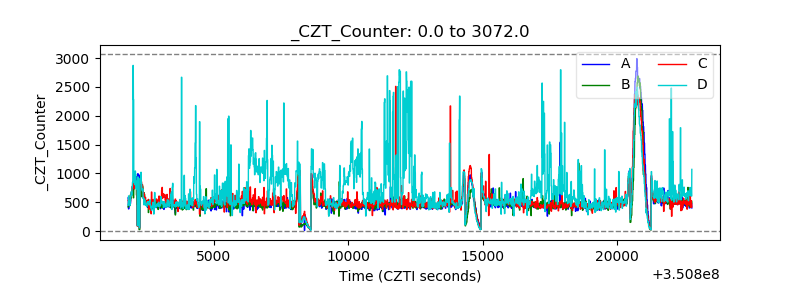 |
| +2.5 Volts monitor |  |
| +5 Volts monitor |  |
| _ROLL_ROT | 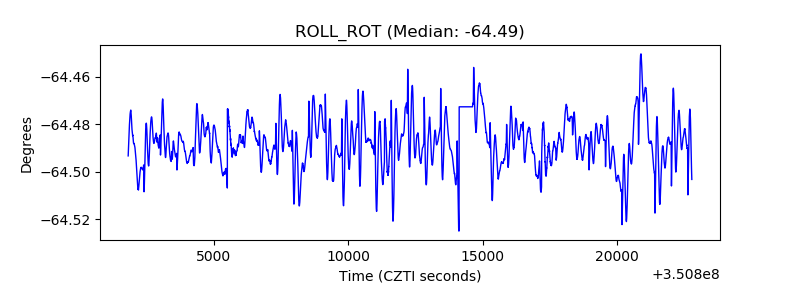 |
| _Roll_DEC | 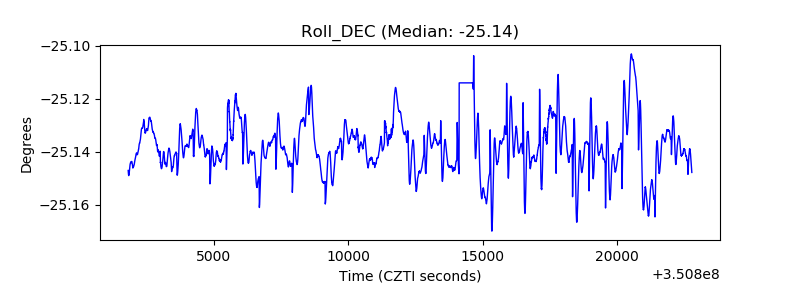 |
| _Roll_RA | 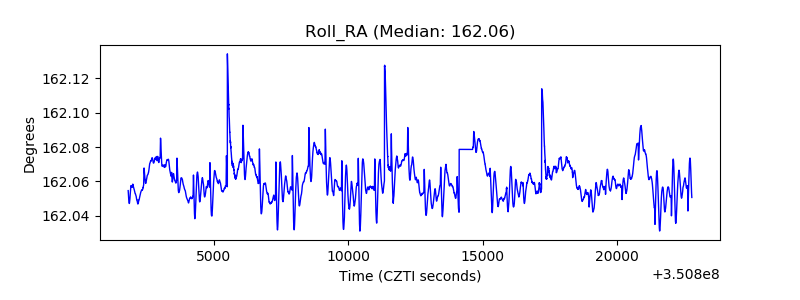 |
| Veto Counter | 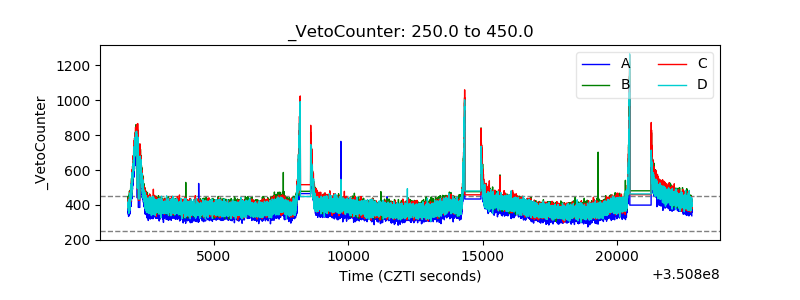 |