| Param | Original file | Final file |
|---|---|---|
| Filename | modeM0/AS1A10_097T04_9000004170_29075cztM0_level2.evt | modeM0/AS1A10_097T04_9000004170_29075cztM0_level2_quad_clean.evt |
| Size (bytes) | 232,801,920 | 25,421,760 |
| Size | 222.0 MB | 24.2 MB |
| Events in quadrant A | 1,506,334 | 137,585 |
| Events in quadrant B | 1,557,720 | 139,610 |
| Events in quadrant C | 1,549,609 | 134,745 |
| Events in quadrant D | 2,218,623 | 130,732 |
| Mode SS | |||
|---|---|---|---|
| Quadrant | BADHDUFLAG | Total packets | Discarded packets |
| A | 0 | 64 | 0 |
| B | 0 | 64 | 0 |
| C | 0 | 64 | 0 |
| D | 0 | 64 | 0 |
| Mode M0 | |||
|---|---|---|---|
| Quadrant | BADHDUFLAG | Total packets | Discarded packets |
| A | 0 | 6512 | 1 |
| B | 0 | 6588 | 1 |
| C | 0 | 6601 | 1 |
| D | 0 | 8909 | 1 |
| Quadrant | Total seconds | Saturated seconds | Saturation percentage |
|---|---|---|---|
| A | 3184 | 10 | 0.314070% |
| B | 3185 | 11 | 0.345369% |
| C | 3185 | 36 | 1.130298% |
| D | 3185 | 66 | 2.072214% |
Noise dominated data is calculated using 1-second bins in cleaned event files. If a bin has >2000 counts, and if more than 50% of those come from <1% of pixels, then it is considered to be noise-dominated and hence unusable.
| Quadrant | # 1 sec bins | Bins with >0 counts | Bins with >2000 counts | High rate bins dominated by noise | Noise dominated (total time) | Noise dominated (detector-on time) | Marked lightcurve |
|---|---|---|---|---|---|---|---|
| A | 3184 | 3184 | 0 | 0 | 0.00% | 0.00% | 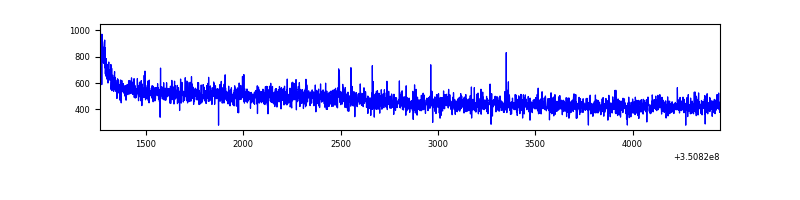 |
| B | 3185 | 3185 | 0 | 0 | 0.00% | 0.00% |  |
| C | 3185 | 3185 | 0 | 0 | 0.00% | 0.00% | 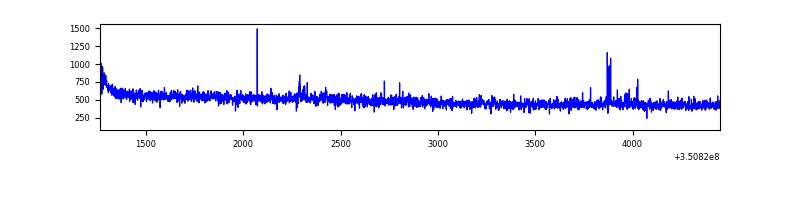 |
| D | 3185 | 3185 | 45 | 45 | 1.41% | 1.41% | 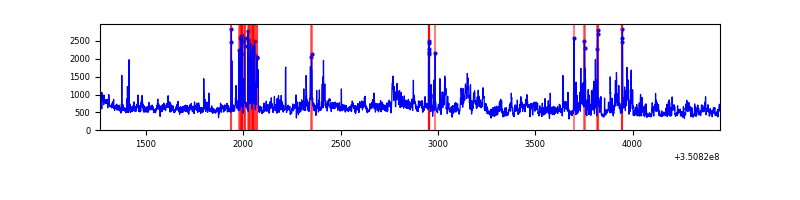 |
Top three noisy pixels from each quadrant. If the there are fewer than three noisy pixels in the level2.evt file, extra rows are filled as -1
| Pixel properties | Quadrant properties | ||||||
|---|---|---|---|---|---|---|---|
| Quadrant | DetID | PixID | Counts | Sigma | Mean | Median | Sigma |
| A | 13 | 254 | 4611 | 52.84 | 389 | 381 | 80.1 |
| A | 3 | 137 | 3978 | 44.93 | 389 | 381 | 80.1 |
| A | 0 | 226 | 3293 | 36.37 | 389 | 381 | 80.1 |
| B | 0 | 190 | 18870 | 244.17 | 386 | 376 | 75.7 |
| B | 10 | 246 | 13772 | 176.86 | 386 | 376 | 75.7 |
| B | 12 | 111 | 9370 | 118.74 | 386 | 376 | 75.7 |
| C | 14 | 238 | 61584 | 692.46 | 374 | 375 | 88.4 |
| C | 2 | 16 | 10080 | 109.79 | 374 | 375 | 88.4 |
| C | 10 | 22 | 9084 | 98.53 | 374 | 375 | 88.4 |
| D | 8 | 195 | 324286 | 3551.69 | 373 | 363 | 91.2 |
| D | 1 | 52 | 291715 | 3194.56 | 373 | 363 | 91.2 |
| D | 7 | 80 | 127693 | 1396.13 | 373 | 363 | 91.2 |
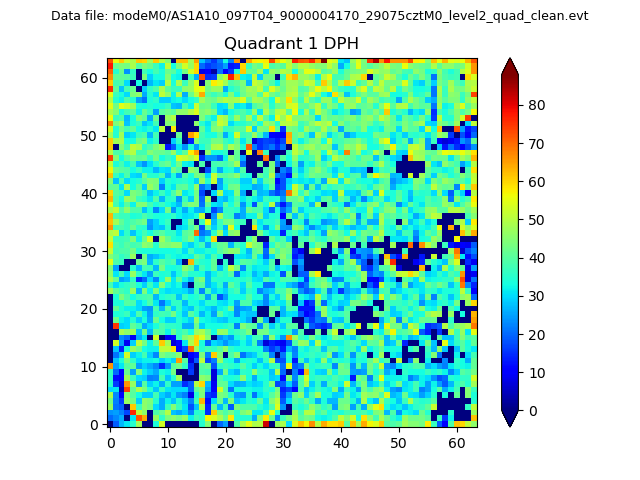
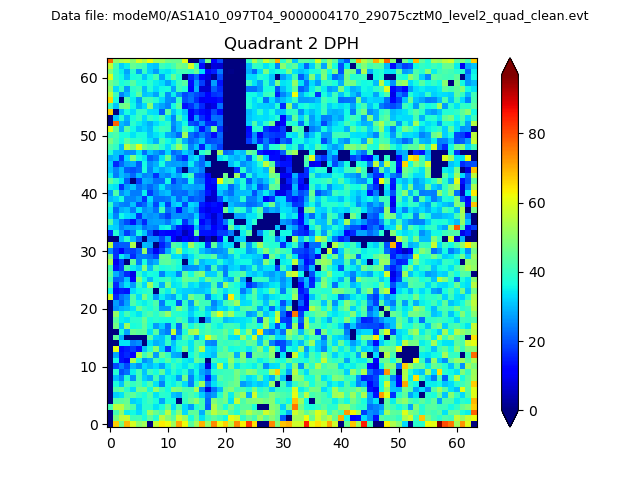
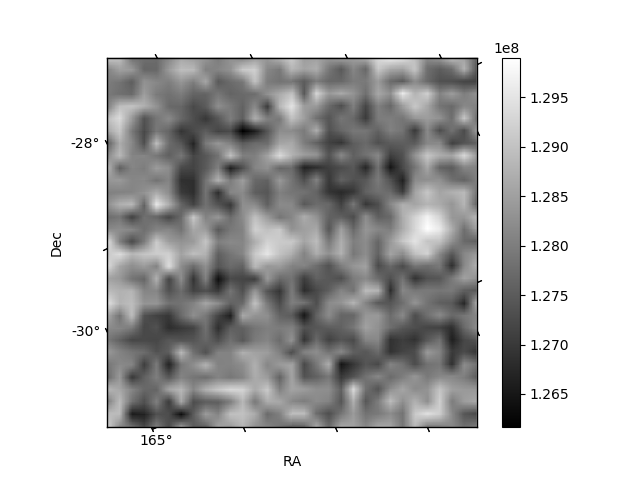
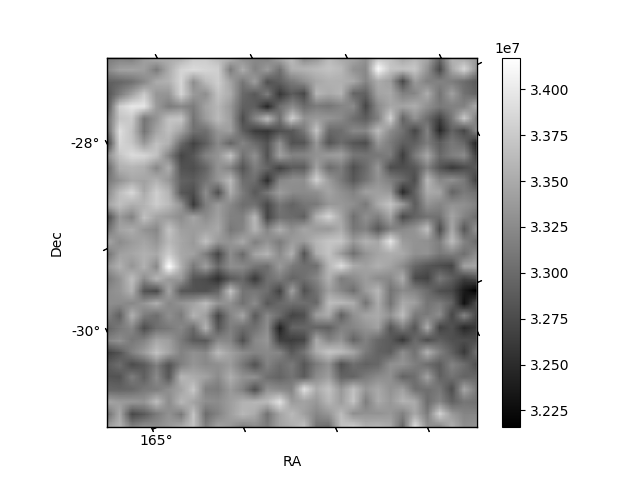
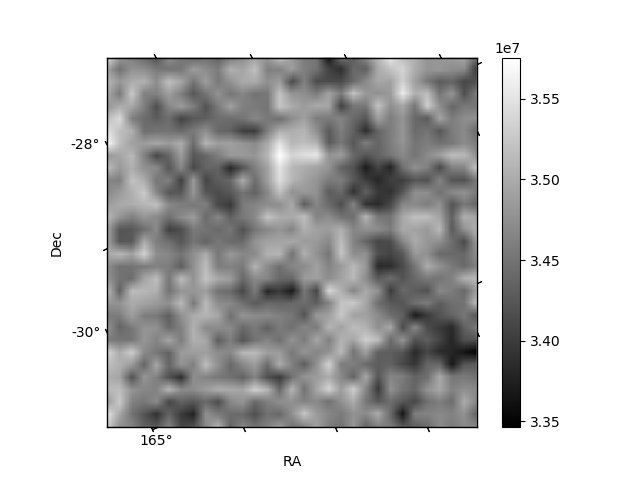
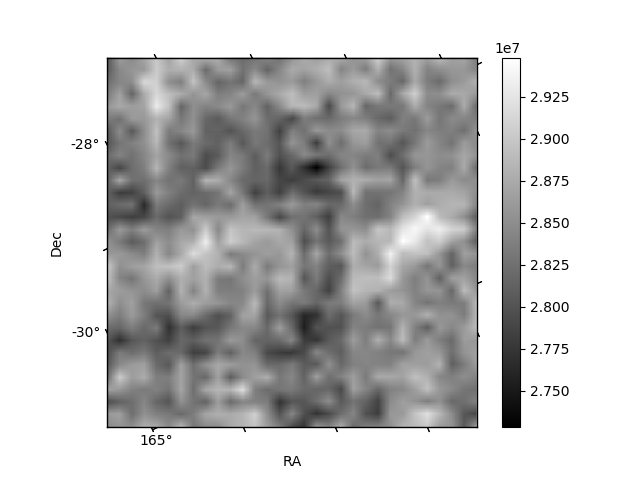
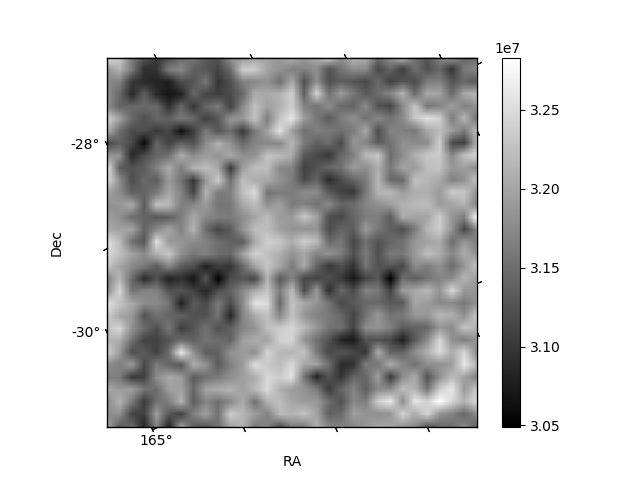
Histogram calculated using DETX and DETY for each event in the final _common_clean file
| Quadrant A | 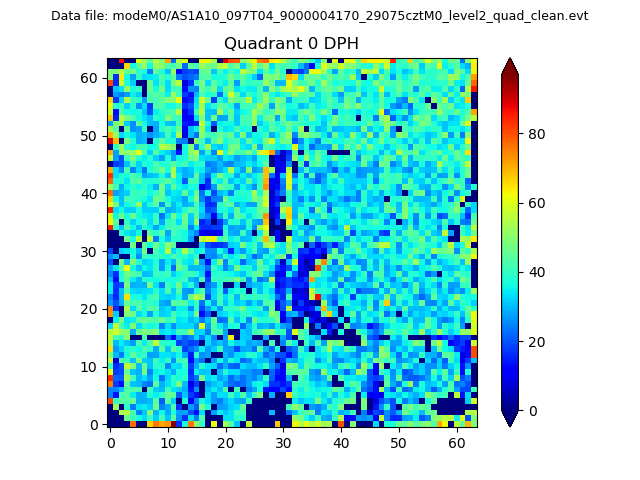 |
 |
Quadrant B |
|---|---|---|---|
| Quadrant D | 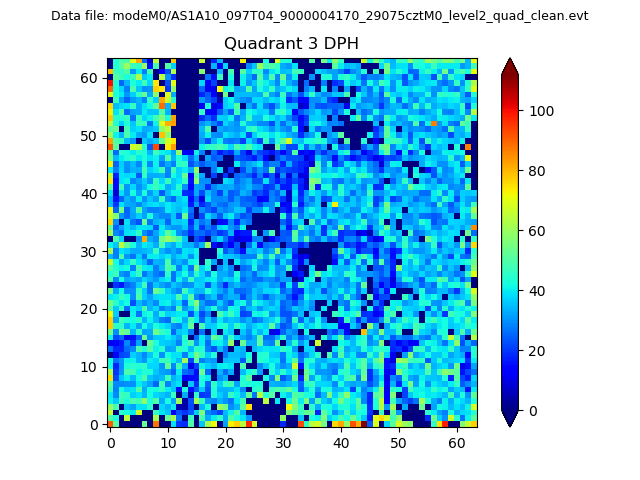 |
 |
Quadrant C |
| Plot type | Count rate plots | Images |
|---|---|---|
| Comparison with Poisson distribution Blue bars denote a histogram of data divided into 1 sec bins. Red curve is a Poisson curve with rate = median count rate of data. |
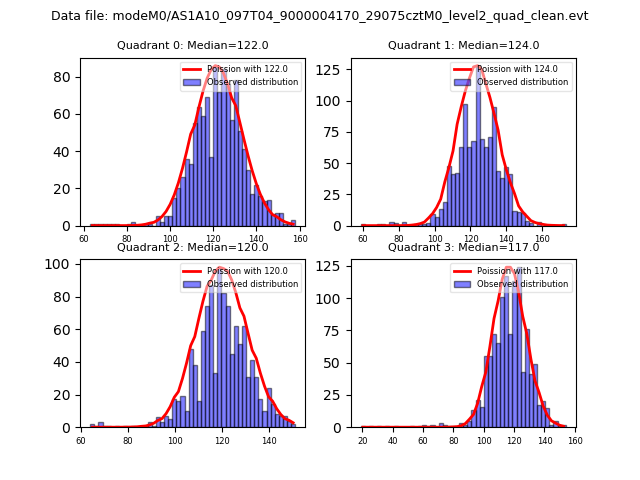 |
 |
| Quadrant-wise count rates Data is divided into 100 sec bins |
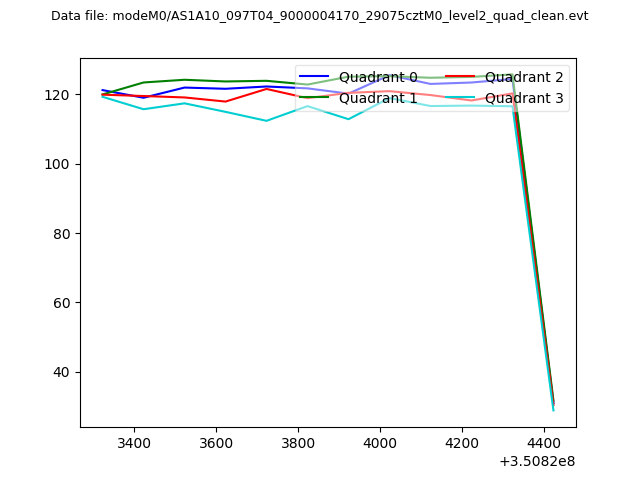 |
|
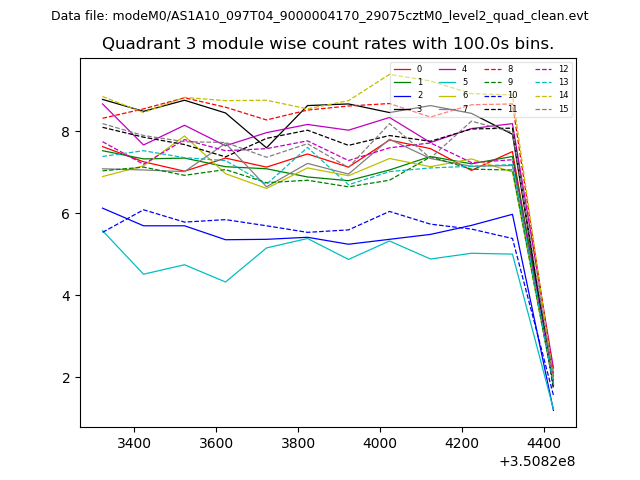
| Module-wise count rates for Quadrant A Data is divided into 100 sec bins |
 |
 |
| Module-wise count rates for Quadrant B Data is divided into 100 sec bins |
 |
 |
| Module-wise count rates for Quadrant C Data is divided into 100 sec bins |
 |
 |
| Module-wise count rates for Quadrant D Data is divided into 100 sec bins |
 |
 |
| Parameter | Plot |
|---|---|
| CZT HV Monitor |  |
| D_VDD | 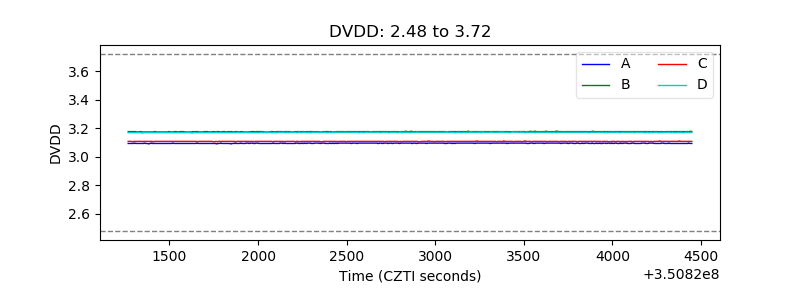 |
| Temperature 1 | 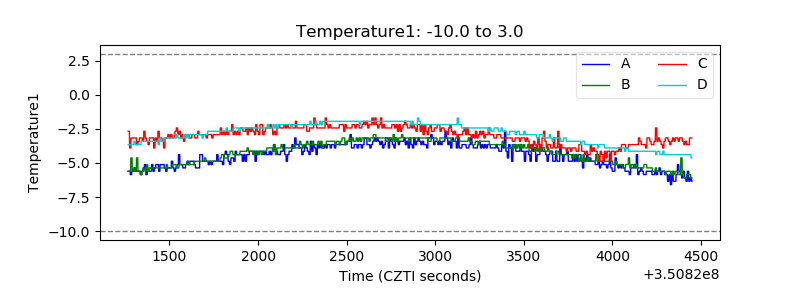 |
| Veto HV Monitor | 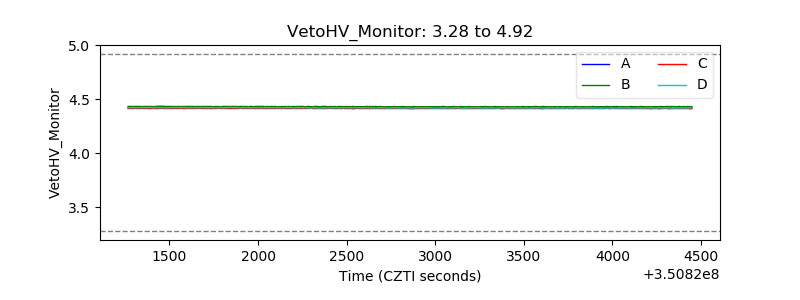 |
| Veto LLD | 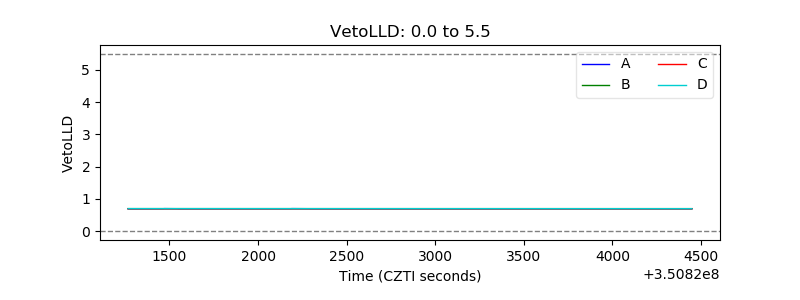 |
| Alpha Counter |  |
| _CPM_Rate | 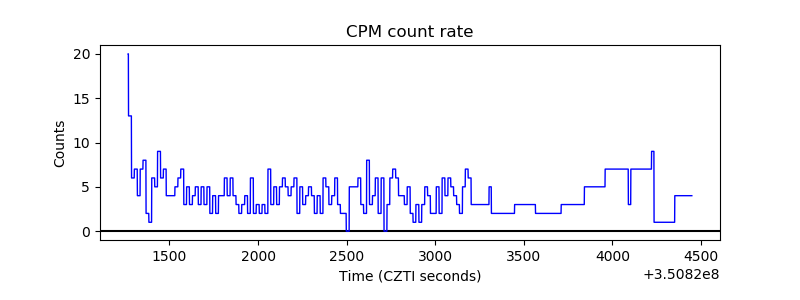 |
| CZT Counter | 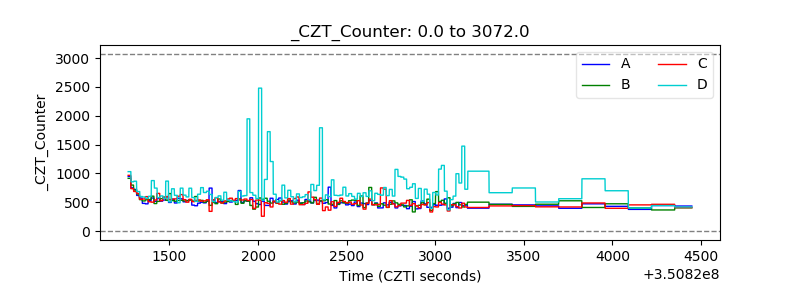 |
| +2.5 Volts monitor |  |
| +5 Volts monitor |  |
| _ROLL_ROT | 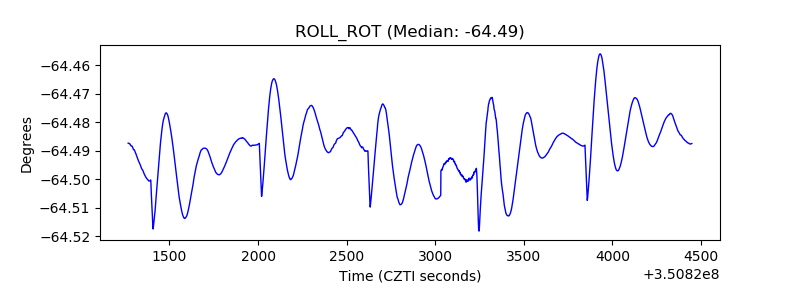 |
| _Roll_DEC | 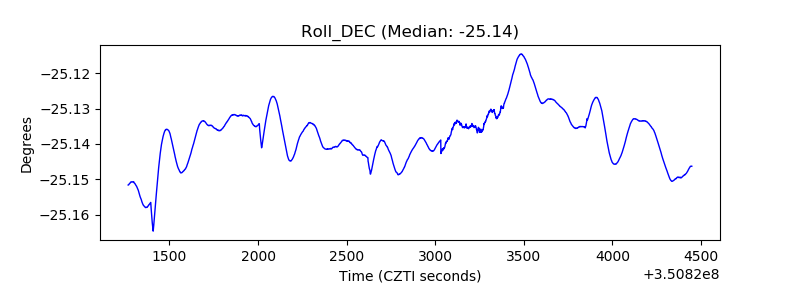 |
| _Roll_RA | 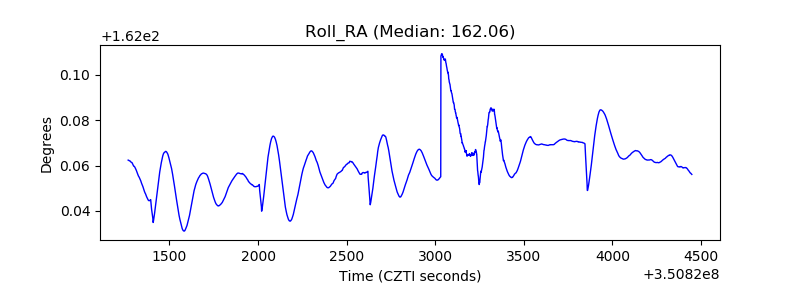 |
| Veto Counter | 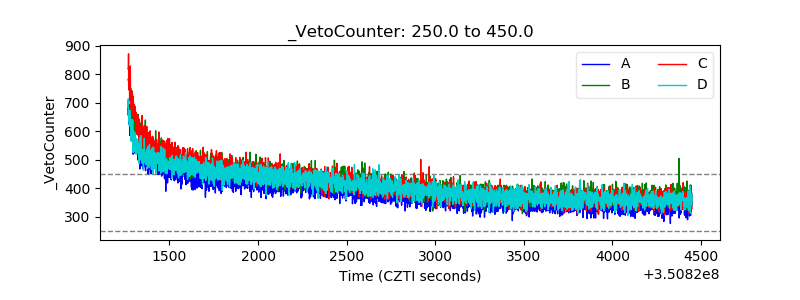 |