| Param | Original file | Final file |
|---|---|---|
| Filename | modeM0/AS1A10_094T17_9000004176_29079cztM0_level2.evt | modeM0/AS1A10_094T17_9000004176_29079cztM0_level2_quad_clean.evt |
| Size (bytes) | 289,252,800 | 60,793,920 |
| Size | 275.9 MB | 58.0 MB |
| Events in quadrant A | 1,389,640 | 439,768 |
| Events in quadrant B | 1,528,816 | 441,109 |
| Events in quadrant C | 1,361,092 | 405,601 |
| Events in quadrant D | 4,282,607 | 347,462 |
| Mode SS | |||
|---|---|---|---|
| Quadrant | BADHDUFLAG | Total packets | Discarded packets |
| A | 0 | 58 | 0 |
| B | 0 | 58 | 0 |
| C | 0 | 58 | 0 |
| D | 0 | 58 | 0 |
| Mode M0 | |||
|---|---|---|---|
| Quadrant | BADHDUFLAG | Total packets | Discarded packets |
| A | 0 | 6015 | 0 |
| B | 0 | 6443 | 0 |
| C | 0 | 5939 | 0 |
| D | 0 | 14750 | 0 |
| Quadrant | Total seconds | Saturated seconds | Saturation percentage |
|---|---|---|---|
| A | 2893 | 1 | 0.034566% |
| B | 2894 | 8 | 0.276434% |
| C | 2894 | 6 | 0.207326% |
| D | 2894 | 752 | 25.984796% |
Noise dominated data is calculated using 1-second bins in cleaned event files. If a bin has >2000 counts, and if more than 50% of those come from <1% of pixels, then it is considered to be noise-dominated and hence unusable.
| Quadrant | # 1 sec bins | Bins with >0 counts | Bins with >2000 counts | High rate bins dominated by noise | Noise dominated (total time) | Noise dominated (detector-on time) | Marked lightcurve |
|---|---|---|---|---|---|---|---|
| A | 2893 | 2893 | 0 | 0 | 0.00% | 0.00% | 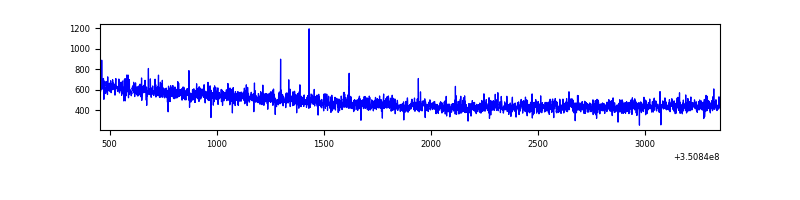 |
| B | 2894 | 2894 | 9 | 9 | 0.31% | 0.31% | 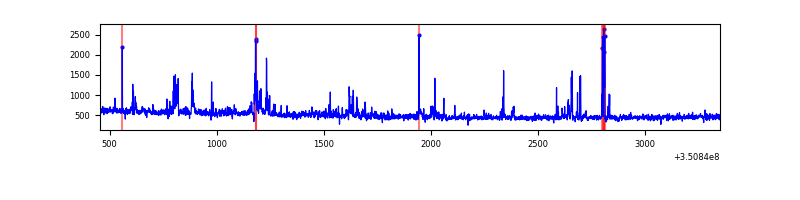 |
| C | 2893 | 2893 | 0 | 0 | 0.00% | 0.00% | 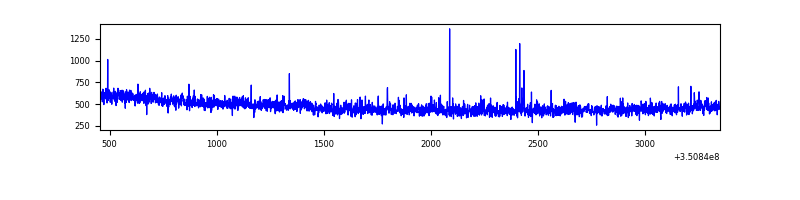 |
| D | 2893 | 2893 | 888 | 888 | 30.69% | 30.69% | 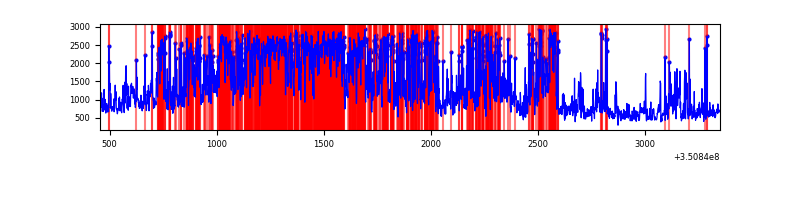 |
Top three noisy pixels from each quadrant. If the there are fewer than three noisy pixels in the level2.evt file, extra rows are filled as -1
| Pixel properties | Quadrant properties | ||||||
|---|---|---|---|---|---|---|---|
| Quadrant | DetID | PixID | Counts | Sigma | Mean | Median | Sigma |
| A | 13 | 254 | 5794 | 74.31 | 358 | 352 | 73.2 |
| A | 6 | 16 | 4960 | 62.93 | 358 | 352 | 73.2 |
| A | 0 | 226 | 3140 | 38.07 | 358 | 352 | 73.2 |
| B | 5 | 172 | 57987 | 863.54 | 355 | 348 | 66.7 |
| B | 5 | 255 | 38181 | 566.81 | 355 | 348 | 66.7 |
| B | 3 | 209 | 12759 | 185.94 | 355 | 348 | 66.7 |
| C | 14 | 238 | 54350 | 705.89 | 328 | 330 | 76.5 |
| C | 2 | 16 | 16987 | 217.66 | 328 | 330 | 76.5 |
| C | 2 | 114 | 6995 | 87.09 | 328 | 330 | 76.5 |
| D | 1 | 52 | 2092731 | 28533.87 | 302 | 293 | 73.3 |
| D | 8 | 195 | 532428 | 7256.54 | 302 | 293 | 73.3 |
| D | 7 | 69 | 303677 | 4137.14 | 302 | 293 | 73.3 |
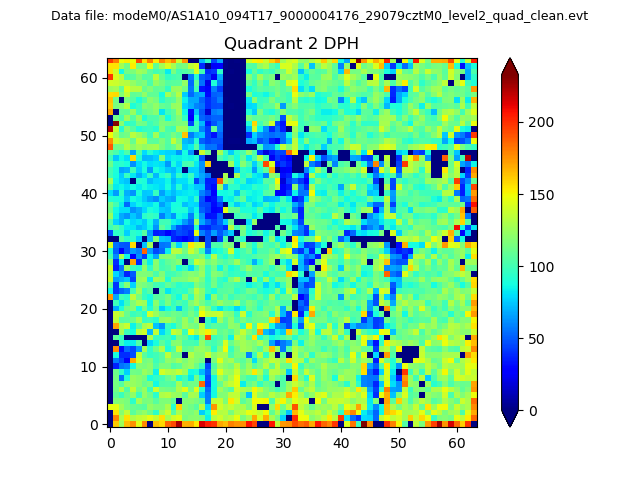
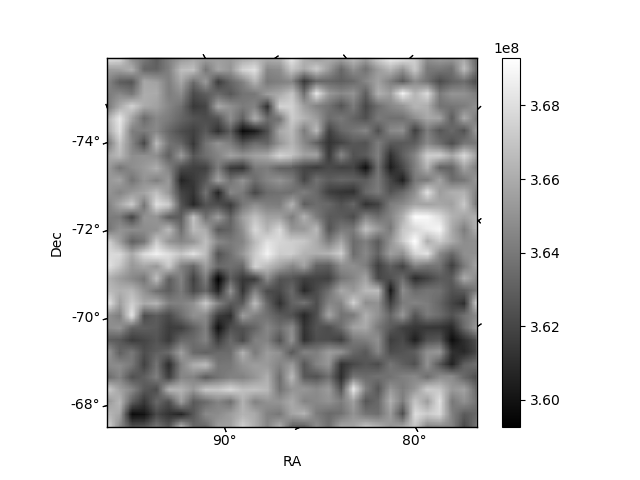
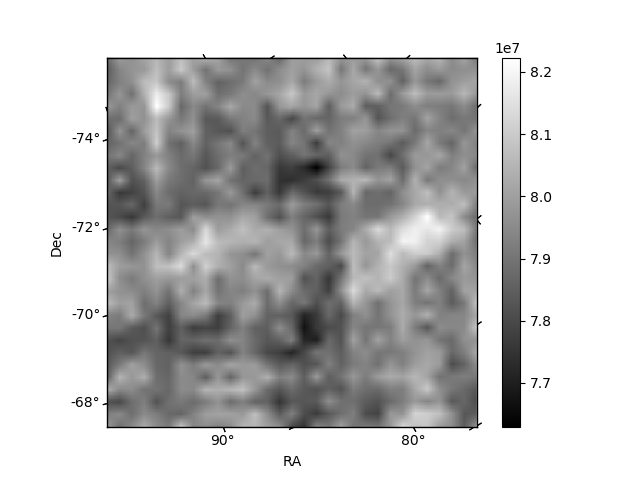
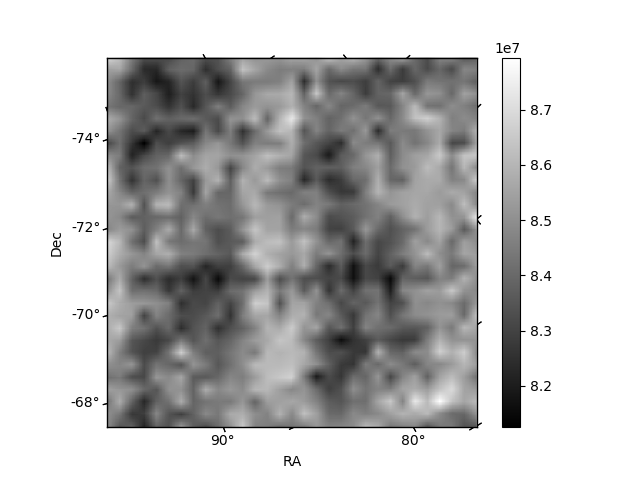
Histogram calculated using DETX and DETY for each event in the final _common_clean file
| Quadrant A | 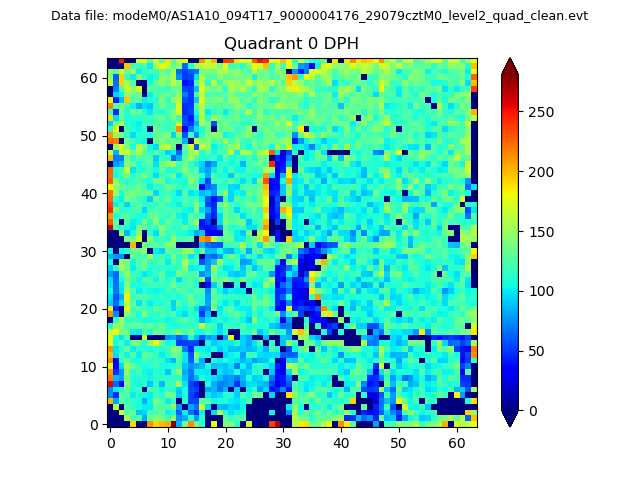 |
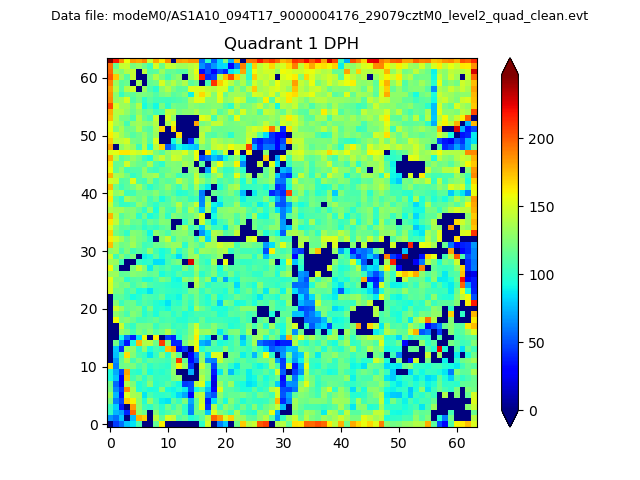 |
Quadrant B |
|---|---|---|---|
| Quadrant D | 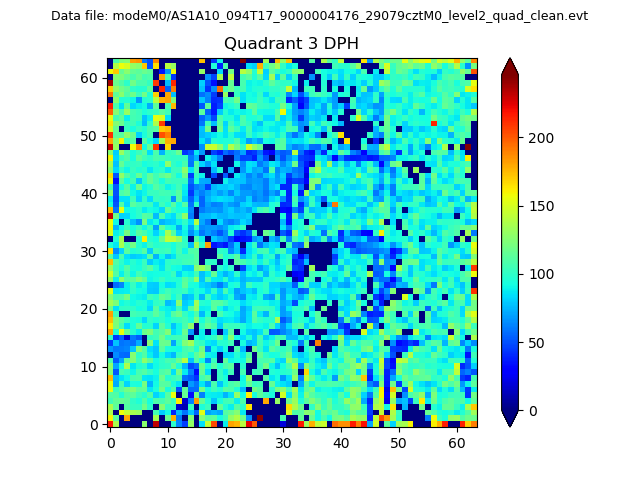 |
 |
Quadrant C |
| Plot type | Count rate plots | Images |
|---|---|---|
| Comparison with Poisson distribution Blue bars denote a histogram of data divided into 1 sec bins. Red curve is a Poisson curve with rate = median count rate of data. |
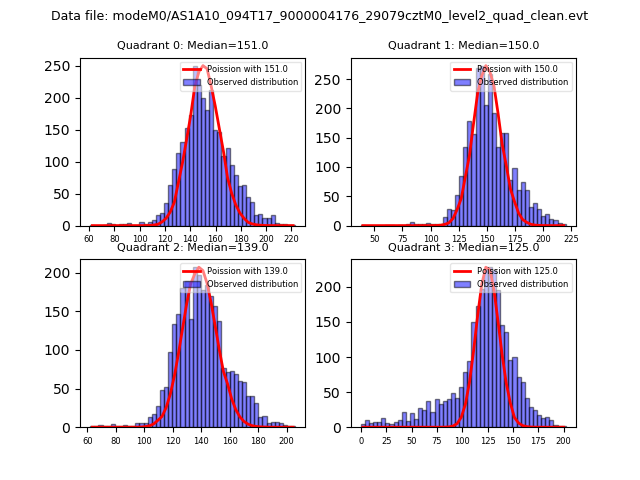 |
 |
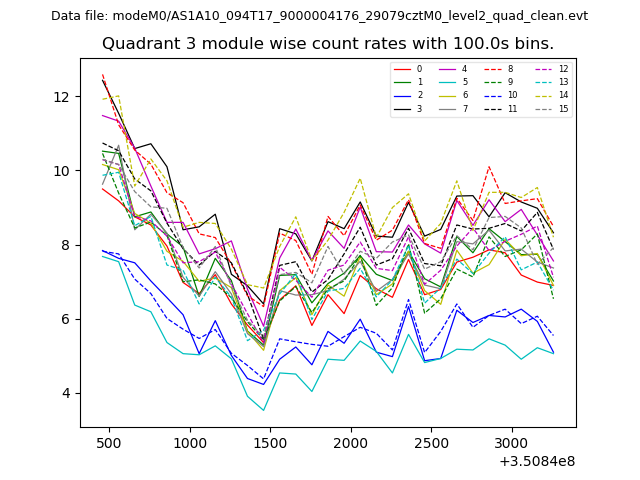
| Quadrant-wise count rates Data is divided into 100 sec bins |
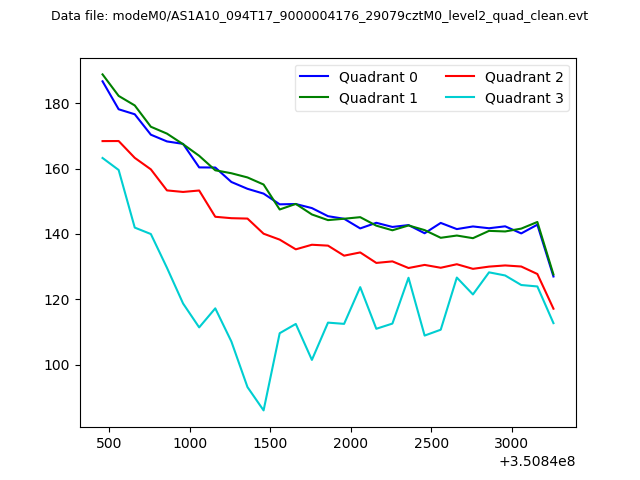 |
|
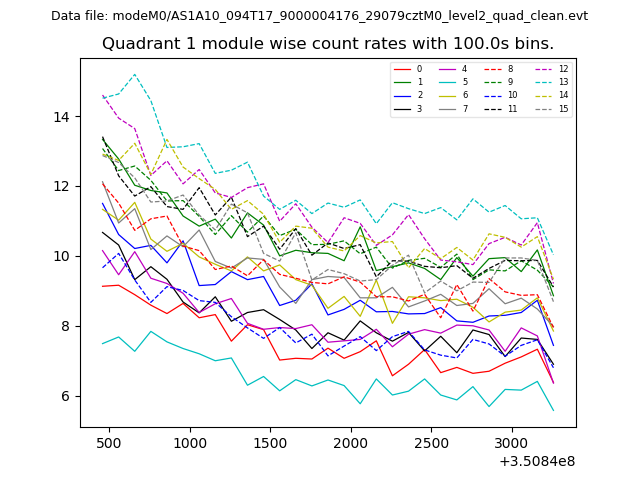
| Module-wise count rates for Quadrant A Data is divided into 100 sec bins |
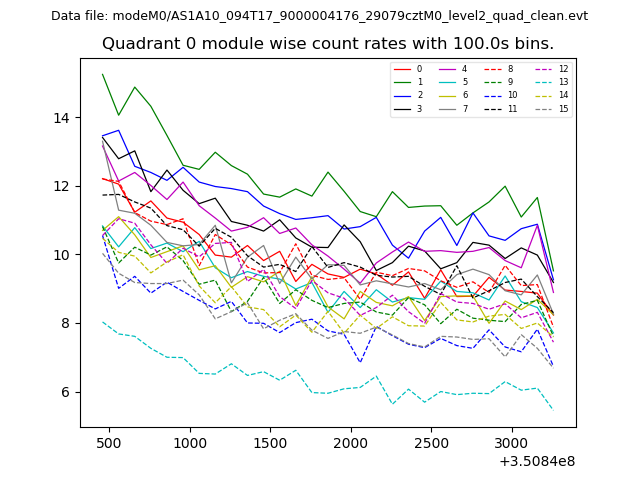 |
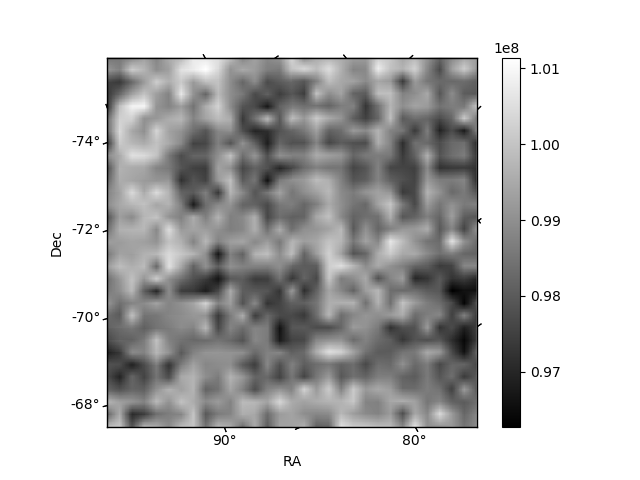 |
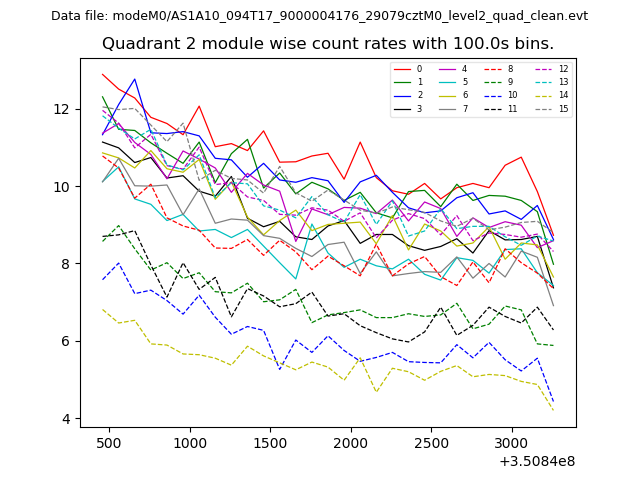
| Module-wise count rates for Quadrant B Data is divided into 100 sec bins |
 |
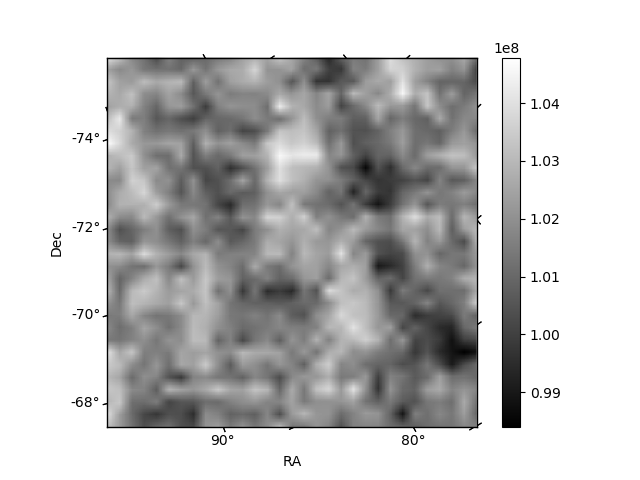 |
| Module-wise count rates for Quadrant C Data is divided into 100 sec bins |
 |
 |
| Module-wise count rates for Quadrant D Data is divided into 100 sec bins |
 |
 |
| Parameter | Plot |
|---|---|
| CZT HV Monitor | 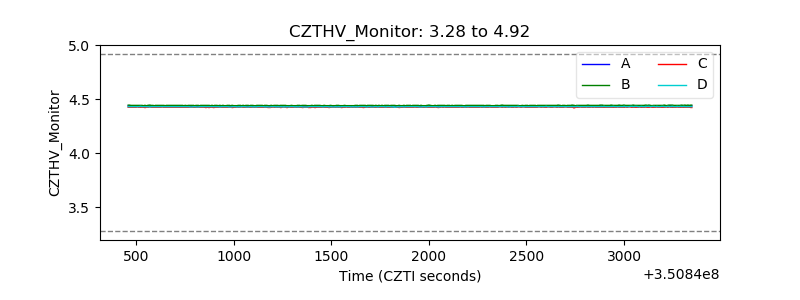 |
| D_VDD | 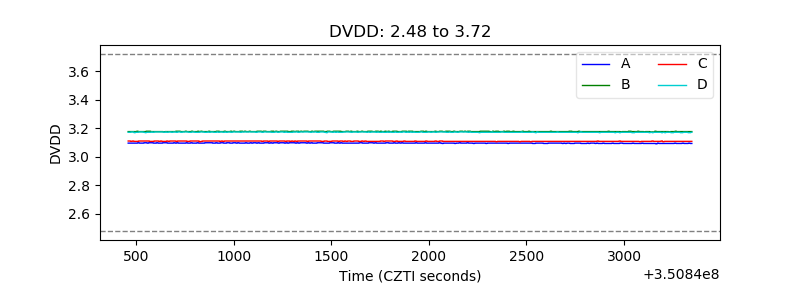 |
| Temperature 1 | 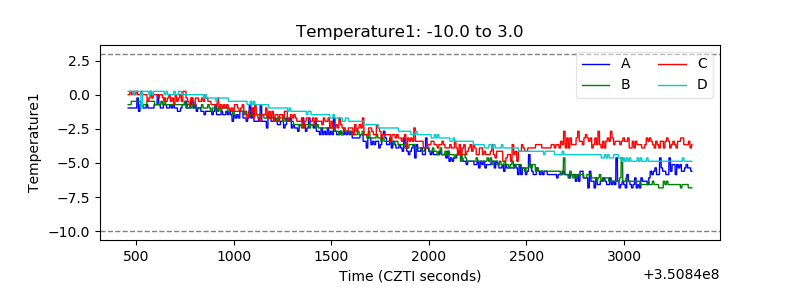 |
| Veto HV Monitor | 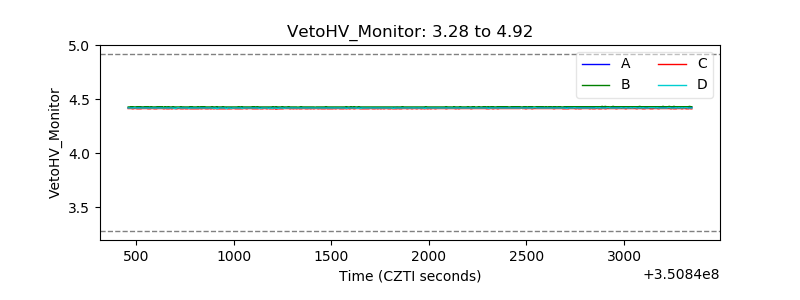 |
| Veto LLD | 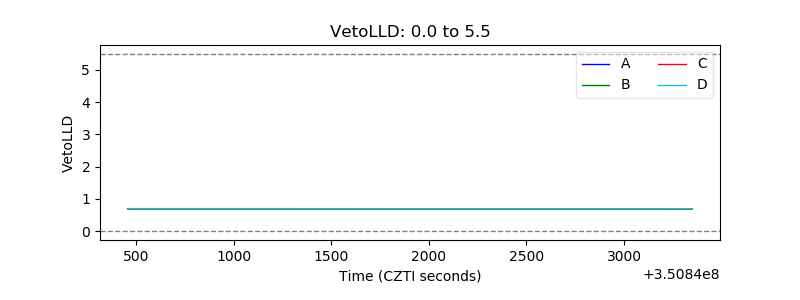 |
| Alpha Counter | 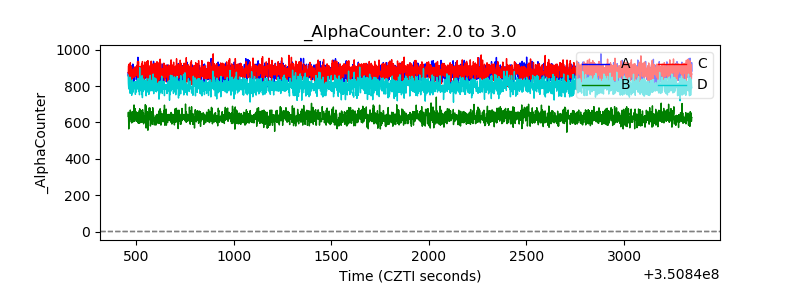 |
| _CPM_Rate | 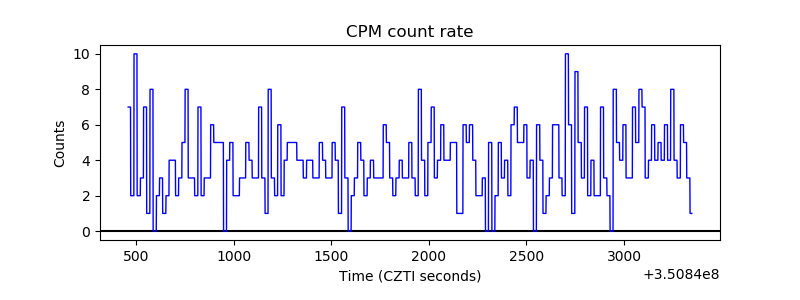 |
| CZT Counter | 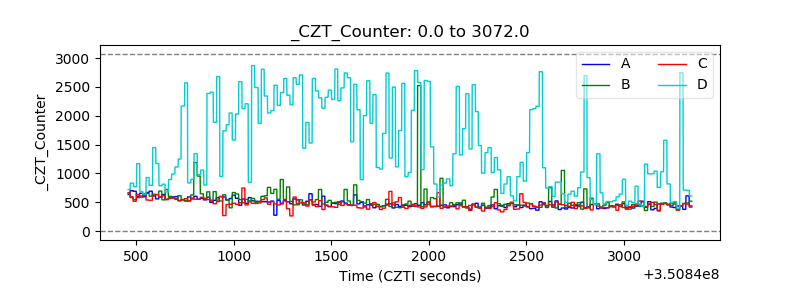 |
| +2.5 Volts monitor |  |
| +5 Volts monitor |  |
| _ROLL_ROT | 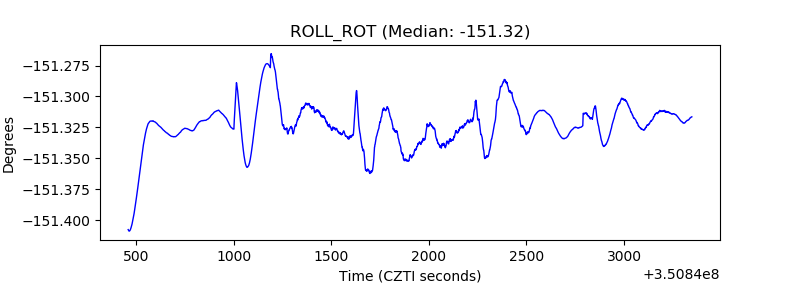 |
| _Roll_DEC | 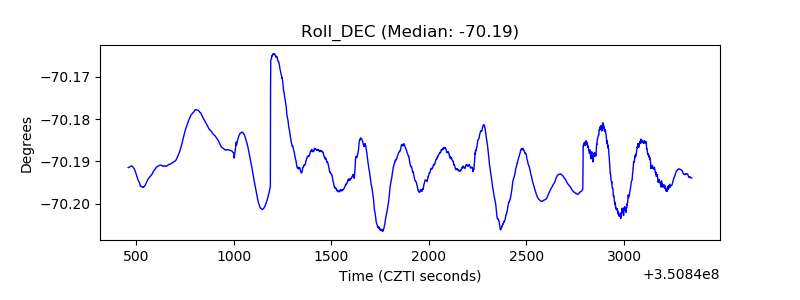 |
| _Roll_RA | 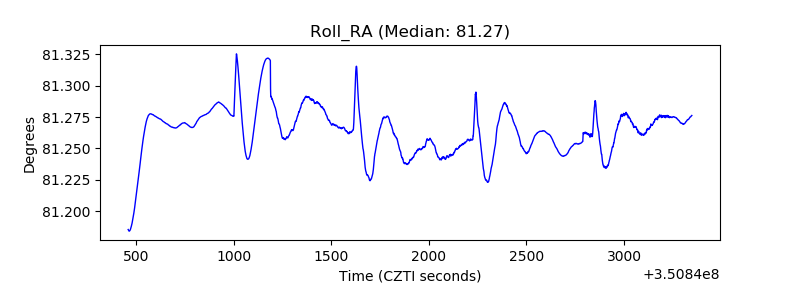 |
| Veto Counter | 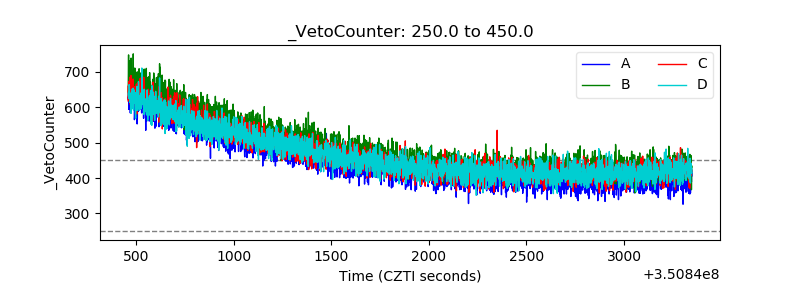 |