| Param | Original file | Final file |
|---|---|---|
| Filename | modeM0/AS1A10_094T18_9000004174_29077cztM0_level2.evt | modeM0/AS1A10_094T18_9000004174_29077cztM0_level2_quad_clean.evt |
| Size (bytes) | 198,192,960 | 48,274,560 |
| Size | 189.0 MB | 46.0 MB |
| Events in quadrant A | 1,205,541 | 340,967 |
| Events in quadrant B | 1,233,922 | 344,721 |
| Events in quadrant C | 1,177,860 | 319,994 |
| Events in quadrant D | 2,235,133 | 298,502 |
| Mode M0 | |||
|---|---|---|---|
| Quadrant | BADHDUFLAG | Total packets | Discarded packets |
| A | 0 | 5003 | 1 |
| B | 0 | 5052 | 1 |
| C | 0 | 4837 | 1 |
| D | 0 | 8127 | 1 |
| Mode M9 | |||
|---|---|---|---|
| Quadrant | BADHDUFLAG | Total packets | Discarded packets |
| A | 0 | 11 | 0 |
| B | 0 | 11 | 0 |
| C | 0 | 11 | 0 |
| D | 0 | 11 | 0 |
| Mode SS | |||
|---|---|---|---|
| Quadrant | BADHDUFLAG | Total packets | Discarded packets |
| A | 0 | 46 | 0 |
| B | 0 | 46 | 0 |
| C | 0 | 46 | 0 |
| D | 0 | 46 | 0 |
| Quadrant | Total seconds | Saturated seconds | Saturation percentage |
|---|---|---|---|
| A | 2175 | 47 | 2.160920% |
| B | 2175 | 54 | 2.482759% |
| C | 2175 | 58 | 2.666667% |
| D | 2175 | 255 | 11.724138% |
Noise dominated data is calculated using 1-second bins in cleaned event files. If a bin has >2000 counts, and if more than 50% of those come from <1% of pixels, then it is considered to be noise-dominated and hence unusable.
| Quadrant | # 1 sec bins | Bins with >0 counts | Bins with >2000 counts | High rate bins dominated by noise | Noise dominated (total time) | Noise dominated (detector-on time) | Marked lightcurve |
|---|---|---|---|---|---|---|---|
| A | 3296 | 2175 | 0 | 0 | 0.00% | 0.00% | 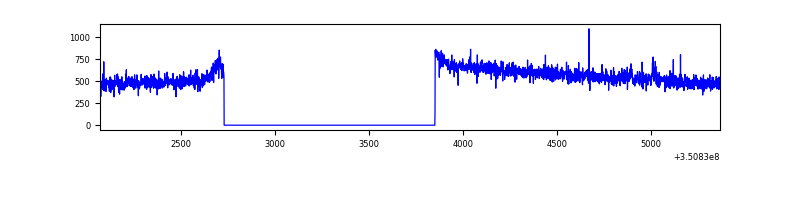 |
| B | 3295 | 2174 | 1 | 1 | 0.03% | 0.05% | 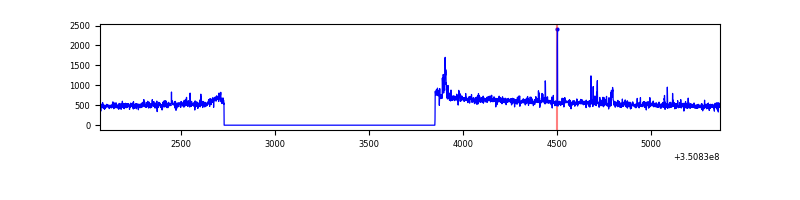 |
| C | 3296 | 2175 | 0 | 0 | 0.00% | 0.00% | 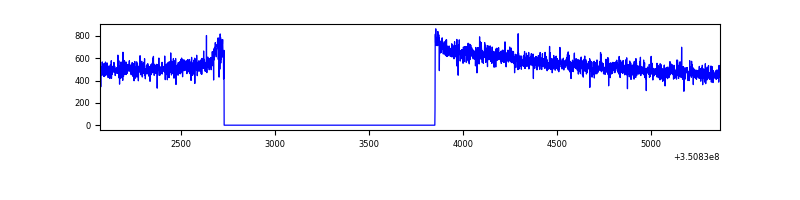 |
| D | 3296 | 2175 | 182 | 182 | 5.52% | 8.37% | 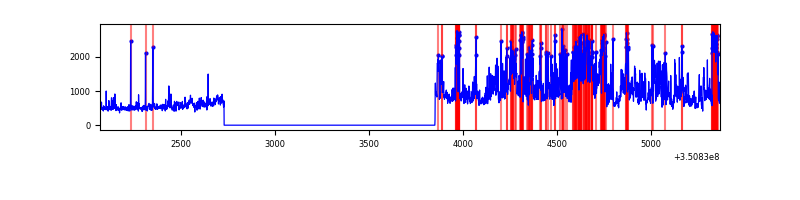 |
Top three noisy pixels from each quadrant. If the there are fewer than three noisy pixels in the level2.evt file, extra rows are filled as -1
| Pixel properties | Quadrant properties | ||||||
|---|---|---|---|---|---|---|---|
| Quadrant | DetID | PixID | Counts | Sigma | Mean | Median | Sigma |
| A | 15 | 174 | 6333 | 95.17 | 310 | 304 | 63.4 |
| A | 13 | 254 | 4078 | 59.57 | 310 | 304 | 63.4 |
| A | 3 | 137 | 2923 | 41.34 | 310 | 304 | 63.4 |
| B | 5 | 255 | 15318 | 257.76 | 303 | 296 | 58.3 |
| B | 0 | 190 | 14426 | 242.45 | 303 | 296 | 58.3 |
| B | 12 | 111 | 6630 | 108.68 | 303 | 296 | 58.3 |
| C | 14 | 238 | 47023 | 687.58 | 288 | 289 | 68.0 |
| C | 2 | 114 | 5382 | 74.93 | 288 | 289 | 68.0 |
| C | 13 | 61 | 1941 | 24.31 | 288 | 289 | 68.0 |
| D | 1 | 52 | 444140 | 6370.57 | 288 | 279 | 69.7 |
| D | 8 | 195 | 265914 | 3812.55 | 288 | 279 | 69.7 |
| D | 12 | 233 | 145445 | 2083.51 | 288 | 279 | 69.7 |
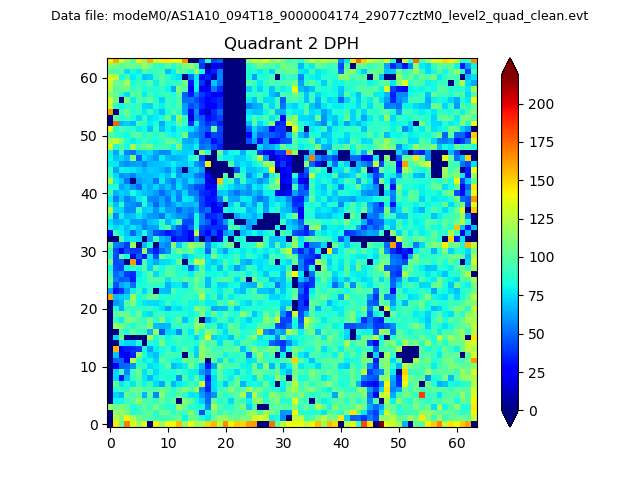
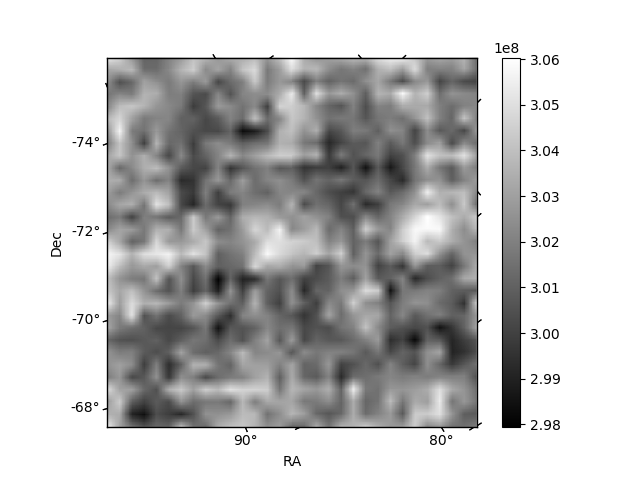
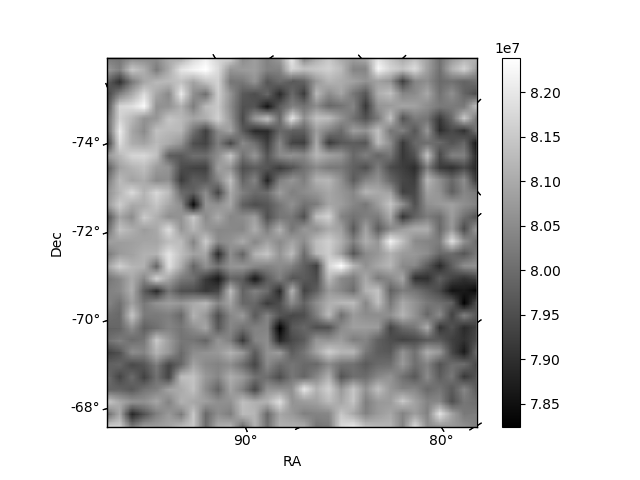
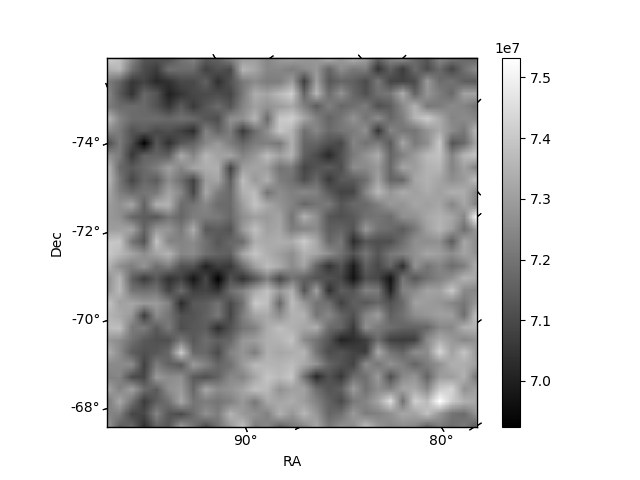
Histogram calculated using DETX and DETY for each event in the final _common_clean file
| Quadrant A | 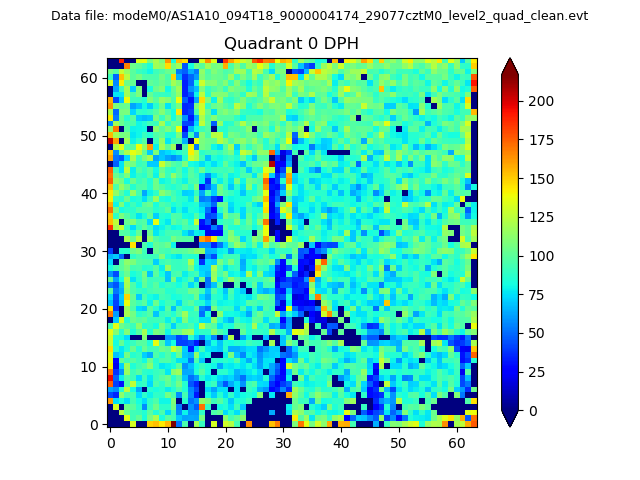 |
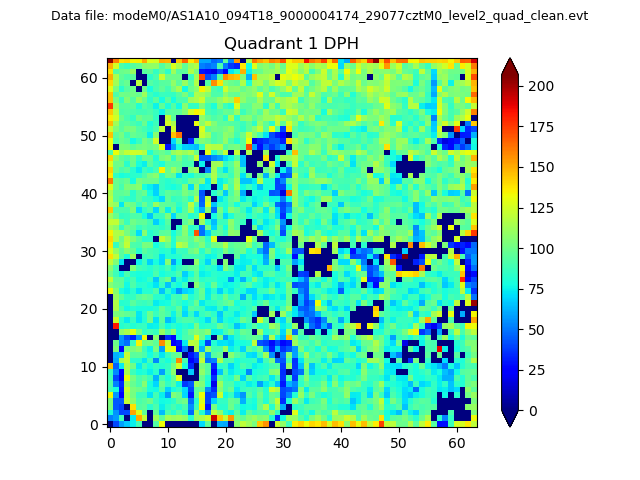 |
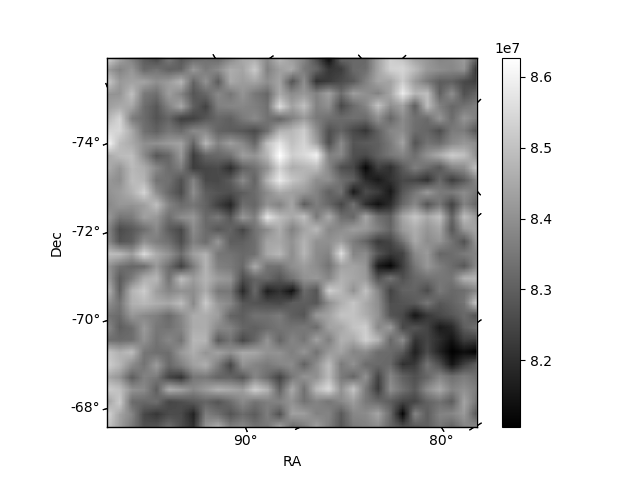
Quadrant B |
|---|---|---|---|
| Quadrant D | 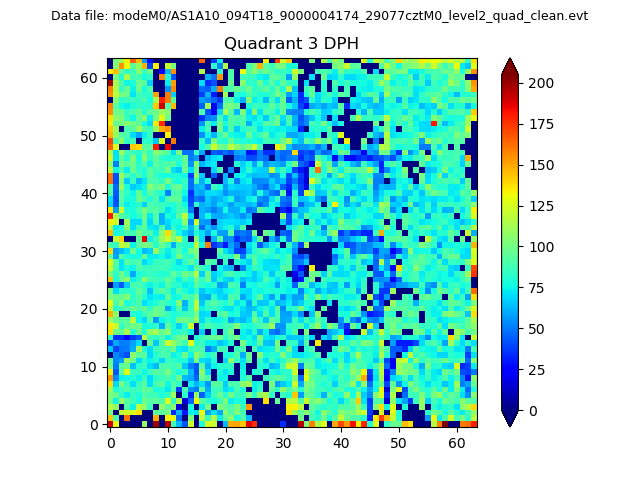 |
 |
Quadrant C |
| Plot type | Count rate plots | Images |
|---|---|---|
| Comparison with Poisson distribution Blue bars denote a histogram of data divided into 1 sec bins. Red curve is a Poisson curve with rate = median count rate of data. |
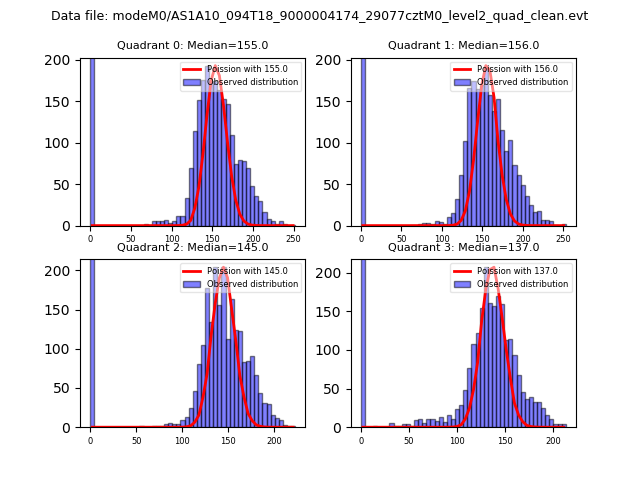 |
 |
| Quadrant-wise count rates Data is divided into 100 sec bins |
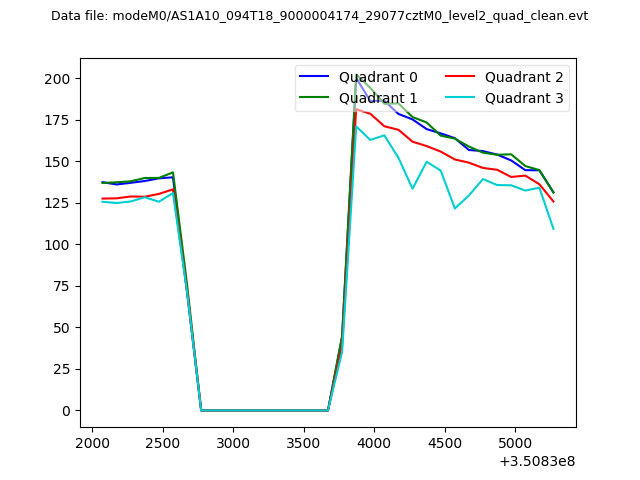 |
|
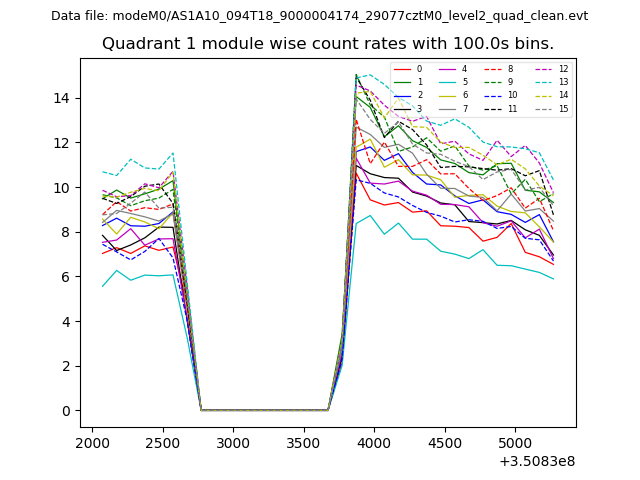
| Module-wise count rates for Quadrant A Data is divided into 100 sec bins |
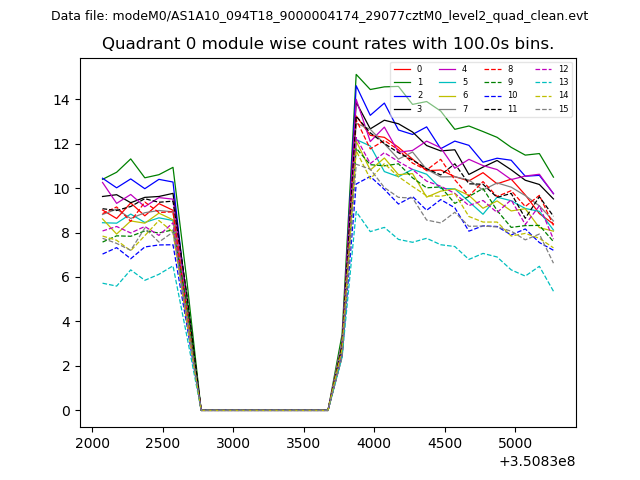 |
 |
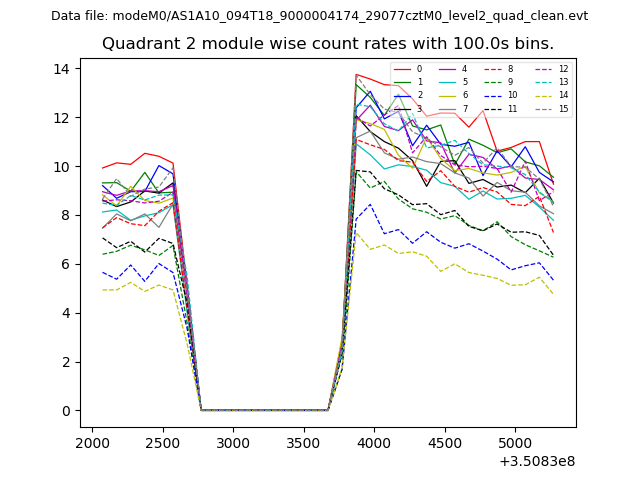
| Module-wise count rates for Quadrant B Data is divided into 100 sec bins |
 |
 |
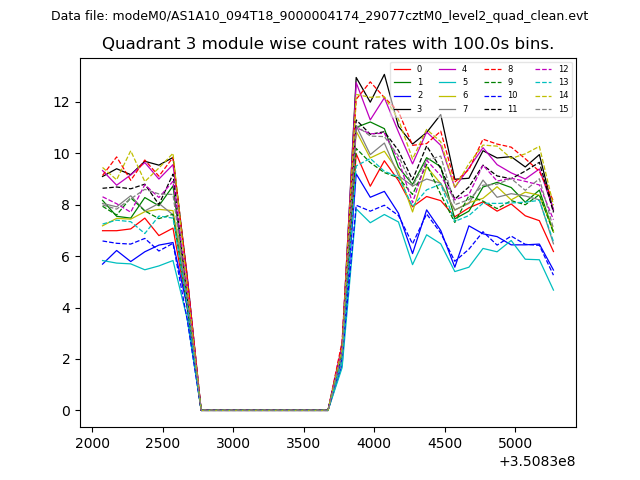
| Module-wise count rates for Quadrant C Data is divided into 100 sec bins |
 |
 |
| Module-wise count rates for Quadrant D Data is divided into 100 sec bins |
 |
 |
| Parameter | Plot |
|---|---|
| CZT HV Monitor |  |
| D_VDD | 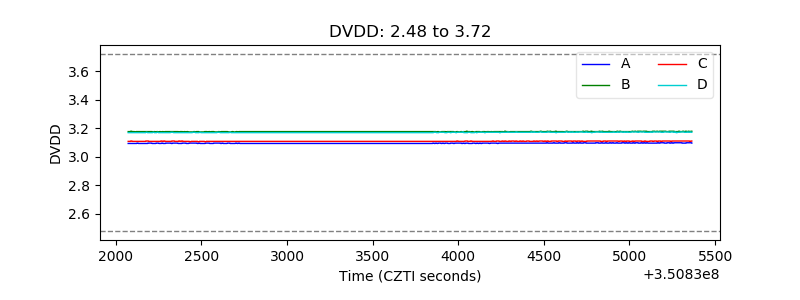 |
| Temperature 1 | 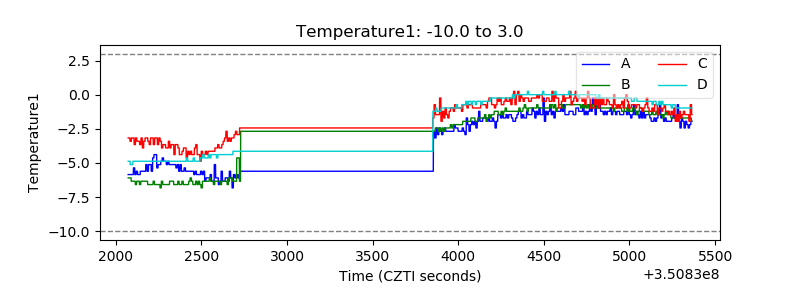 |
| Veto HV Monitor | 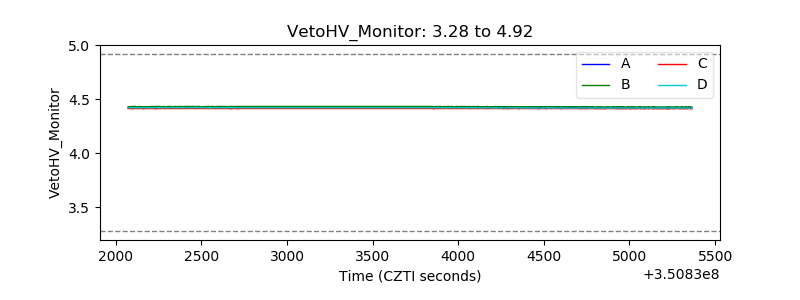 |
| Veto LLD | 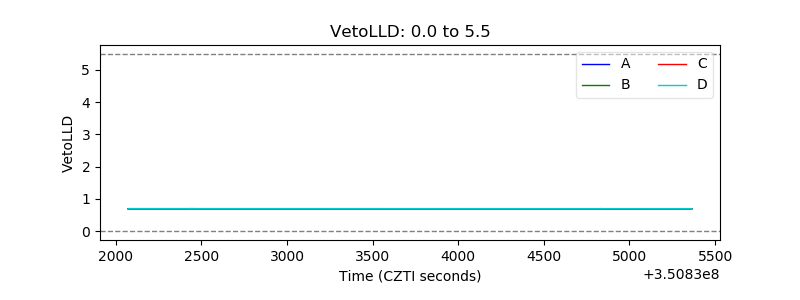 |
| Alpha Counter | 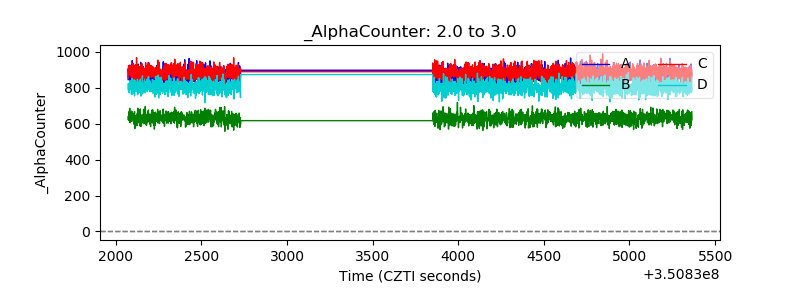 |
| _CPM_Rate | 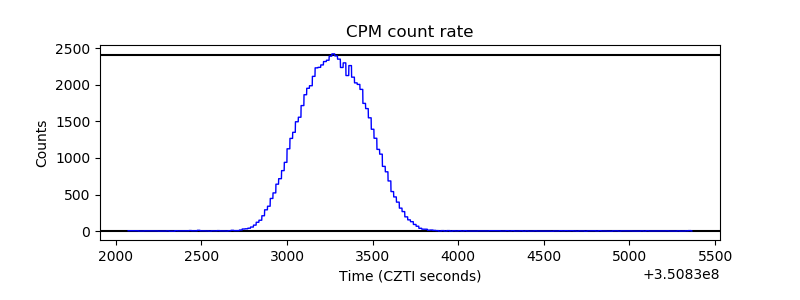 |
| CZT Counter | 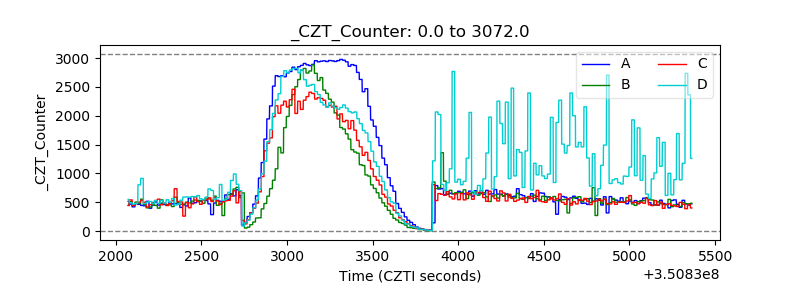 |
| +2.5 Volts monitor |  |
| +5 Volts monitor |  |
| _ROLL_ROT |  |
| _Roll_DEC | 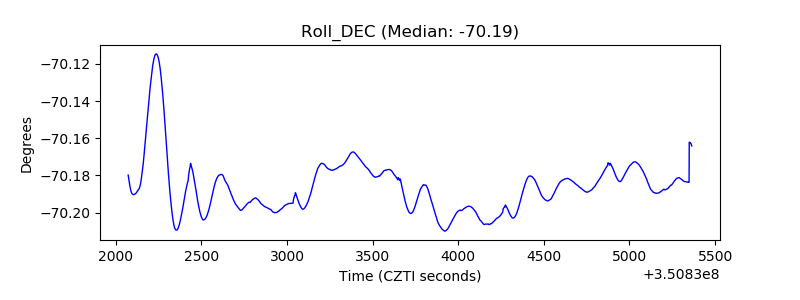 |
| _Roll_RA | 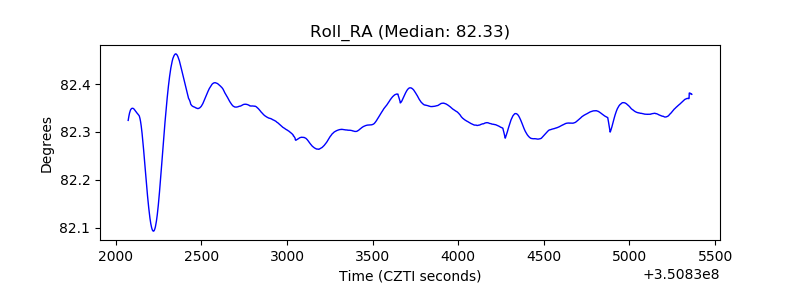 |
| Veto Counter | 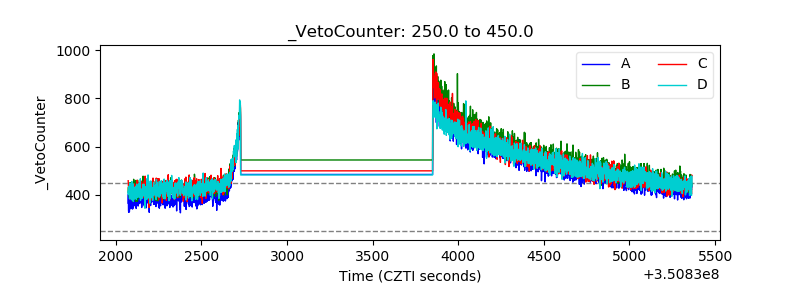 |