| Param | Original file | Final file |
|---|---|---|
| Filename | modeM0/AS1A10_094T18_9000004174_29078cztM0_level2.evt | modeM0/AS1A10_094T18_9000004174_29078cztM0_level2_quad_clean.evt |
| Size (bytes) | 282,150,720 | 68,034,240 |
| Size | 269.1 MB | 64.9 MB |
| Events in quadrant A | 1,553,508 | 476,601 |
| Events in quadrant B | 1,704,294 | 476,958 |
| Events in quadrant C | 1,544,095 | 445,035 |
| Events in quadrant D | 3,509,544 | 419,029 |
| Mode M0 | |||
|---|---|---|---|
| Quadrant | BADHDUFLAG | Total packets | Discarded packets |
| A | 0 | 6905 | 0 |
| B | 0 | 7279 | 0 |
| C | 0 | 6880 | 0 |
| D | 0 | 12762 | 0 |
| Mode SS | |||
|---|---|---|---|
| Quadrant | BADHDUFLAG | Total packets | Discarded packets |
| A | 0 | 68 | 0 |
| B | 0 | 68 | 0 |
| C | 0 | 68 | 0 |
| D | 0 | 68 | 0 |
| Quadrant | Total seconds | Saturated seconds | Saturation percentage |
|---|---|---|---|
| A | 3421 | 2 | 0.058462% |
| B | 3421 | 32 | 0.935399% |
| C | 3421 | 8 | 0.233850% |
| D | 3421 | 281 | 8.213973% |
Noise dominated data is calculated using 1-second bins in cleaned event files. If a bin has >2000 counts, and if more than 50% of those come from <1% of pixels, then it is considered to be noise-dominated and hence unusable.
| Quadrant | # 1 sec bins | Bins with >0 counts | Bins with >2000 counts | High rate bins dominated by noise | Noise dominated (total time) | Noise dominated (detector-on time) | Marked lightcurve |
|---|---|---|---|---|---|---|---|
| A | 3420 | 3420 | 0 | 0 | 0.00% | 0.00% |  |
| B | 3420 | 3420 | 20 | 20 | 0.58% | 0.58% |  |
| C | 3421 | 3421 | 0 | 0 | 0.00% | 0.00% |  |
| D | 3421 | 3421 | 329 | 329 | 9.62% | 9.62% |  |
Top three noisy pixels from each quadrant. If the there are fewer than three noisy pixels in the level2.evt file, extra rows are filled as -1
| Pixel properties | Quadrant properties | ||||||
|---|---|---|---|---|---|---|---|
| Quadrant | DetID | PixID | Counts | Sigma | Mean | Median | Sigma |
| A | 13 | 254 | 7019 | 82.88 | 399 | 392 | 80.0 |
| A | 15 | 174 | 6803 | 80.18 | 399 | 392 | 80.0 |
| A | 13 | 6 | 4450 | 50.75 | 399 | 392 | 80.0 |
| B | 10 | 246 | 39375 | 516.83 | 398 | 389 | 75.4 |
| B | 5 | 255 | 34370 | 450.48 | 398 | 389 | 75.4 |
| B | 0 | 182 | 29678 | 388.28 | 398 | 389 | 75.4 |
| C | 14 | 238 | 62825 | 717.45 | 372 | 376 | 87.0 |
| C | 2 | 16 | 19298 | 217.39 | 372 | 376 | 87.0 |
| C | 2 | 114 | 8206 | 89.96 | 372 | 376 | 87.0 |
| D | 1 | 52 | 732200 | 8336.98 | 365 | 354 | 87.8 |
| D | 8 | 195 | 517985 | 5896.7 | 365 | 354 | 87.8 |
| D | 7 | 80 | 411494 | 4683.59 | 365 | 354 | 87.8 |
Histogram calculated using DETX and DETY for each event in the final _common_clean file
| Quadrant A | 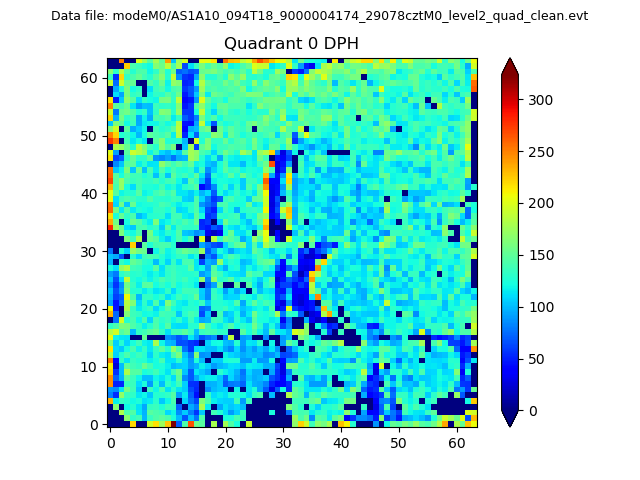 |
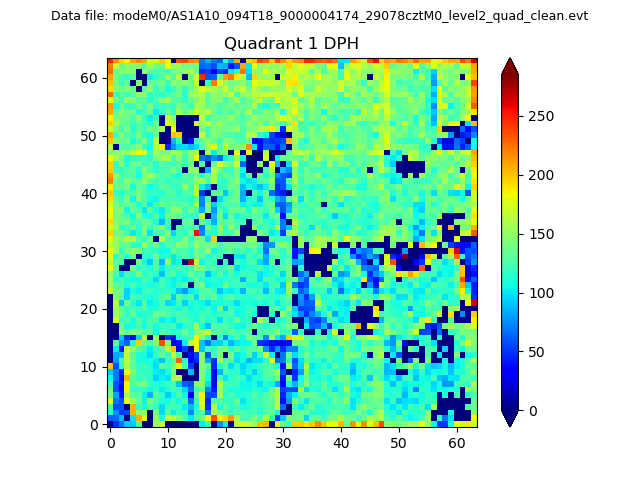 |
Quadrant B |
|---|---|---|---|
| Quadrant D | 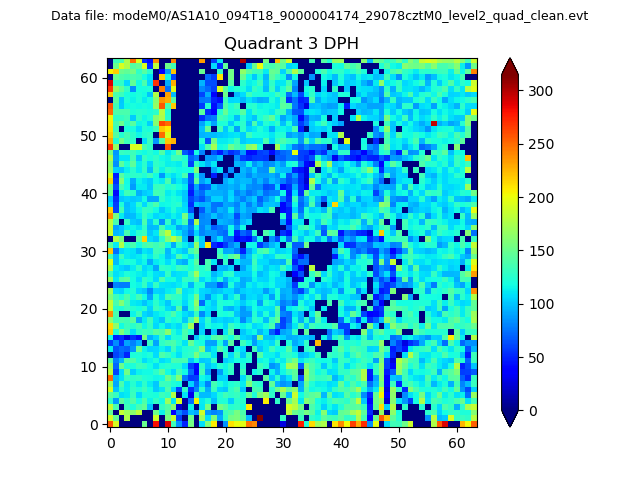 |
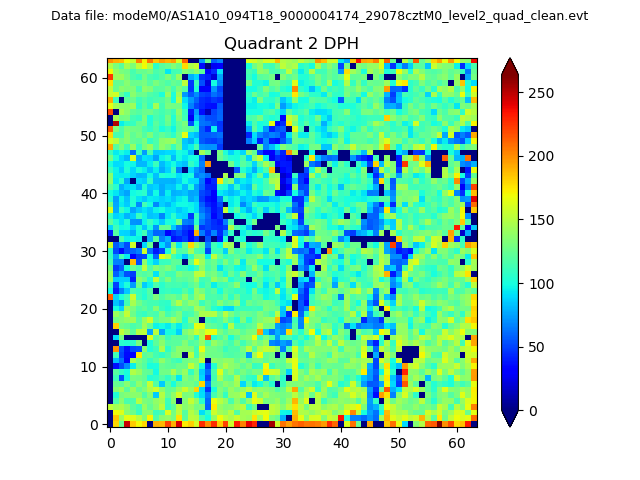 |
Quadrant C |
| Plot type | Count rate plots | Images |
|---|---|---|
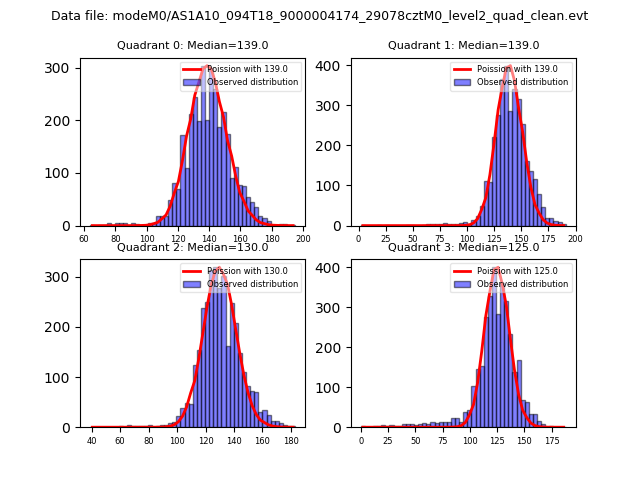
| Comparison with Poisson distribution Blue bars denote a histogram of data divided into 1 sec bins. Red curve is a Poisson curve with rate = median count rate of data. |
 |
 |
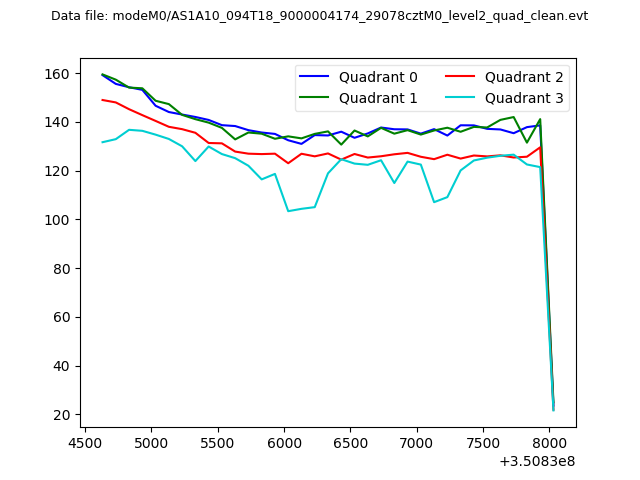
| Quadrant-wise count rates Data is divided into 100 sec bins |
 |
|
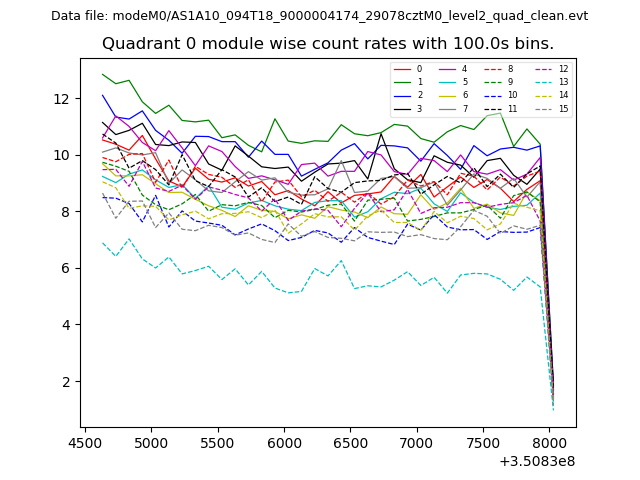
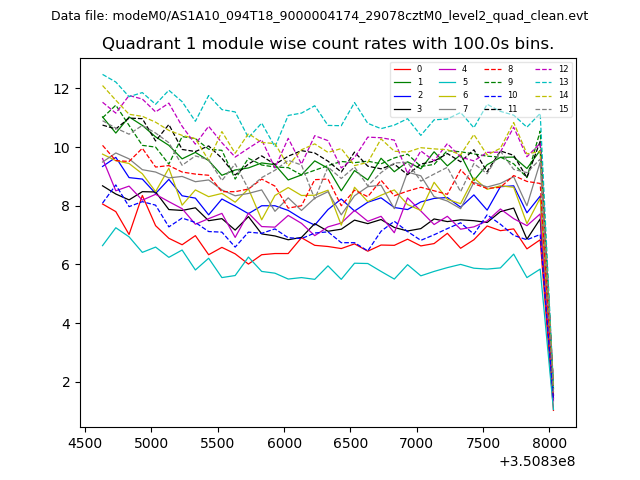
| Module-wise count rates for Quadrant A Data is divided into 100 sec bins |
 |
 |
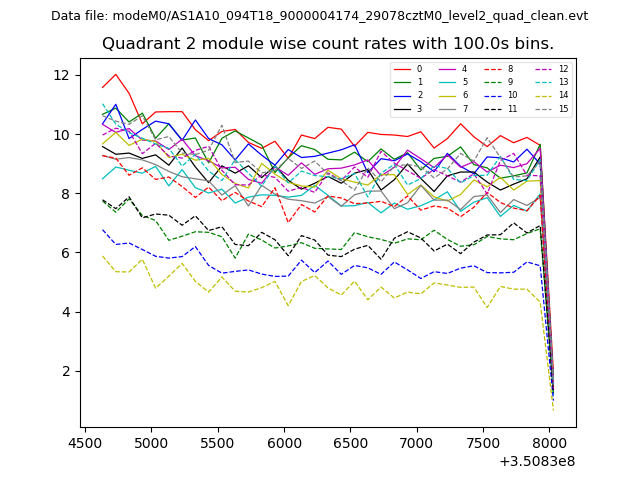
| Module-wise count rates for Quadrant B Data is divided into 100 sec bins |
 |
 |
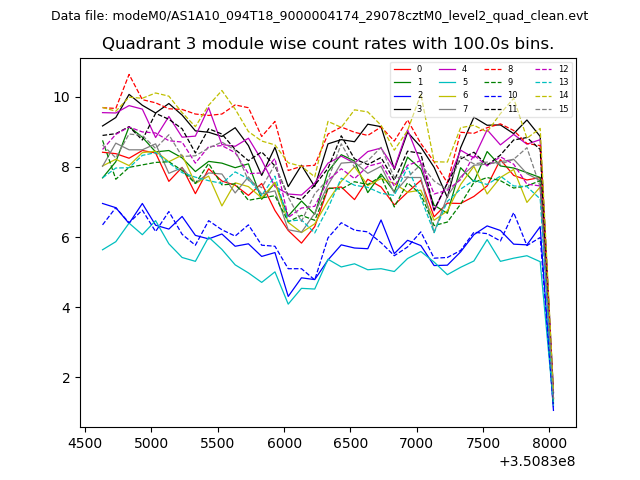
| Module-wise count rates for Quadrant C Data is divided into 100 sec bins |
 |
 |
| Module-wise count rates for Quadrant D Data is divided into 100 sec bins |
 |
 |
| Parameter | Plot |
|---|---|
| CZT HV Monitor | 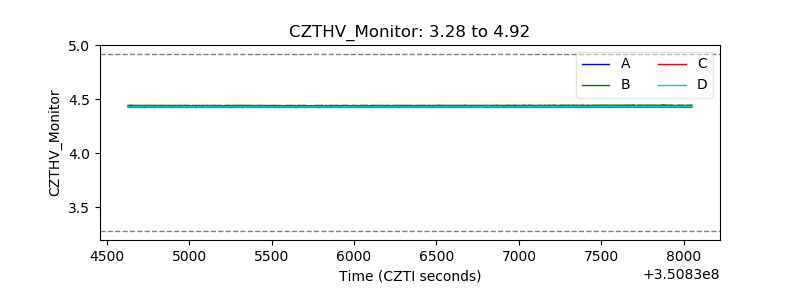 |
| D_VDD | 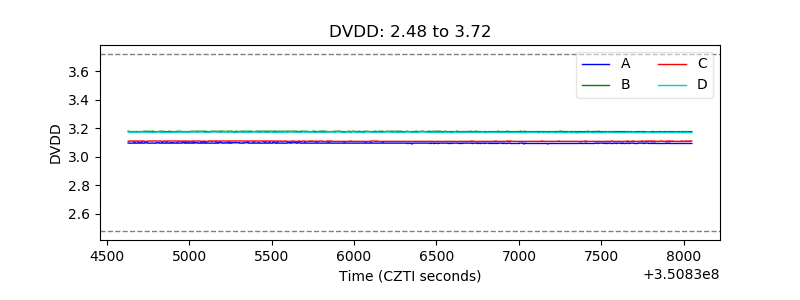 |
| Temperature 1 | 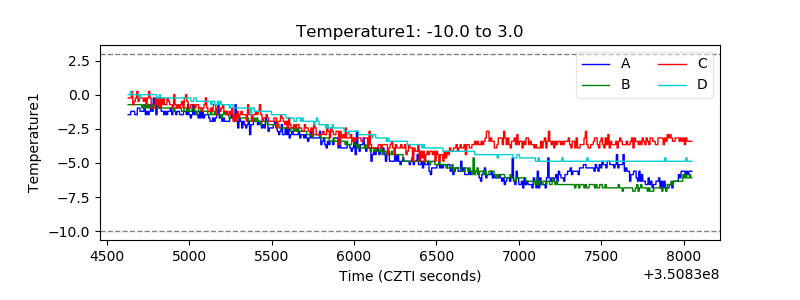 |
| Veto HV Monitor | 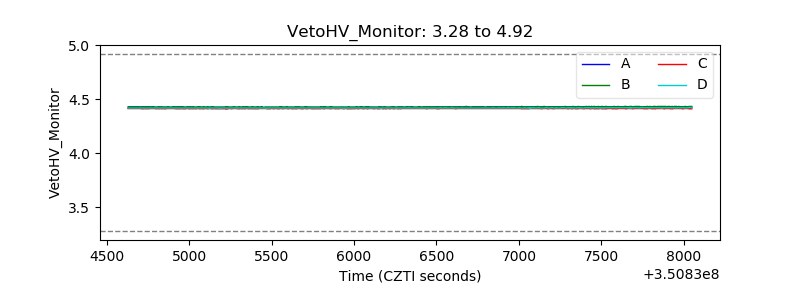 |
| Veto LLD | 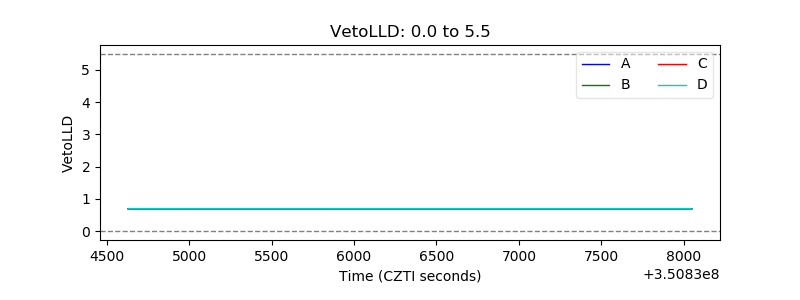 |
| Alpha Counter | 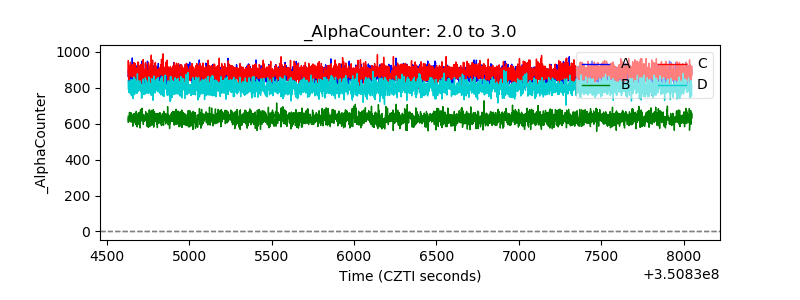 |
| _CPM_Rate | 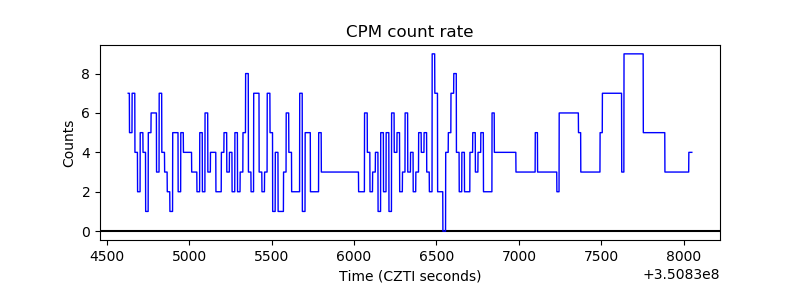 |
| CZT Counter | 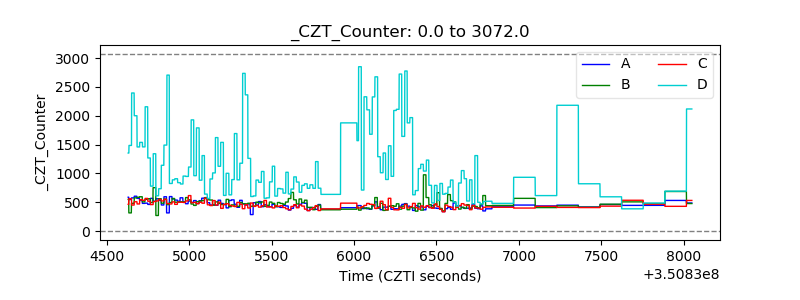 |
| +2.5 Volts monitor |  |
| +5 Volts monitor | 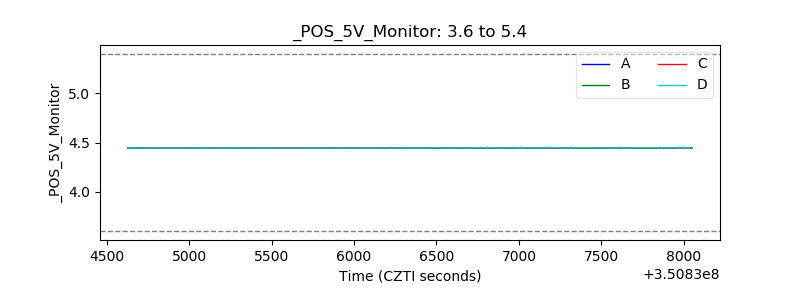 |
| _ROLL_ROT | 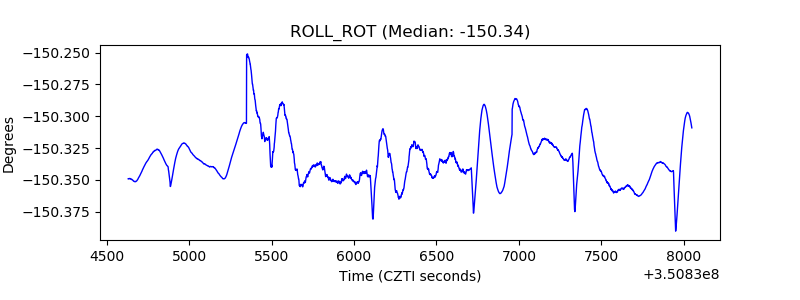 |
| _Roll_DEC | 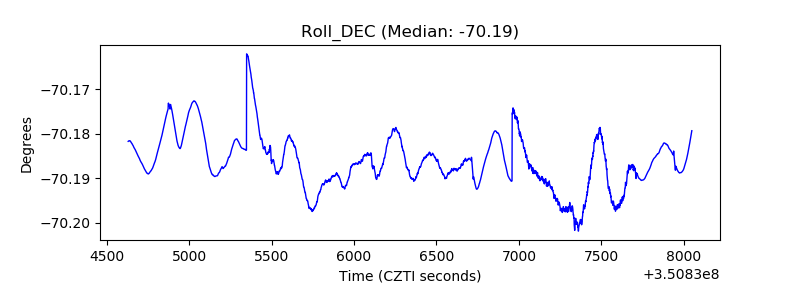 |
| _Roll_RA | 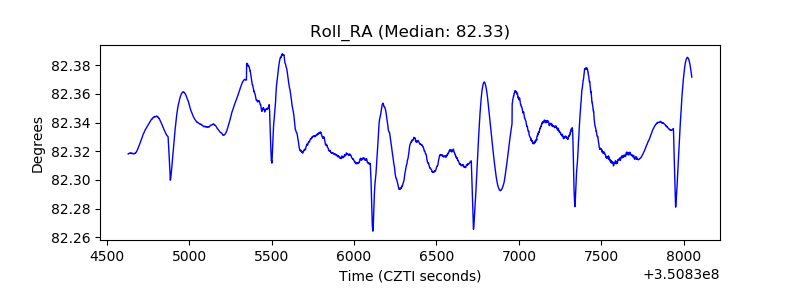 |
| Veto Counter | 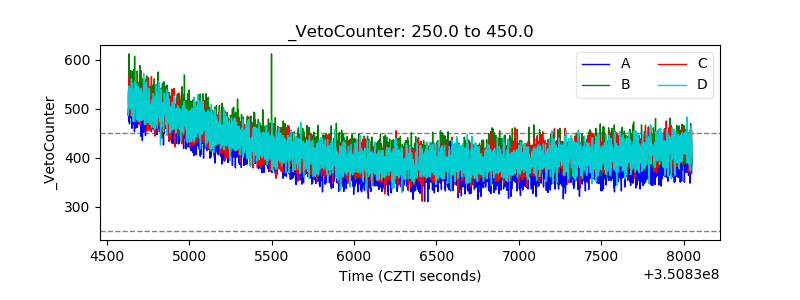 |