| Param | Original file | Final file |
|---|---|---|
| Filename | modeM0/AS1A10_094T19_9000004172cztM0_level2.fits | modeM0/AS1A10_094T19_9000004172cztM0_level2_quad_clean.evt |
| Size (bytes) | 54,443,520 | 62,046,720 |
| Size | 51.9 MB | 59.2 MB |
| Events in quadrant A | 338,704 | 402,333 |
| Events in quadrant B | 325,656 | 398,122 |
| Events in quadrant C | 323,588 | 375,283 |
| Events in quadrant D | 274,214 | 315,712 |
| Mode M0 | |||
|---|---|---|---|
| Quadrant | BADHDUFLAG | Total packets | Discarded packets |
| A | 0 | 11472 | 0 |
| B | 0 | 11969 | 0 |
| C | 0 | 11534 | 0 |
| D | 0 | 19236 | 0 |
| Mode M9 | |||
|---|---|---|---|
| Quadrant | BADHDUFLAG | Total packets | Discarded packets |
| A | 0 | 10 | 0 |
| B | 0 | 10 | 0 |
| C | 0 | 10 | 0 |
| D | 0 | 10 | 0 |
| Mode SS | |||
|---|---|---|---|
| Quadrant | BADHDUFLAG | Total packets | Discarded packets |
| A | 0 | 112 | 0 |
| B | 0 | 112 | 0 |
| C | 0 | 112 | 0 |
| D | 0 | 112 | 0 |
| Quadrant | Total seconds | Saturated seconds | Saturation percentage |
|---|---|---|---|
| A | 5529 | 18 | 0.325556% |
| B | 5529 | 45 | 0.813890% |
| C | 5529 | 59 | 1.067101% |
| D | 5529 | 462 | 8.355941% |
Noise dominated data is calculated using 1-second bins in cleaned event files. If a bin has >2000 counts, and if more than 50% of those come from <1% of pixels, then it is considered to be noise-dominated and hence unusable.
| Quadrant | # 1 sec bins | Bins with >0 counts | Bins with >2000 counts | High rate bins dominated by noise | Noise dominated (total time) | Noise dominated (detector-on time) | Marked lightcurve |
|---|---|---|---|---|---|---|---|
| A | 6523 | 5527 | 0 | 0 | 0.00% | 0.00% | 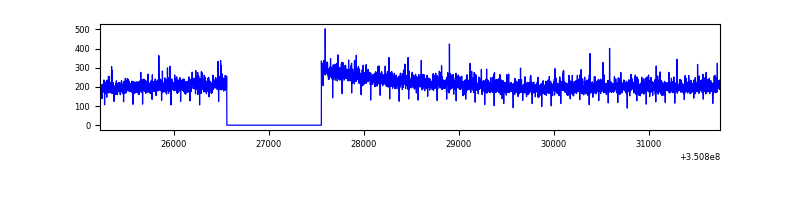 |
| B | 6523 | 5527 | 0 | 0 | 0.00% | 0.00% |  |
| C | 6523 | 5527 | 0 | 0 | 0.00% | 0.00% | 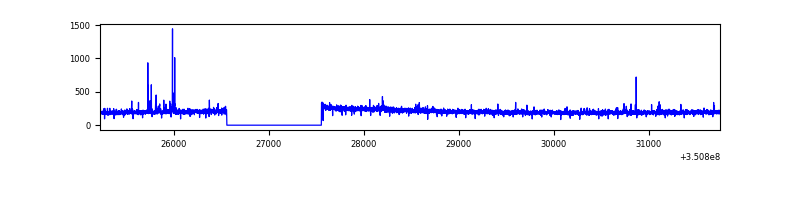 |
| D | 6523 | 5520 | 0 | 0 | 0.00% | 0.00% | 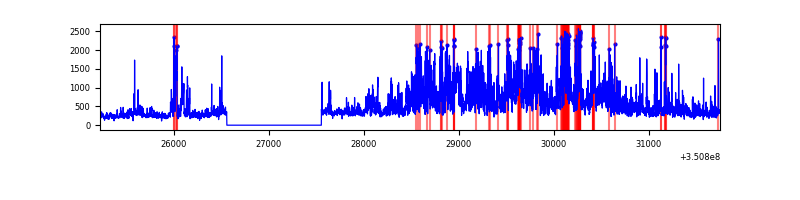 |
Top three noisy pixels from each quadrant. If the there are fewer than three noisy pixels in the level2.evt file, extra rows are filled as -1
| Pixel properties | Quadrant properties | ||||||
|---|---|---|---|---|---|---|---|
| Quadrant | DetID | PixID | Counts | Sigma | Mean | Median | Sigma |
| A | 0 | 29 | 332 | 10.42 | 88 | 83 | 23.9 |
| A | 0 | 30 | 285 | 8.45 | 88 | 83 | 23.9 |
| A | 7 | 110 | 255 | 7.2 | 88 | 83 | 23.9 |
| B | 2 | 9 | 260 | 9.49 | 86 | 83 | 18.6 |
| B | 3 | 17 | 235 | 8.15 | 86 | 83 | 18.6 |
| B | 5 | 128 | 220 | 7.35 | 86 | 83 | 18.6 |
| C | 3 | 126 | 235 | 6.41 | 85 | 81 | 24.0 |
| C | 7 | 111 | 221 | 5.82 | 85 | 81 | 24.0 |
| C | 12 | 241 | 217 | 5.66 | 85 | 81 | 24.0 |
| D | 3 | 14 | 217 | 6.56 | 77 | 70 | 22.4 |
| D | 15 | 46 | 216 | 6.52 | 77 | 70 | 22.4 |
| D | 4 | 246 | 205 | 6.02 | 77 | 70 | 22.4 |
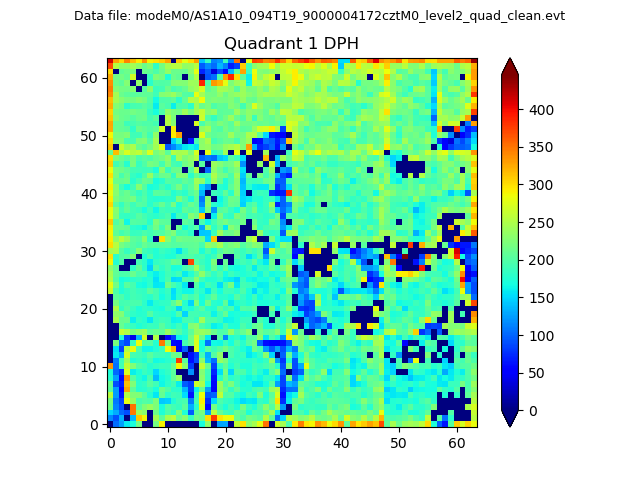
Histogram calculated using DETX and DETY for each event in the final _common_clean file
| Quadrant A |  |
 |
Quadrant B |
|---|---|---|---|
| Quadrant D | 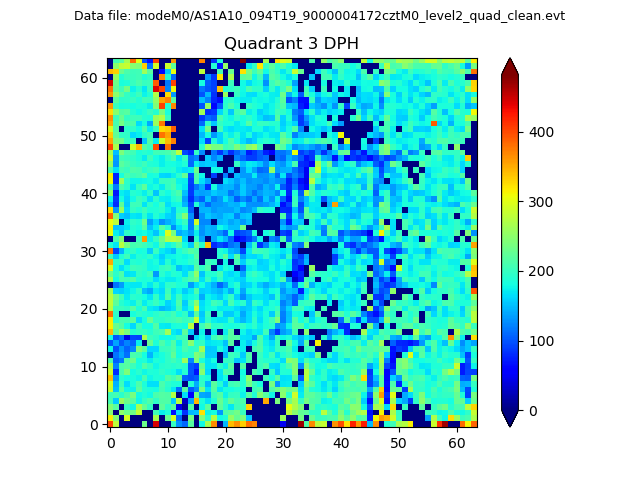 |
 |
Quadrant C |
| Plot type | Count rate plots | Images |
|---|---|---|
| Comparison with Poisson distribution Blue bars denote a histogram of data divided into 1 sec bins. Red curve is a Poisson curve with rate = median count rate of data. |
 |
 |
| Quadrant-wise count rates Data is divided into 100 sec bins |
 |
|
| Module-wise count rates for Quadrant A Data is divided into 100 sec bins |
 |
 |
| Module-wise count rates for Quadrant B Data is divided into 100 sec bins |
 |
 |
| Module-wise count rates for Quadrant C Data is divided into 100 sec bins |
 |
 |
| Module-wise count rates for Quadrant D Data is divided into 100 sec bins |
 |
 |
| Parameter | Plot |
|---|---|
| CZT HV Monitor |  |
| D_VDD |  |
| Temperature 1 |  |
| Veto HV Monitor |  |
| Veto LLD | 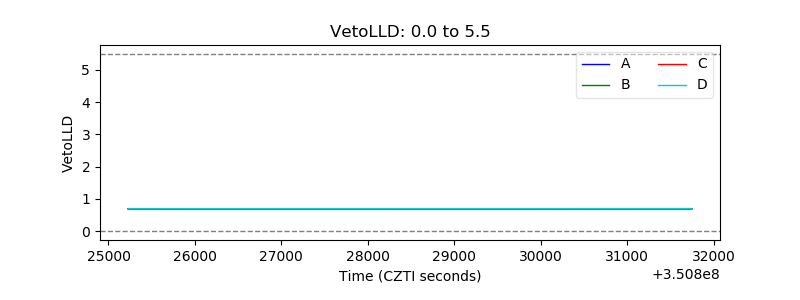 |
| Alpha Counter |  |
| _CPM_Rate |  |
| CZT Counter |  |
| +2.5 Volts monitor |  |
| +5 Volts monitor | 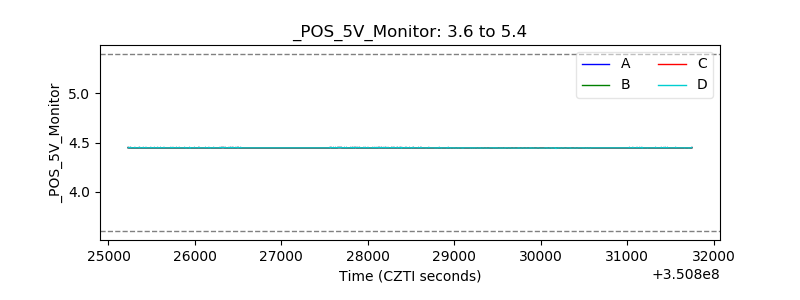 |
| _ROLL_ROT |  |
| _Roll_DEC |  |
| _Roll_RA |  |
| Veto Counter |  |