| Param | Original file | Final file |
|---|---|---|
| Filename | modeM0/AS1A10_094T19_9000004172_29077cztM0_level2.evt | modeM0/AS1A10_094T19_9000004172_29077cztM0_level2_quad_clean.evt |
| Size (bytes) | 300,997,440 | 68,613,120 |
| Size | 287.1 MB | 65.4 MB |
| Events in quadrant A | 1,604,087 | 477,122 |
| Events in quadrant B | 1,730,462 | 478,499 |
| Events in quadrant C | 1,591,828 | 453,435 |
| Events in quadrant D | 3,944,405 | 414,583 |
| Mode M0 | |||
|---|---|---|---|
| Quadrant | BADHDUFLAG | Total packets | Discarded packets |
| A | 0 | 7220 | 0 |
| B | 0 | 7539 | 0 |
| C | 0 | 7226 | 0 |
| D | 0 | 14197 | 0 |
| Mode SS | |||
|---|---|---|---|
| Quadrant | BADHDUFLAG | Total packets | Discarded packets |
| A | 0 | 72 | 0 |
| B | 0 | 72 | 0 |
| C | 0 | 72 | 0 |
| D | 0 | 72 | 0 |
| Quadrant | Total seconds | Saturated seconds | Saturation percentage |
|---|---|---|---|
| A | 3586 | 0 | 0.000000% |
| B | 3586 | 16 | 0.446180% |
| C | 3586 | 16 | 0.446180% |
| D | 3586 | 437 | 12.186280% |
Noise dominated data is calculated using 1-second bins in cleaned event files. If a bin has >2000 counts, and if more than 50% of those come from <1% of pixels, then it is considered to be noise-dominated and hence unusable.
| Quadrant | # 1 sec bins | Bins with >0 counts | Bins with >2000 counts | High rate bins dominated by noise | Noise dominated (total time) | Noise dominated (detector-on time) | Marked lightcurve |
|---|---|---|---|---|---|---|---|
| A | 3586 | 3586 | 0 | 0 | 0.00% | 0.00% | 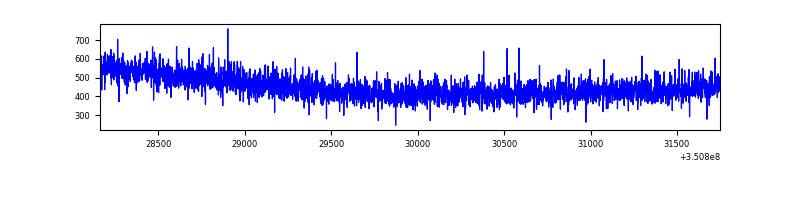 |
| B | 3586 | 3586 | 13 | 13 | 0.36% | 0.36% | 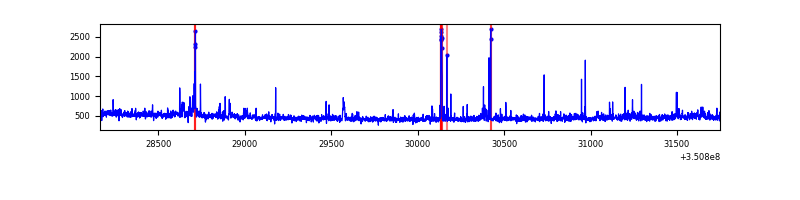 |
| C | 3586 | 3586 | 0 | 0 | 0.00% | 0.00% | 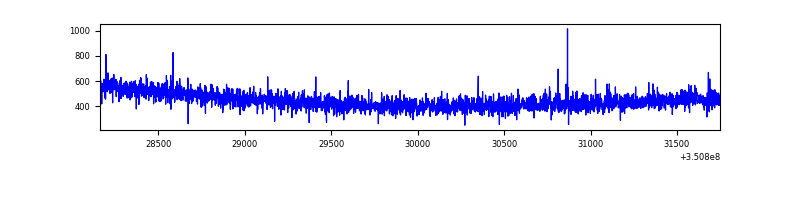 |
| D | 3586 | 3586 | 472 | 472 | 13.16% | 13.16% | 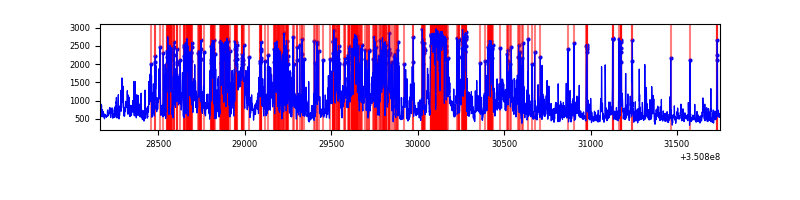 |
Top three noisy pixels from each quadrant. If the there are fewer than three noisy pixels in the level2.evt file, extra rows are filled as -1
| Pixel properties | Quadrant properties | ||||||
|---|---|---|---|---|---|---|---|
| Quadrant | DetID | PixID | Counts | Sigma | Mean | Median | Sigma |
| A | 13 | 6 | 7275 | 81.89 | 413 | 405 | 83.9 |
| A | 13 | 254 | 6524 | 72.94 | 413 | 405 | 83.9 |
| A | 3 | 137 | 3782 | 40.25 | 413 | 405 | 83.9 |
| B | 5 | 255 | 66519 | 834.51 | 410 | 401 | 79.2 |
| B | 10 | 246 | 16729 | 206.08 | 410 | 401 | 79.2 |
| B | 0 | 183 | 13814 | 169.29 | 410 | 401 | 79.2 |
| C | 14 | 238 | 63423 | 695.06 | 386 | 389 | 90.7 |
| C | 2 | 114 | 8295 | 87.18 | 386 | 389 | 90.7 |
| C | 3 | 233 | 7573 | 79.22 | 386 | 389 | 90.7 |
| D | 1 | 52 | 1526502 | 17115.76 | 373 | 363 | 89.2 |
| D | 8 | 195 | 524110 | 5873.86 | 373 | 363 | 89.2 |
| D | 2 | 250 | 291928 | 3269.92 | 373 | 363 | 89.2 |
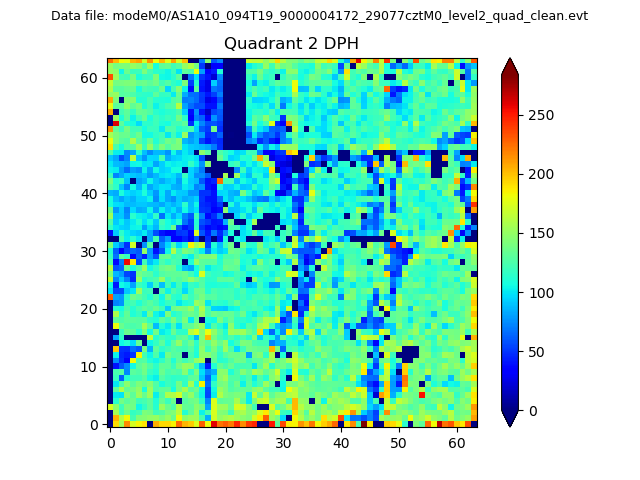
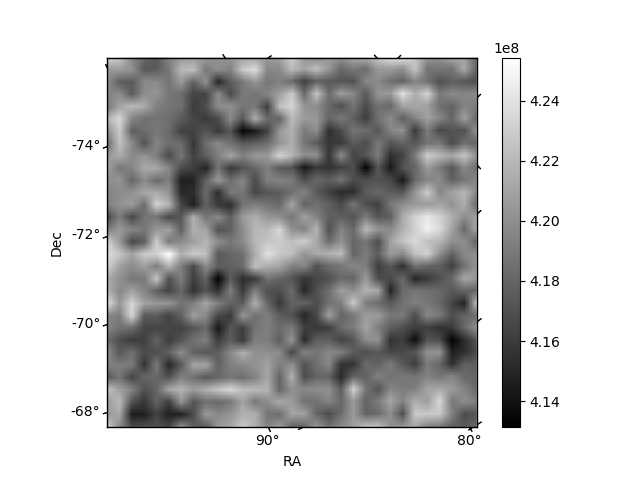
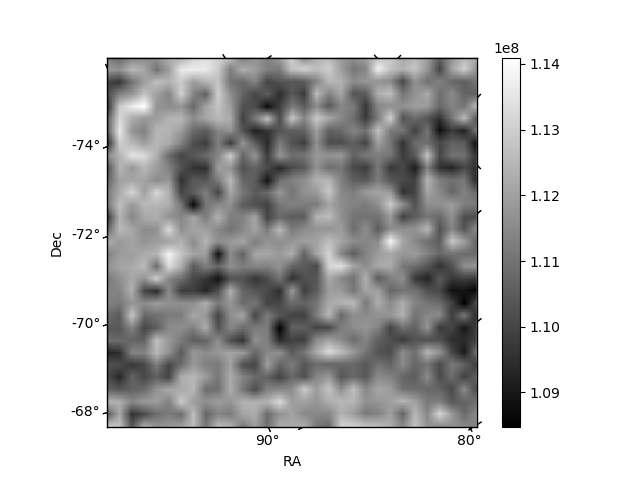
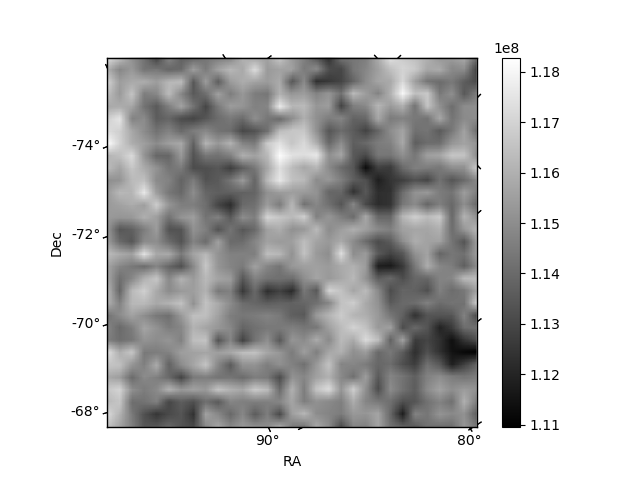
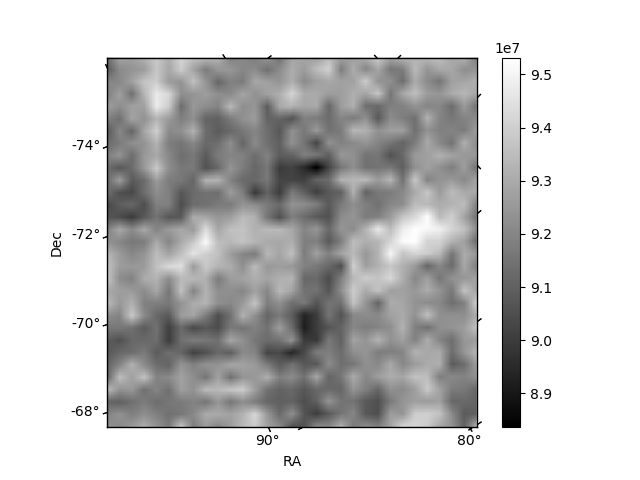
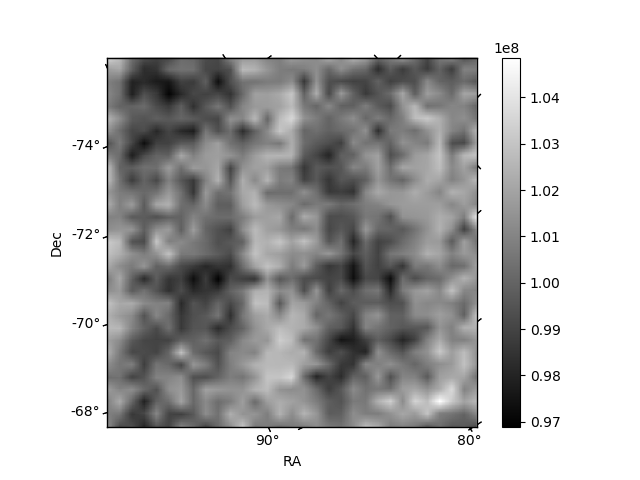
Histogram calculated using DETX and DETY for each event in the final _common_clean file
| Quadrant A | 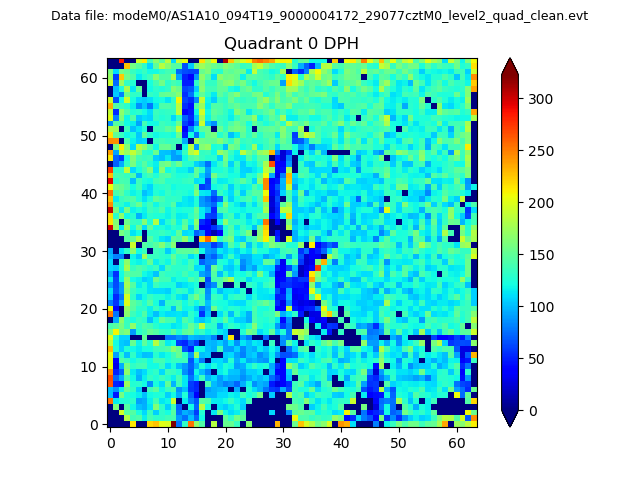 |
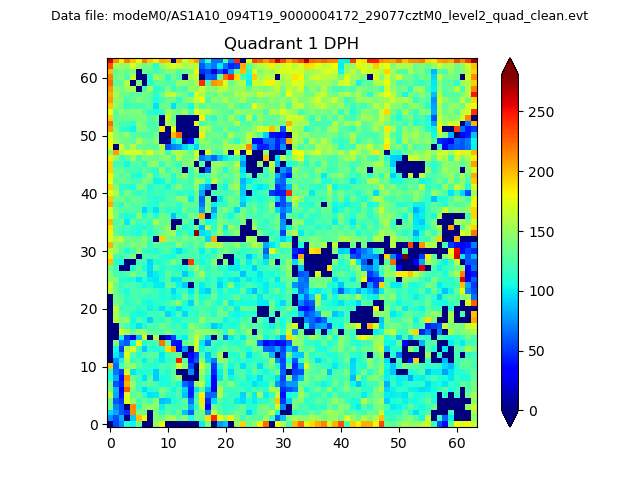 |
Quadrant B |
|---|---|---|---|
| Quadrant D | 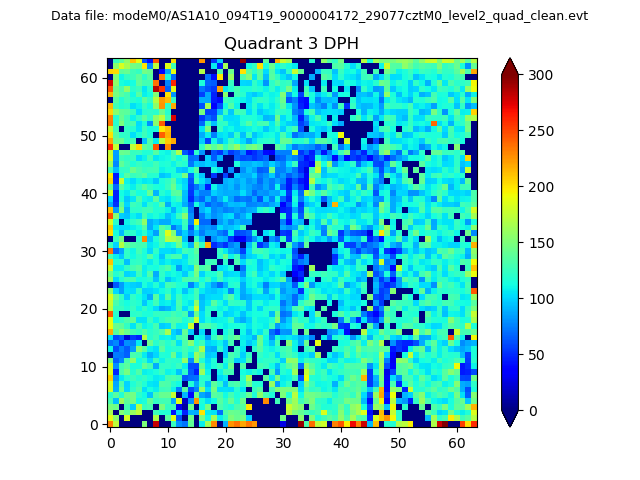 |
 |
Quadrant C |
| Plot type | Count rate plots | Images |
|---|---|---|
| Comparison with Poisson distribution Blue bars denote a histogram of data divided into 1 sec bins. Red curve is a Poisson curve with rate = median count rate of data. |
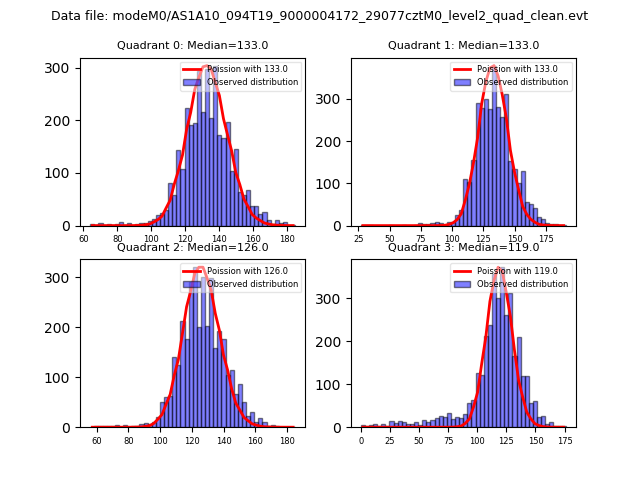 |
 |
| Quadrant-wise count rates Data is divided into 100 sec bins |
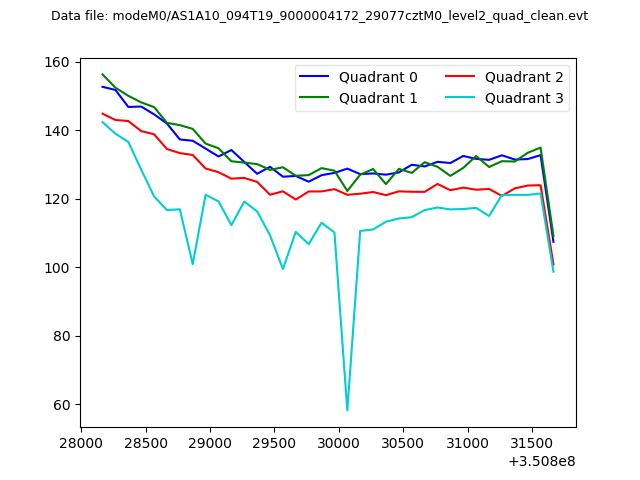 |
|
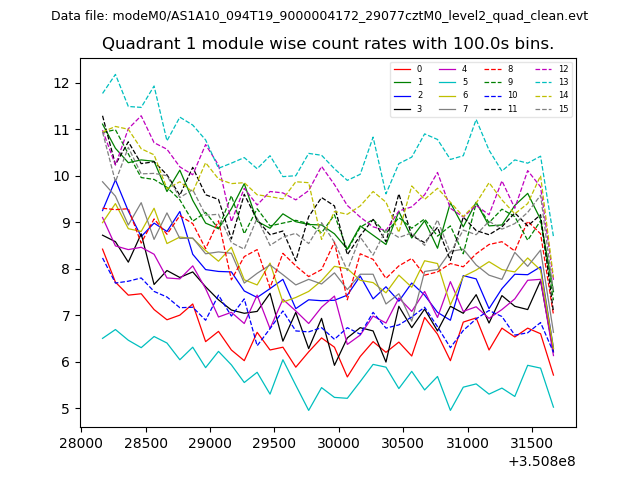
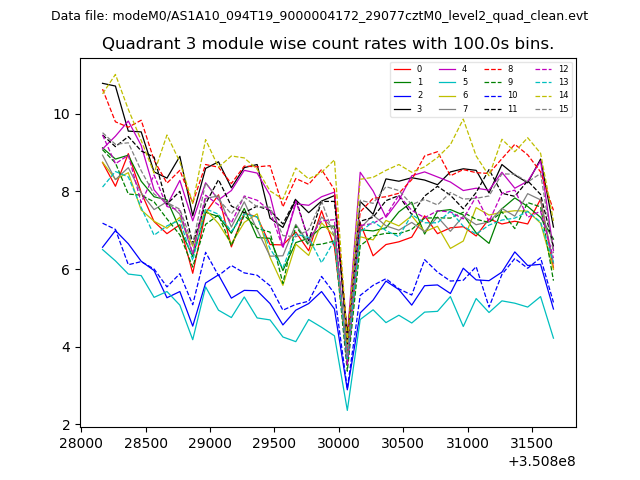
| Module-wise count rates for Quadrant A Data is divided into 100 sec bins |
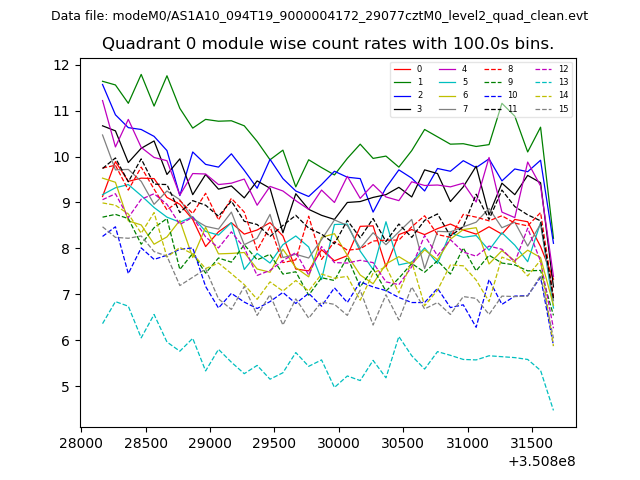 |
 |
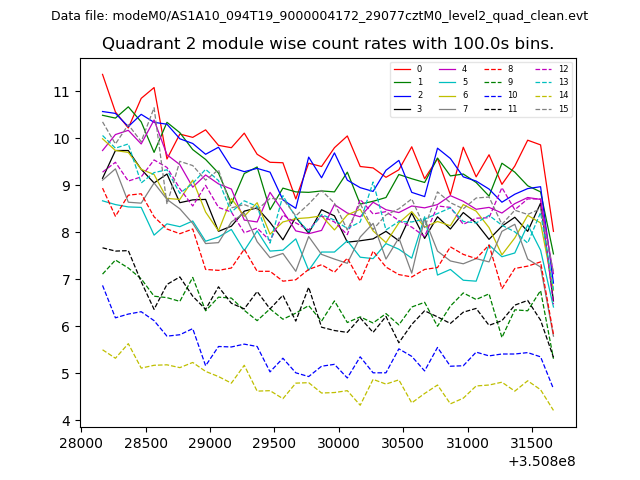
| Module-wise count rates for Quadrant B Data is divided into 100 sec bins |
 |
 |
| Module-wise count rates for Quadrant C Data is divided into 100 sec bins |
 |
 |
| Module-wise count rates for Quadrant D Data is divided into 100 sec bins |
 |
 |
| Parameter | Plot |
|---|---|
| CZT HV Monitor | 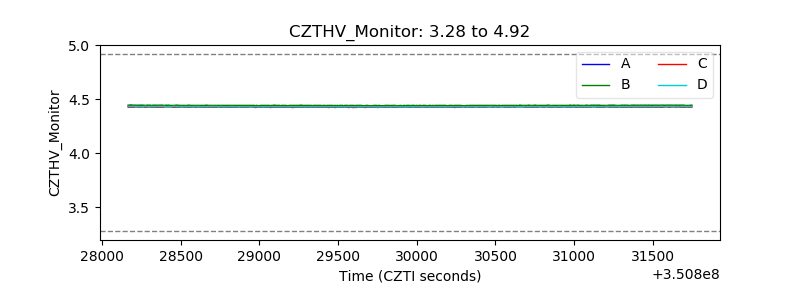 |
| D_VDD | 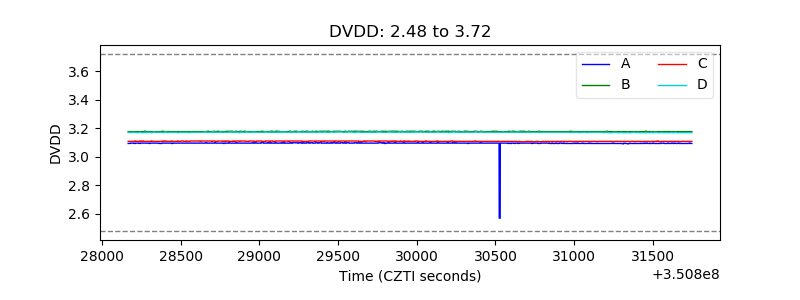 |
| Temperature 1 | 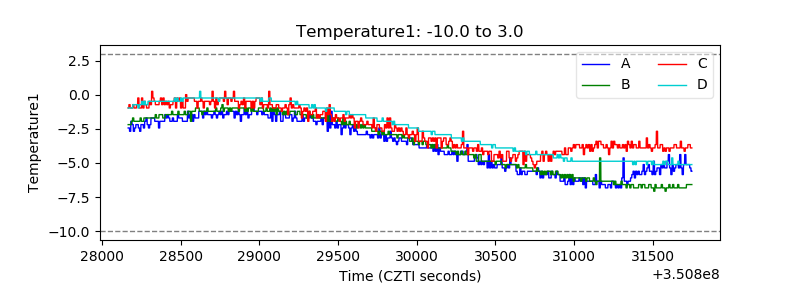 |
| Veto HV Monitor | 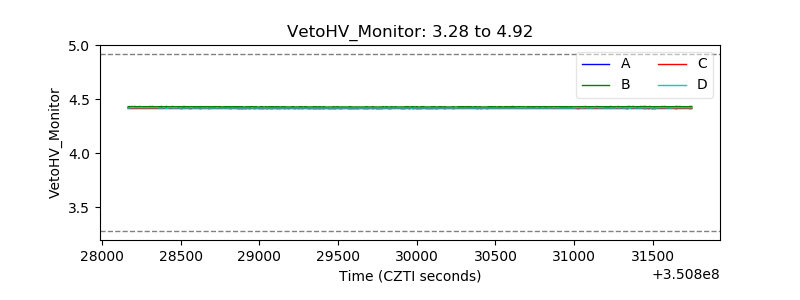 |
| Veto LLD | 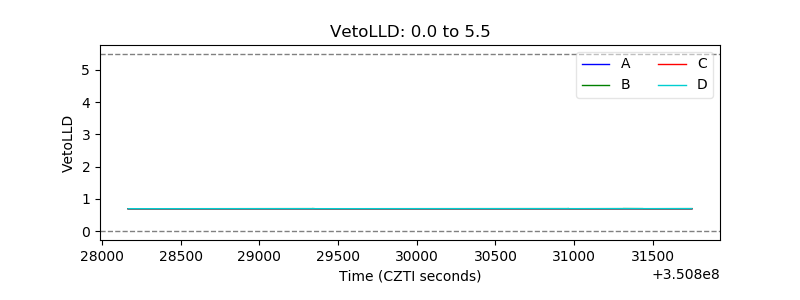 |
| Alpha Counter | 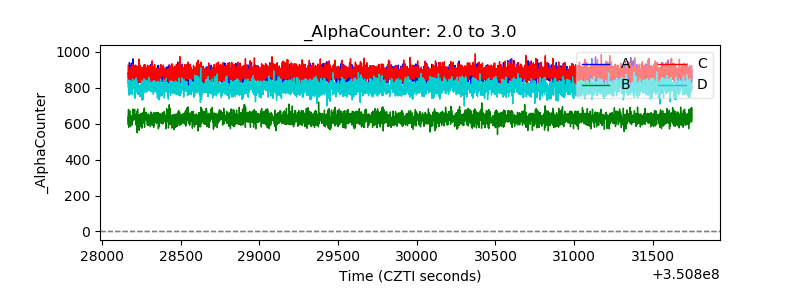 |
| _CPM_Rate | 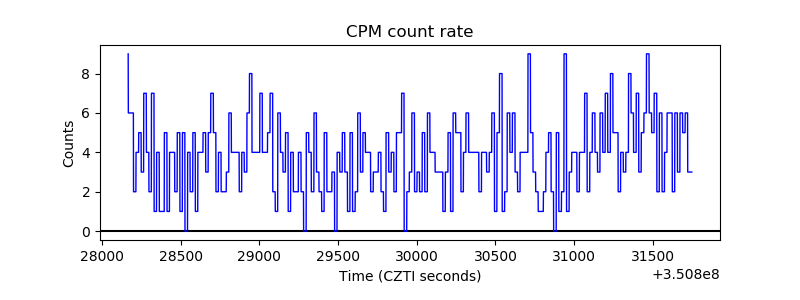 |
| CZT Counter | 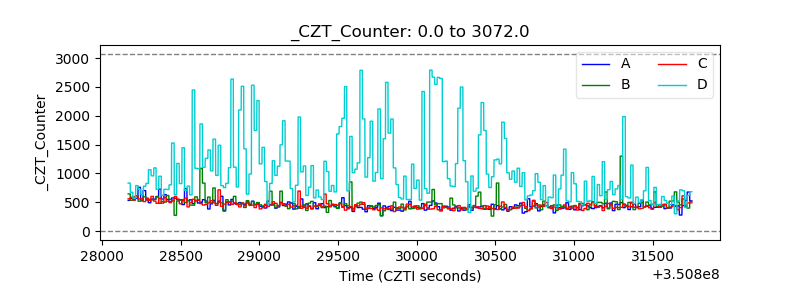 |
| +2.5 Volts monitor |  |
| +5 Volts monitor | 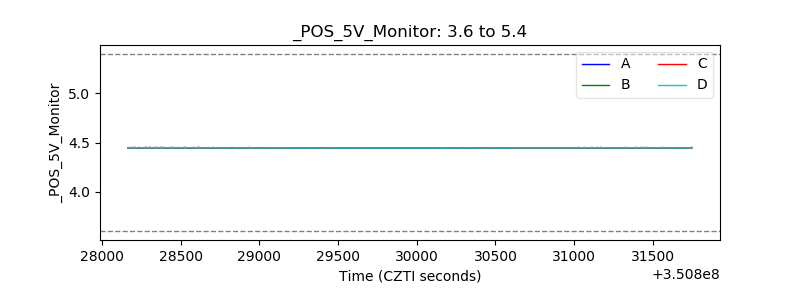 |
| _ROLL_ROT | 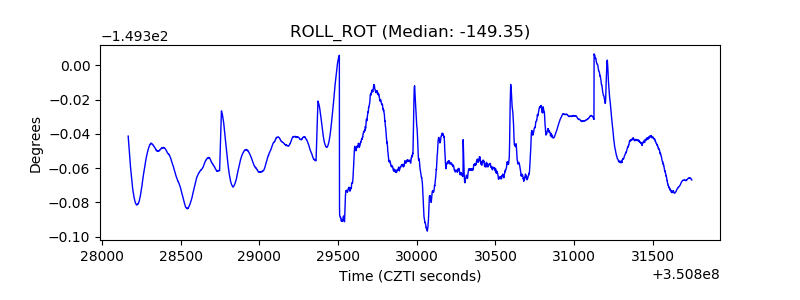 |
| _Roll_DEC | 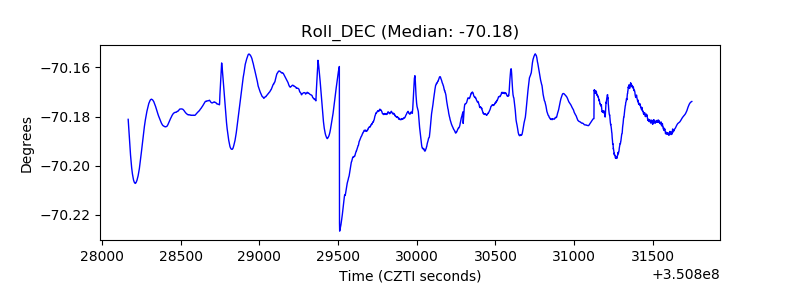 |
| _Roll_RA | 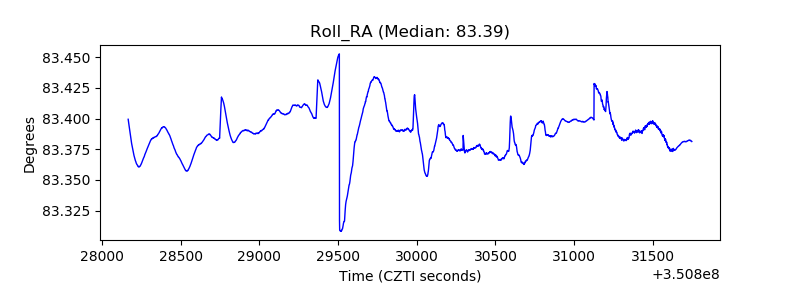 |
| Veto Counter | 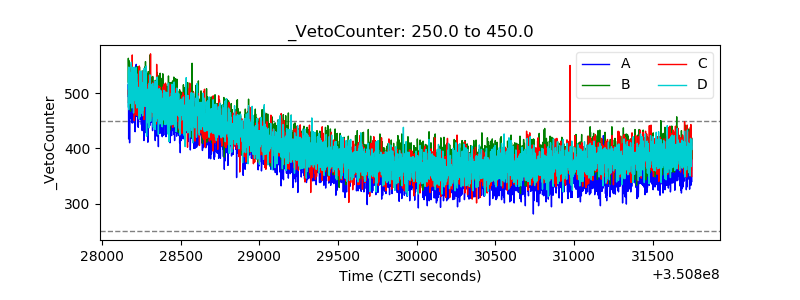 |