| Param | Original file | Final file |
|---|---|---|
| Filename | modeM0/AS1A10_115T01_9000004178cztM0_level2.fits | modeM0/AS1A10_115T01_9000004178cztM0_level2_quad_clean.evt |
| Size (bytes) | 238,731,840 | 115,076,160 |
| Size | 227.7 MB | 109.7 MB |
| Events in quadrant A | 1,509,892 | 508,299 |
| Events in quadrant B | 1,454,472 | 514,940 |
| Events in quadrant C | 1,466,310 | 495,467 |
| Events in quadrant D | 1,246,142 | 410,493 |
| Mode SS | |||
|---|---|---|---|
| Quadrant | BADHDUFLAG | Total packets | Discarded packets |
| A | 0 | 462 | 0 |
| B | 0 | 462 | 0 |
| C | 0 | 462 | 0 |
| D | 0 | 462 | 0 |
| Mode M9 | |||
|---|---|---|---|
| Quadrant | BADHDUFLAG | Total packets | Discarded packets |
| A | 0 | 58 | 0 |
| B | 0 | 58 | 0 |
| C | 0 | 58 | 0 |
| D | 0 | 58 | 0 |
| Mode M0 | |||
|---|---|---|---|
| Quadrant | BADHDUFLAG | Total packets | Discarded packets |
| A | 0 | 48687 | 0 |
| B | 0 | 49369 | 0 |
| C | 0 | 48258 | 0 |
| D | 0 | 69828 | 0 |
| Quadrant | Total seconds | Saturated seconds | Saturation percentage |
|---|---|---|---|
| A | 22564 | 291 | 1.289665% |
| B | 22564 | 383 | 1.697394% |
| C | 22564 | 392 | 1.737281% |
| D | 22564 | 1436 | 6.364120% |
Noise dominated data is calculated using 1-second bins in cleaned event files. If a bin has >2000 counts, and if more than 50% of those come from <1% of pixels, then it is considered to be noise-dominated and hence unusable.
| Quadrant | # 1 sec bins | Bins with >0 counts | Bins with >2000 counts | High rate bins dominated by noise | Noise dominated (total time) | Noise dominated (detector-on time) | Marked lightcurve |
|---|---|---|---|---|---|---|---|
| A | 28383 | 22558 | 0 | 0 | 0.00% | 0.00% | 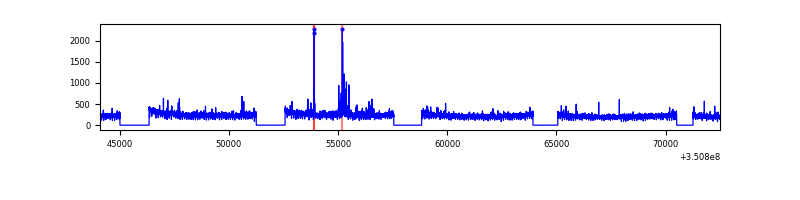 |
| B | 28383 | 22558 | 0 | 0 | 0.00% | 0.00% |  |
| C | 28383 | 22558 | 0 | 0 | 0.00% | 0.00% |  |
| D | 28383 | 22550 | 0 | 0 | 0.00% | 0.00% | 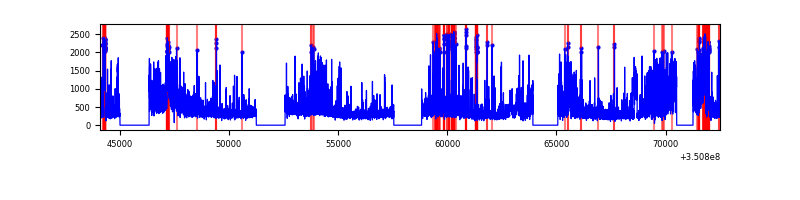 |
Top three noisy pixels from each quadrant. If the there are fewer than three noisy pixels in the level2.evt file, extra rows are filled as -1
| Pixel properties | Quadrant properties | ||||||
|---|---|---|---|---|---|---|---|
| Quadrant | DetID | PixID | Counts | Sigma | Mean | Median | Sigma |
| A | 0 | 29 | 1287 | 9.45 | 393 | 372 | 96.9 |
| A | 7 | 110 | 1208 | 8.63 | 393 | 372 | 96.9 |
| A | 9 | 19 | 1102 | 7.54 | 393 | 372 | 96.9 |
| B | 2 | 9 | 1149 | 10.26 | 384 | 369 | 76.1 |
| B | 5 | 225 | 983 | 8.07 | 384 | 369 | 76.1 |
| B | 2 | 8 | 953 | 7.68 | 384 | 369 | 76.1 |
| C | 1 | 81 | 1143 | 7.83 | 387 | 366 | 99.2 |
| C | 1 | 80 | 1106 | 7.46 | 387 | 366 | 99.2 |
| C | 3 | 202 | 1089 | 7.29 | 387 | 366 | 99.2 |
| D | 15 | 46 | 992 | 6.98 | 355 | 324 | 95.7 |
| D | 10 | 189 | 894 | 5.96 | 355 | 324 | 95.7 |
| D | 6 | 67 | 882 | 5.83 | 355 | 324 | 95.7 |
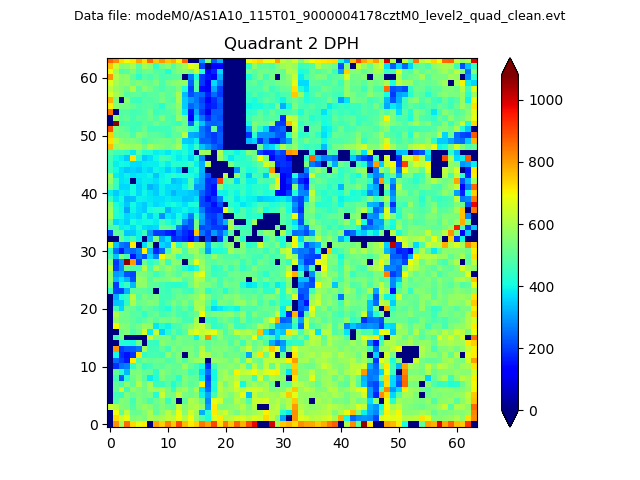
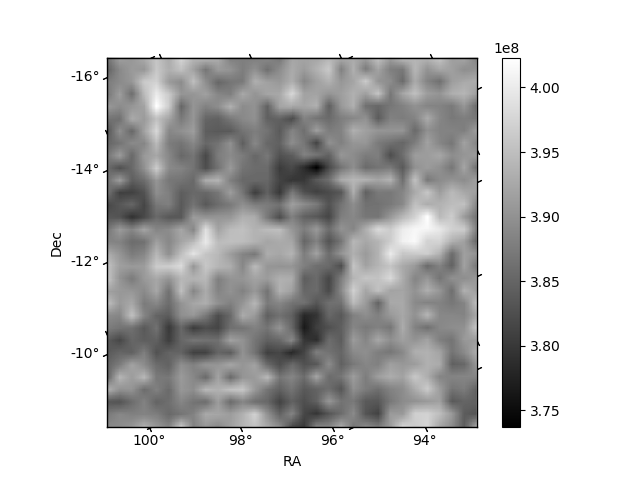
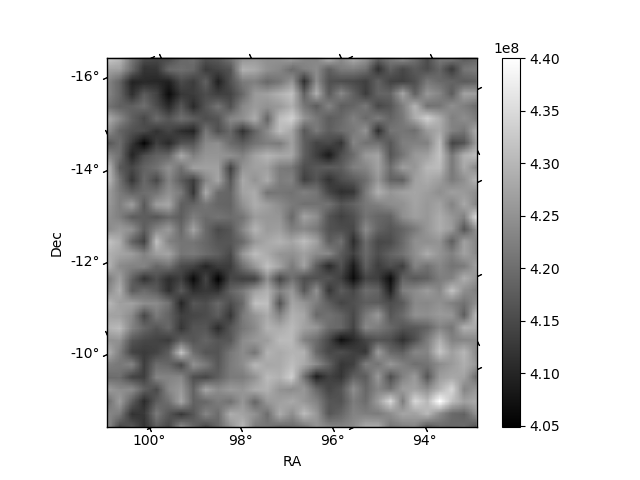
Histogram calculated using DETX and DETY for each event in the final _common_clean file
| Quadrant A | 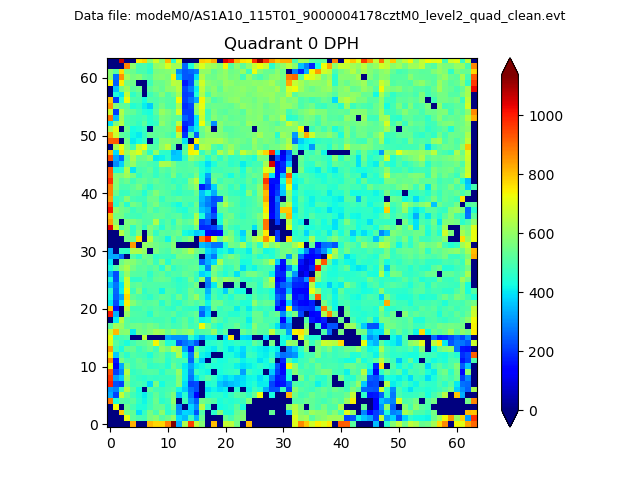 |
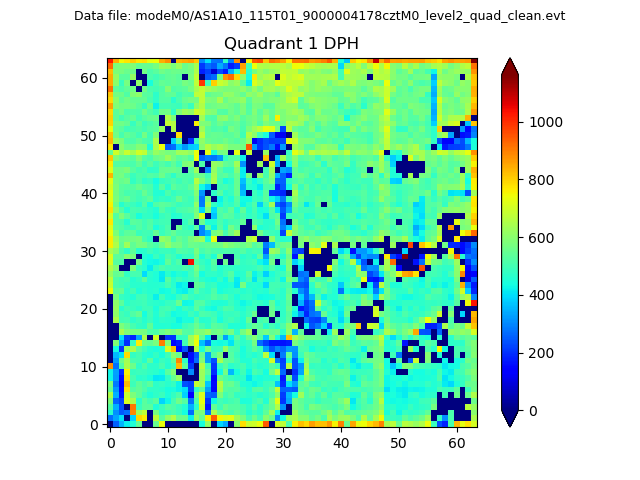 |
Quadrant B |
|---|---|---|---|
| Quadrant D | 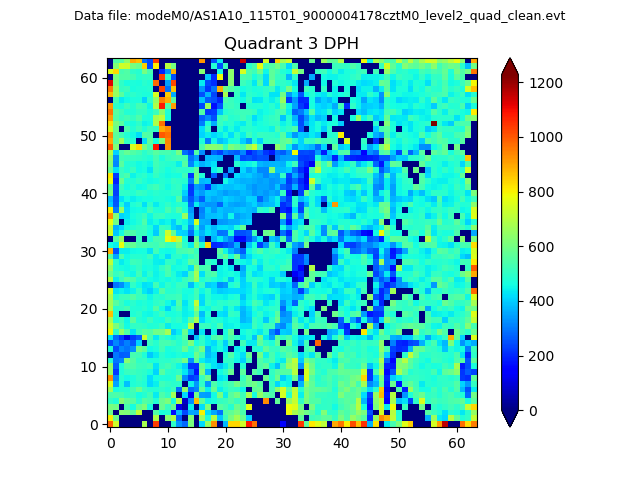 |
 |
Quadrant C |
| Plot type | Count rate plots | Images |
|---|---|---|
| Comparison with Poisson distribution Blue bars denote a histogram of data divided into 1 sec bins. Red curve is a Poisson curve with rate = median count rate of data. |
 |
 |
| Quadrant-wise count rates Data is divided into 100 sec bins |
 |
|
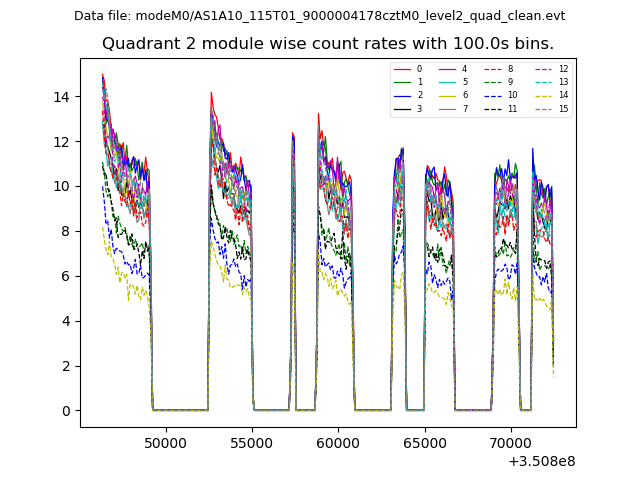
| Module-wise count rates for Quadrant A Data is divided into 100 sec bins |
 |
 |
| Module-wise count rates for Quadrant B Data is divided into 100 sec bins |
 |
 |
| Module-wise count rates for Quadrant C Data is divided into 100 sec bins |
 |
 |
| Module-wise count rates for Quadrant D Data is divided into 100 sec bins |
 |
 |
| Parameter | Plot |
|---|---|
| CZT HV Monitor | 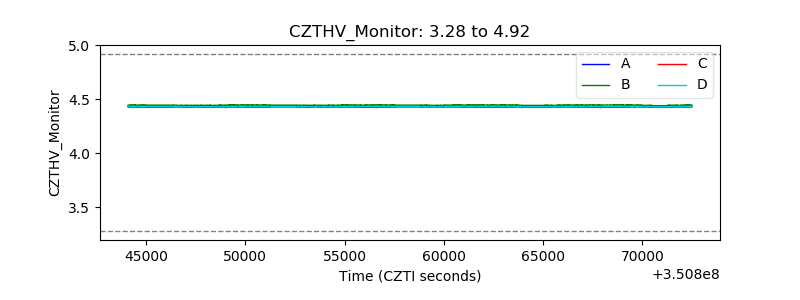 |
| D_VDD | 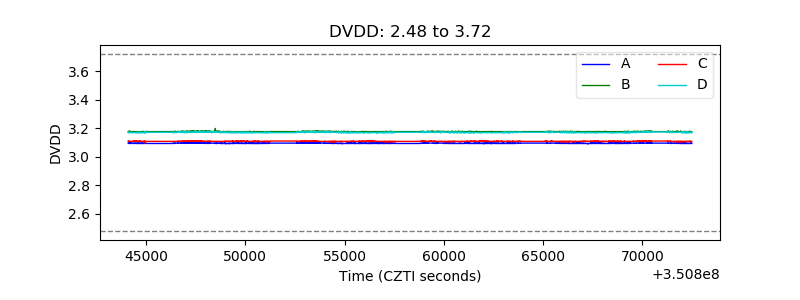 |
| Temperature 1 | 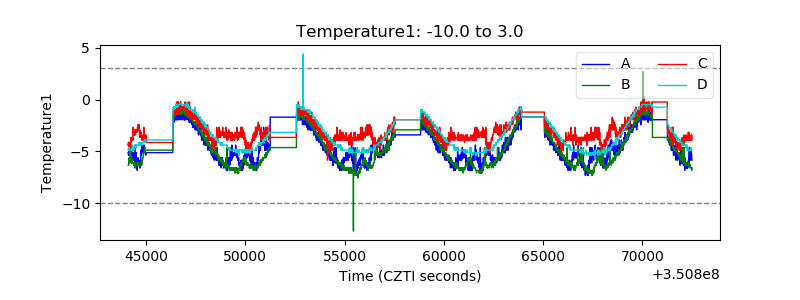 |
| Veto HV Monitor |  |
| Veto LLD | 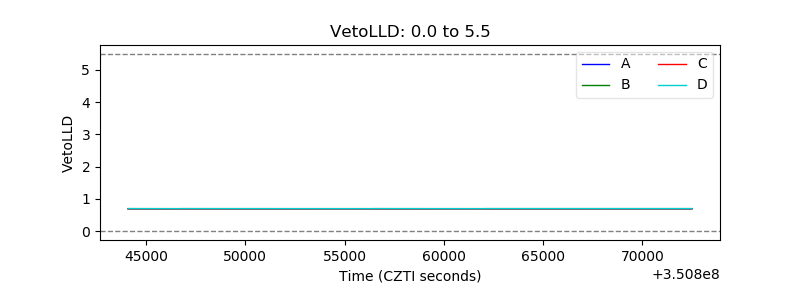 |
| Alpha Counter |  |
| _CPM_Rate | 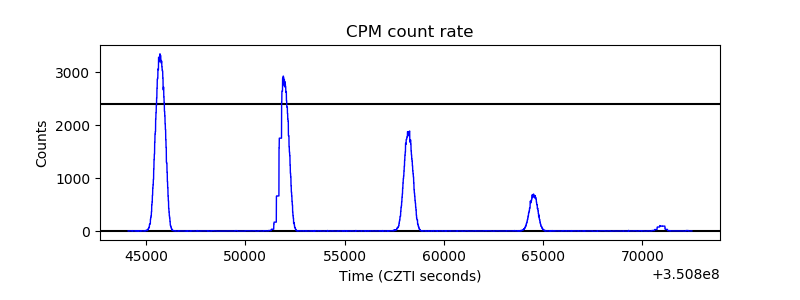 |
| CZT Counter | 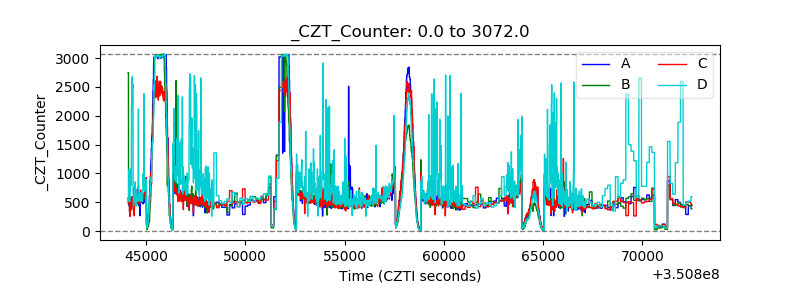 |
| +2.5 Volts monitor |  |
| +5 Volts monitor |  |
| _ROLL_ROT | 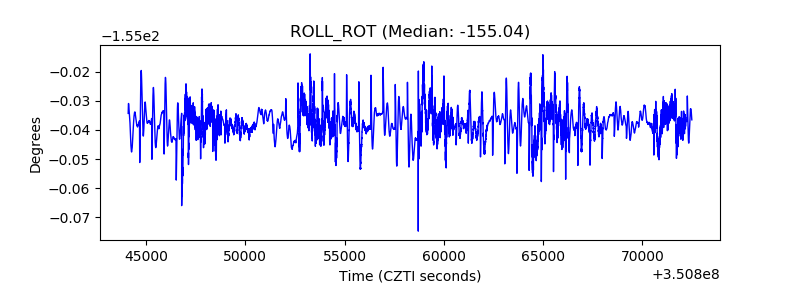 |
| _Roll_DEC | 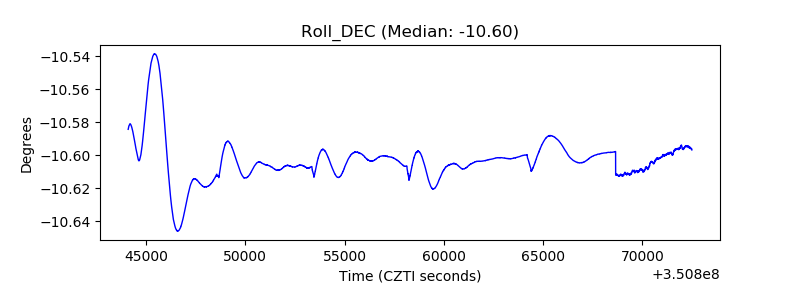 |
| _Roll_RA | 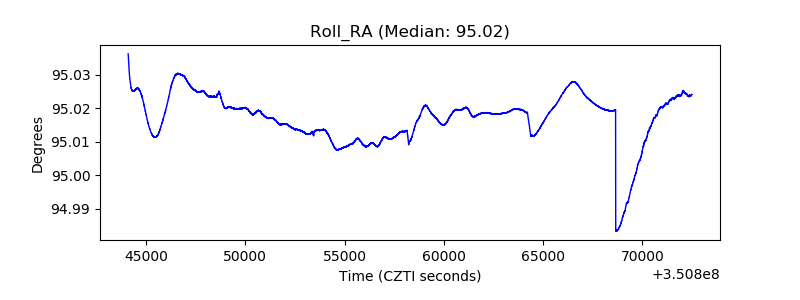 |
| Veto Counter | 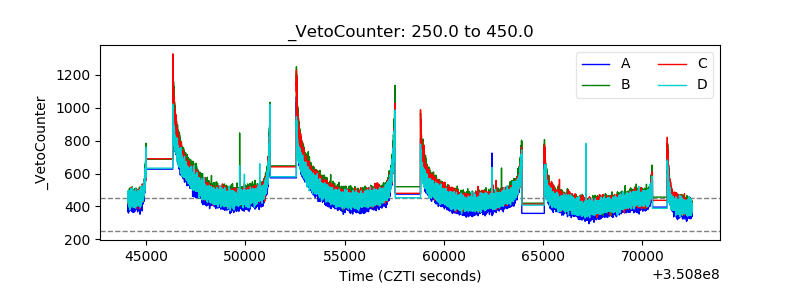 |