| Param | Original file | Final file |
|---|---|---|
| Filename | modeM0/AS1A10_115T01_9000004178_29080cztM0_level2.evt | modeM0/AS1A10_115T01_9000004178_29080cztM0_level2_quad_clean.evt |
| Size (bytes) | 536,561,280 | 106,041,600 |
| Size | 511.7 MB | 101.1 MB |
| Events in quadrant A | 3,471,784 | 711,019 |
| Events in quadrant B | 3,549,366 | 729,092 |
| Events in quadrant C | 3,417,097 | 688,956 |
| Events in quadrant D | 5,381,485 | 639,515 |
| Mode SS | |||
|---|---|---|---|
| Quadrant | BADHDUFLAG | Total packets | Discarded packets |
| A | 0 | 128 | 0 |
| B | 0 | 128 | 0 |
| C | 0 | 128 | 0 |
| D | 0 | 128 | 0 |
| Mode M9 | |||
|---|---|---|---|
| Quadrant | BADHDUFLAG | Total packets | Discarded packets |
| A | 0 | 14 | 0 |
| B | 0 | 14 | 0 |
| C | 0 | 14 | 0 |
| D | 0 | 14 | 0 |
| Mode M0 | |||
|---|---|---|---|
| Quadrant | BADHDUFLAG | Total packets | Discarded packets |
| A | 0 | 14284 | 2 |
| B | 0 | 14489 | 2 |
| C | 0 | 13983 | 2 |
| D | 0 | 20385 | 3 |
| Quadrant | Total seconds | Saturated seconds | Saturation percentage |
|---|---|---|---|
| A | 6349 | 103 | 1.622303% |
| B | 6350 | 128 | 2.015748% |
| C | 6350 | 118 | 1.858268% |
| D | 6349 | 376 | 5.922192% |
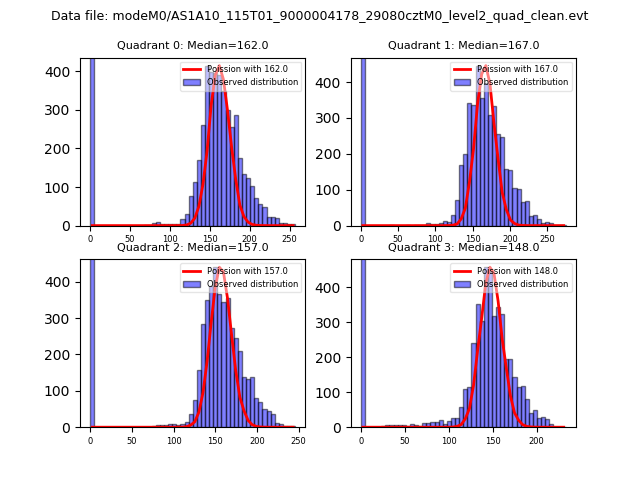
Noise dominated data is calculated using 1-second bins in cleaned event files. If a bin has >2000 counts, and if more than 50% of those come from <1% of pixels, then it is considered to be noise-dominated and hence unusable.
| Quadrant | # 1 sec bins | Bins with >0 counts | Bins with >2000 counts | High rate bins dominated by noise | Noise dominated (total time) | Noise dominated (detector-on time) | Marked lightcurve |
|---|---|---|---|---|---|---|---|
| A | 7669 | 6349 | 2 | 2 | 0.03% | 0.03% | 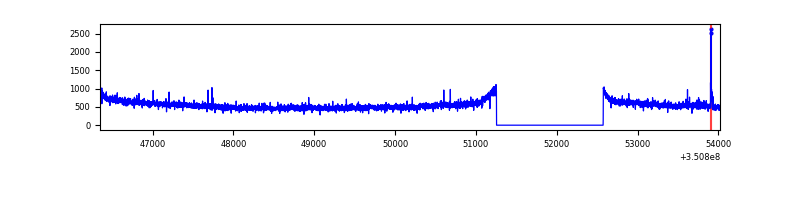 |
| B | 7670 | 6350 | 6 | 6 | 0.08% | 0.09% | 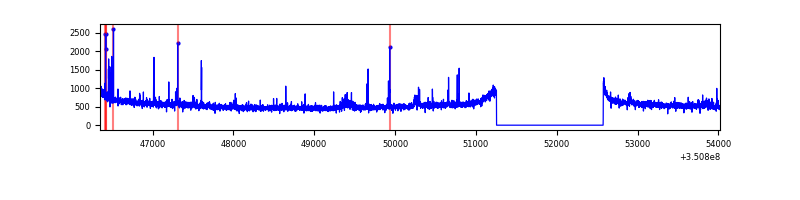 |
| C | 7670 | 6350 | 0 | 0 | 0.00% | 0.00% | 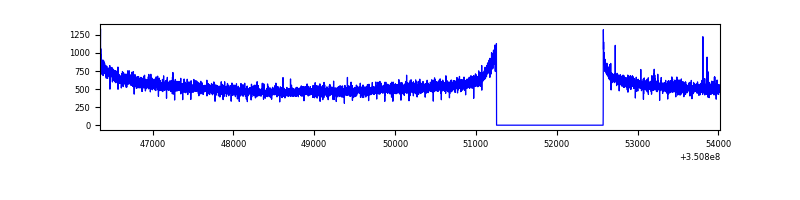 |
| D | 7669 | 6349 | 296 | 296 | 3.86% | 4.66% | 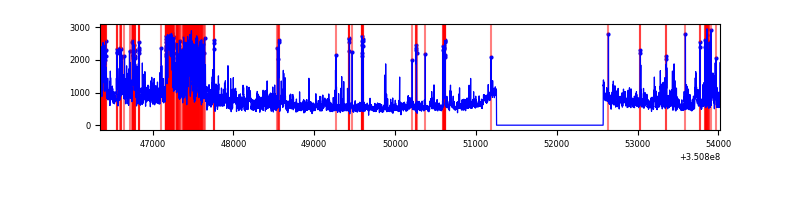 |
Top three noisy pixels from each quadrant. If the there are fewer than three noisy pixels in the level2.evt file, extra rows are filled as -1
| Pixel properties | Quadrant properties | ||||||
|---|---|---|---|---|---|---|---|
| Quadrant | DetID | PixID | Counts | Sigma | Mean | Median | Sigma |
| A | 6 | 16 | 38085 | 212.45 | 885 | 870 | 175.2 |
| A | 0 | 13 | 13900 | 74.39 | 885 | 870 | 175.2 |
| A | 13 | 254 | 11817 | 62.49 | 885 | 870 | 175.2 |
| B | 5 | 255 | 41815 | 248.64 | 878 | 860 | 164.7 |
| B | 0 | 183 | 33777 | 199.84 | 878 | 860 | 164.7 |
| B | 12 | 111 | 19060 | 110.49 | 878 | 860 | 164.7 |
| C | 14 | 238 | 135317 | 692.22 | 834 | 842 | 194.3 |
| C | 2 | 114 | 15527 | 75.59 | 834 | 842 | 194.3 |
| C | 2 | 16 | 15059 | 73.18 | 834 | 842 | 194.3 |
| D | 1 | 52 | 1186354 | 6065.97 | 825 | 803 | 195.4 |
| D | 8 | 195 | 927361 | 4740.81 | 825 | 803 | 195.4 |
| D | 12 | 233 | 85087 | 431.25 | 825 | 803 | 195.4 |
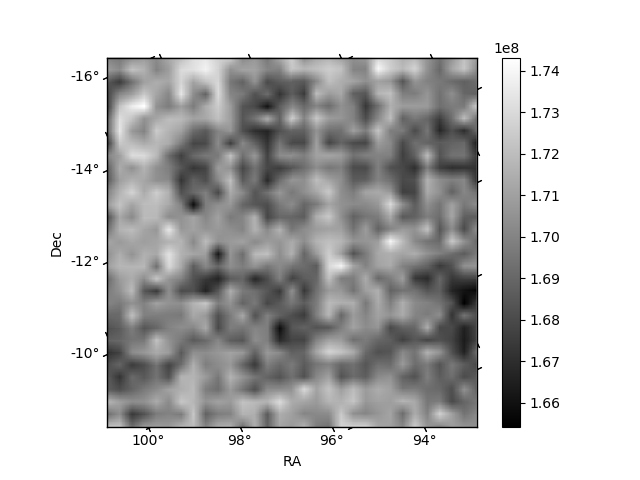
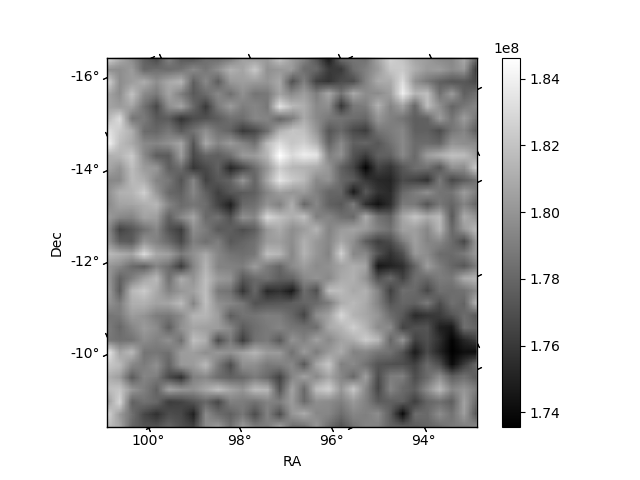
Histogram calculated using DETX and DETY for each event in the final _common_clean file
| Quadrant A |  |
 |
Quadrant B |
|---|---|---|---|
| Quadrant D |  |
 |
Quadrant C |
| Plot type | Count rate plots | Images |
|---|---|---|
| Comparison with Poisson distribution Blue bars denote a histogram of data divided into 1 sec bins. Red curve is a Poisson curve with rate = median count rate of data. |
 |
 |
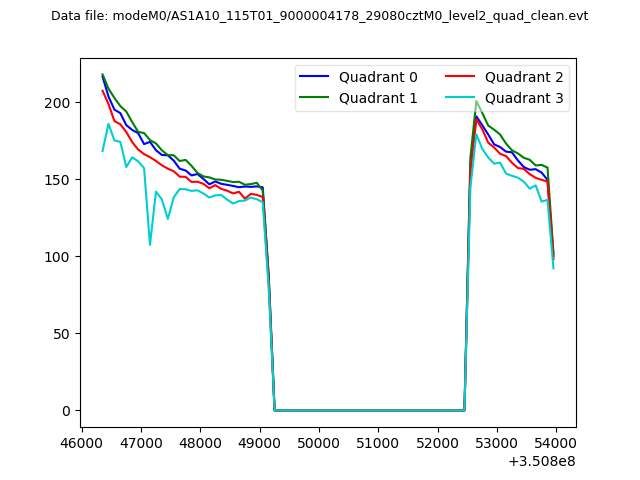
| Quadrant-wise count rates Data is divided into 100 sec bins |
 |
|
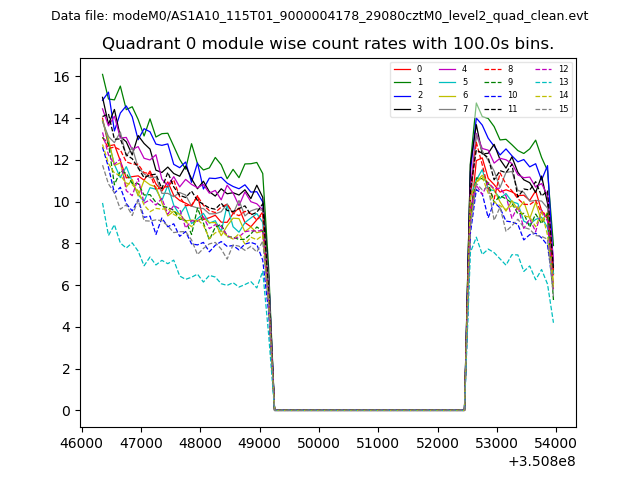
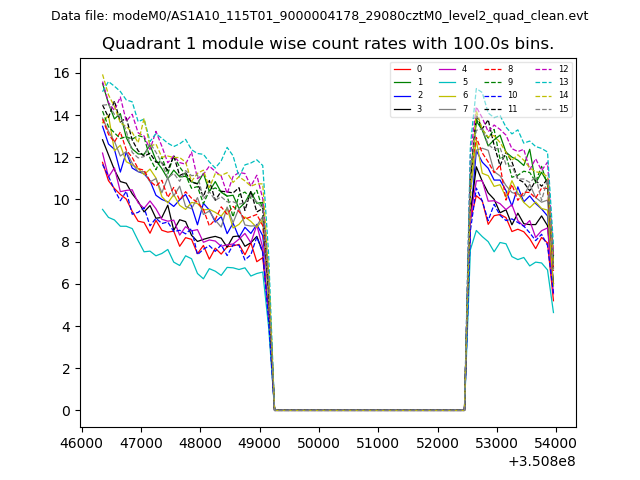
| Module-wise count rates for Quadrant A Data is divided into 100 sec bins |
 |
 |
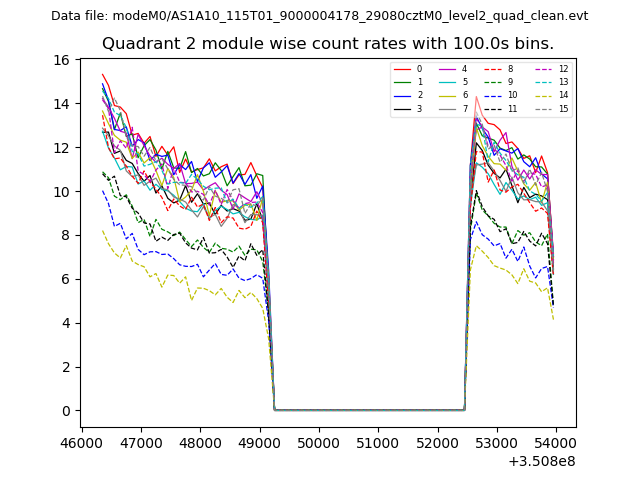
| Module-wise count rates for Quadrant B Data is divided into 100 sec bins |
 |
 |
| Module-wise count rates for Quadrant C Data is divided into 100 sec bins |
 |
 |
| Module-wise count rates for Quadrant D Data is divided into 100 sec bins |
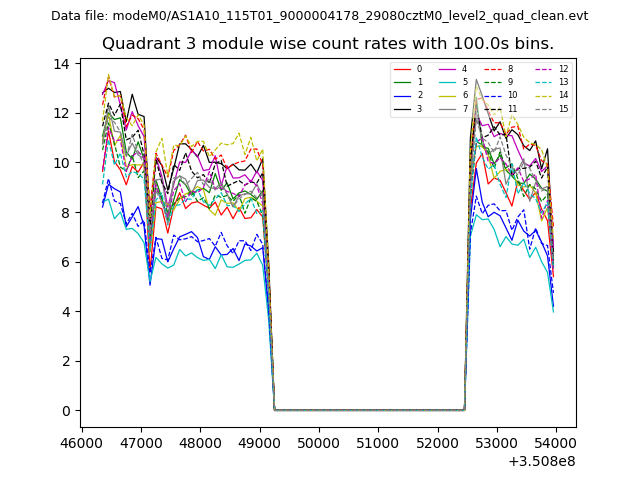 |
 |
| Parameter | Plot |
|---|---|
| CZT HV Monitor | 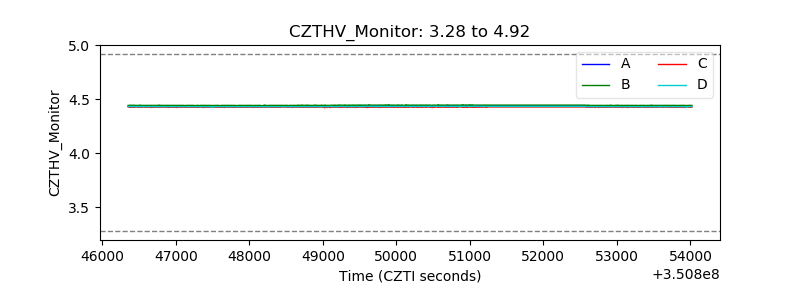 |
| D_VDD | 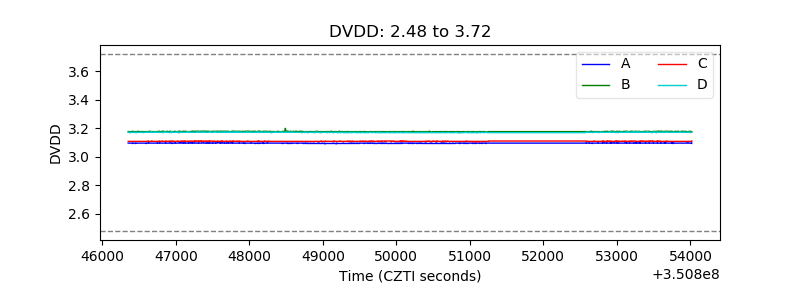 |
| Temperature 1 | 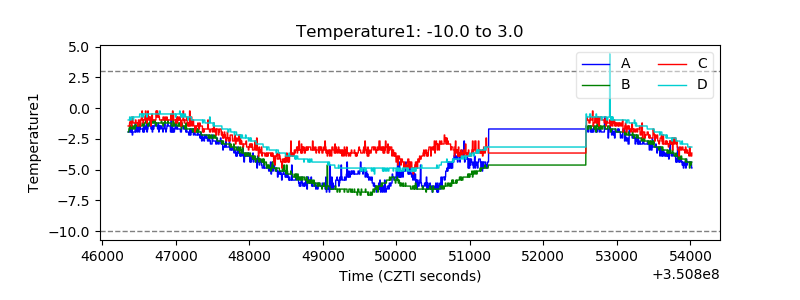 |
| Veto HV Monitor | 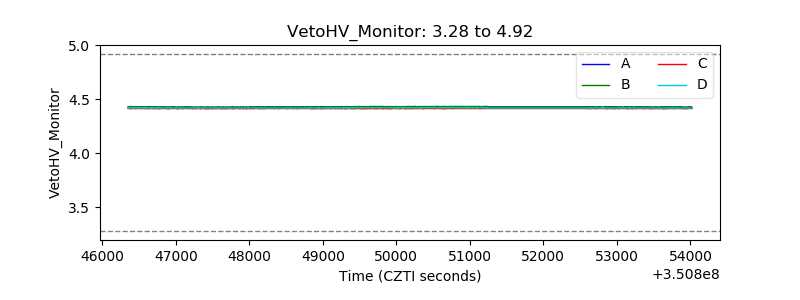 |
| Veto LLD | 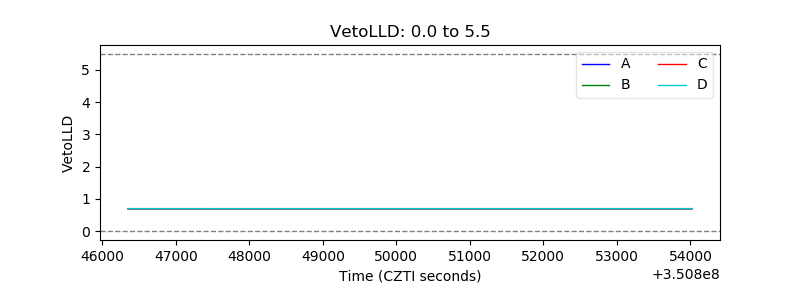 |
| Alpha Counter | 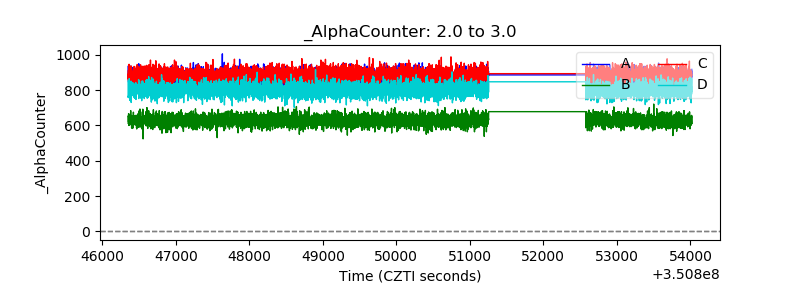 |
| _CPM_Rate | 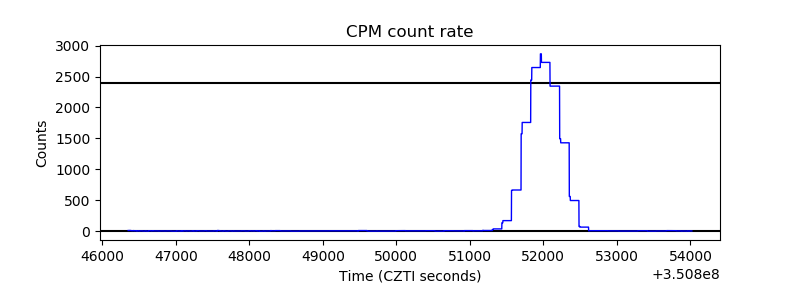 |
| CZT Counter | 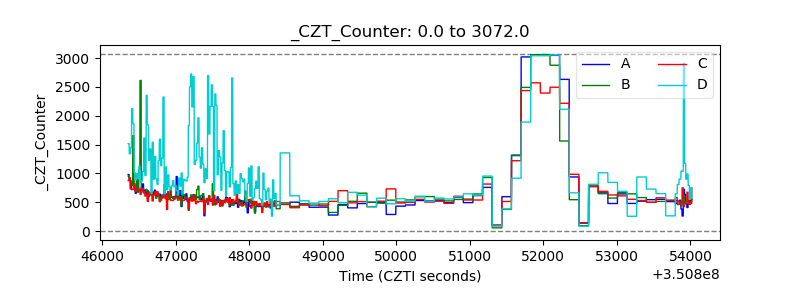 |
| +2.5 Volts monitor | 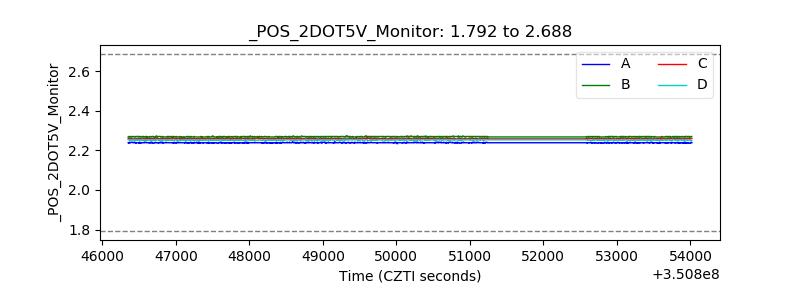 |
| +5 Volts monitor |  |
| _ROLL_ROT | 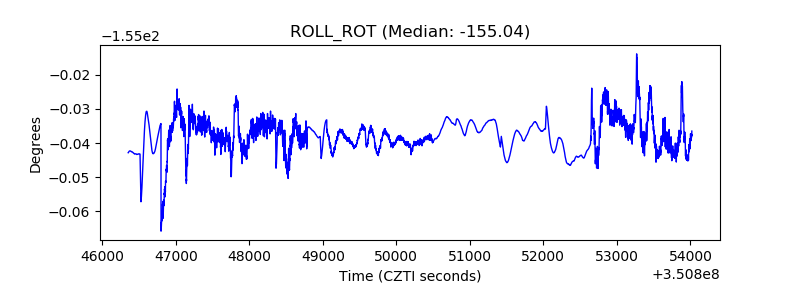 |
| _Roll_DEC | 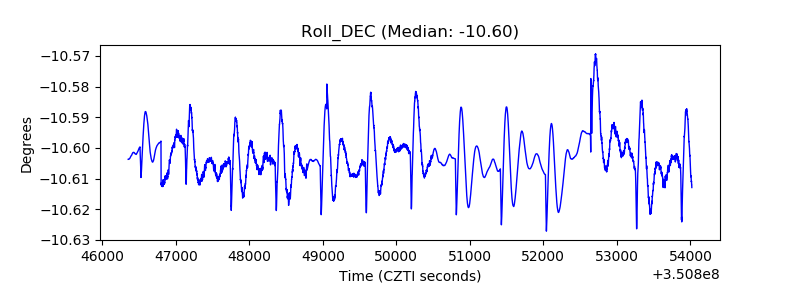 |
| _Roll_RA | 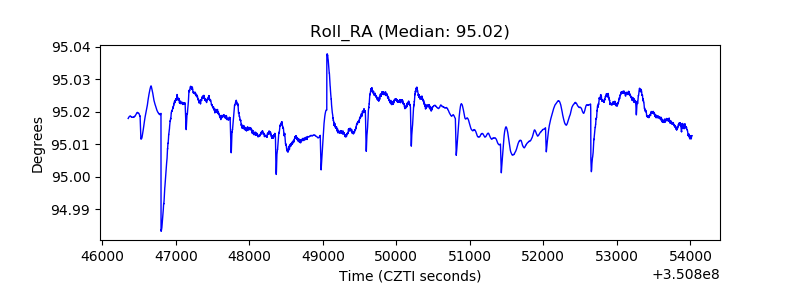 |
| Veto Counter | 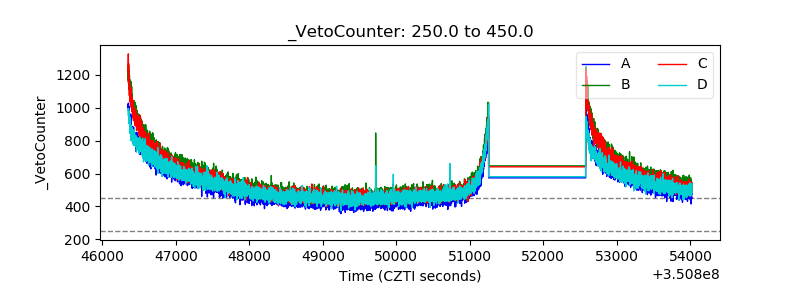 |