| Param | Original file | Final file |
|---|---|---|
| Filename | modeM0/AS1A10_115T01_9000004178_29081cztM0_level2.evt | modeM0/AS1A10_115T01_9000004178_29081cztM0_level2_quad_clean.evt |
| Size (bytes) | 499,155,840 | 96,053,760 |
| Size | 476.0 MB | 91.6 MB |
| Events in quadrant A | 3,431,259 | 626,145 |
| Events in quadrant B | 3,381,455 | 646,487 |
| Events in quadrant C | 3,314,236 | 617,223 |
| Events in quadrant D | 4,565,177 | 582,006 |
| Mode SS | |||
|---|---|---|---|
| Quadrant | BADHDUFLAG | Total packets | Discarded packets |
| A | 0 | 126 | 0 |
| B | 0 | 126 | 0 |
| C | 0 | 126 | 0 |
| D | 0 | 126 | 0 |
| Mode M9 | |||
|---|---|---|---|
| Quadrant | BADHDUFLAG | Total packets | Discarded packets |
| A | 0 | 14 | 0 |
| B | 0 | 15 | 0 |
| C | 0 | 15 | 0 |
| D | 0 | 15 | 0 |
| Mode M0 | |||
|---|---|---|---|
| Quadrant | BADHDUFLAG | Total packets | Discarded packets |
| A | 0 | 14042 | 2 |
| B | 0 | 13827 | 2 |
| C | 0 | 13600 | 2 |
| D | 0 | 17828 | 3 |
| Quadrant | Total seconds | Saturated seconds | Saturation percentage |
|---|---|---|---|
| A | 6267 | 116 | 1.850965% |
| B | 6267 | 138 | 2.202011% |
| C | 6267 | 134 | 2.138184% |
| D | 6266 | 193 | 3.080115% |
Noise dominated data is calculated using 1-second bins in cleaned event files. If a bin has >2000 counts, and if more than 50% of those come from <1% of pixels, then it is considered to be noise-dominated and hence unusable.
| Quadrant | # 1 sec bins | Bins with >0 counts | Bins with >2000 counts | High rate bins dominated by noise | Noise dominated (total time) | Noise dominated (detector-on time) | Marked lightcurve |
|---|---|---|---|---|---|---|---|
| A | 7542 | 6267 | 5 | 5 | 0.07% | 0.08% | 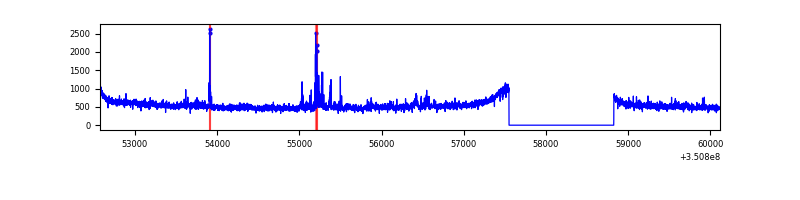 |
| B | 7542 | 6267 | 2 | 2 | 0.03% | 0.03% | 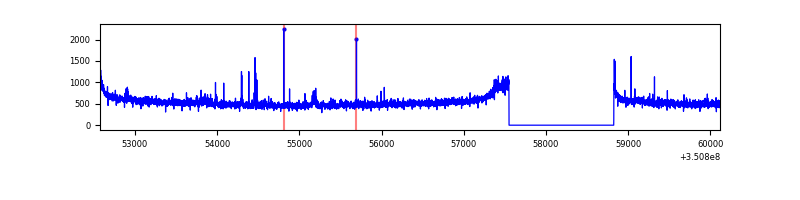 |
| C | 7542 | 6267 | 1 | 1 | 0.01% | 0.02% | 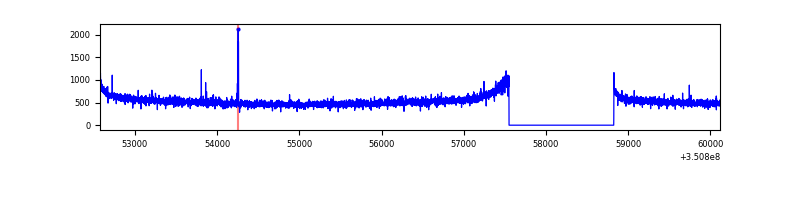 |
| D | 7541 | 6266 | 153 | 153 | 2.03% | 2.44% | 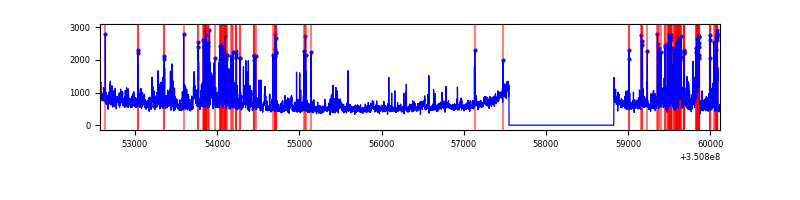 |
Top three noisy pixels from each quadrant. If the there are fewer than three noisy pixels in the level2.evt file, extra rows are filled as -1
| Pixel properties | Quadrant properties | ||||||
|---|---|---|---|---|---|---|---|
| Quadrant | DetID | PixID | Counts | Sigma | Mean | Median | Sigma |
| A | 0 | 13 | 115319 | 679.0 | 845 | 831 | 168.6 |
| A | 6 | 16 | 55801 | 326.01 | 845 | 831 | 168.6 |
| A | 13 | 254 | 11310 | 62.15 | 845 | 831 | 168.6 |
| B | 5 | 255 | 21214 | 128.0 | 846 | 829 | 159.3 |
| B | 12 | 111 | 19032 | 114.3 | 846 | 829 | 159.3 |
| B | 11 | 111 | 16881 | 100.8 | 846 | 829 | 159.3 |
| C | 14 | 238 | 130210 | 688.81 | 806 | 815 | 187.9 |
| C | 2 | 16 | 18201 | 92.55 | 806 | 815 | 187.9 |
| C | 2 | 114 | 15245 | 76.81 | 806 | 815 | 187.9 |
| D | 8 | 195 | 764219 | 4024.19 | 802 | 783 | 189.7 |
| D | 1 | 52 | 694812 | 3658.34 | 802 | 783 | 189.7 |
| D | 12 | 233 | 46388 | 240.39 | 802 | 783 | 189.7 |
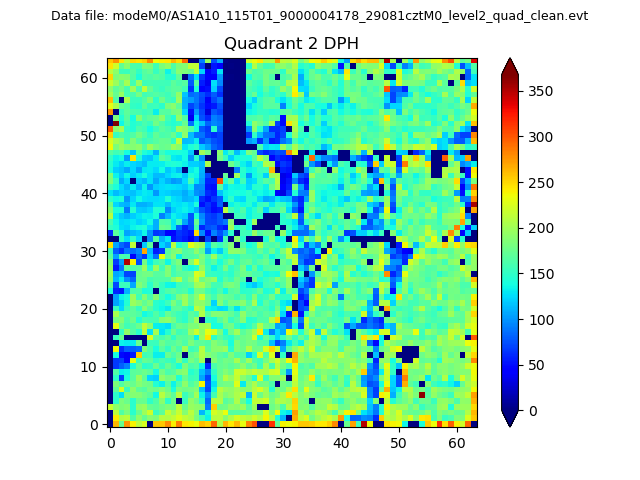
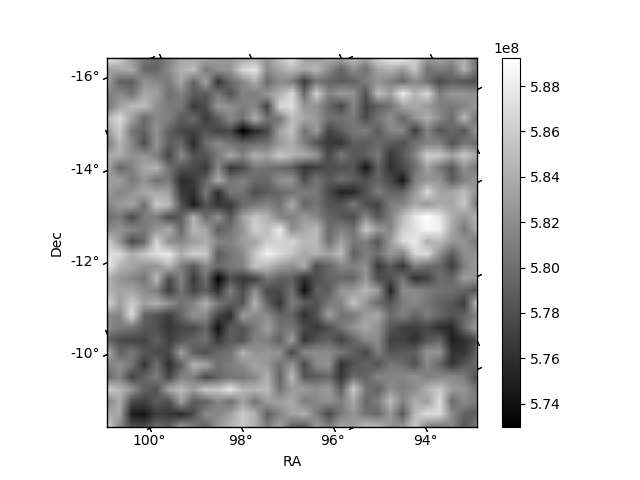
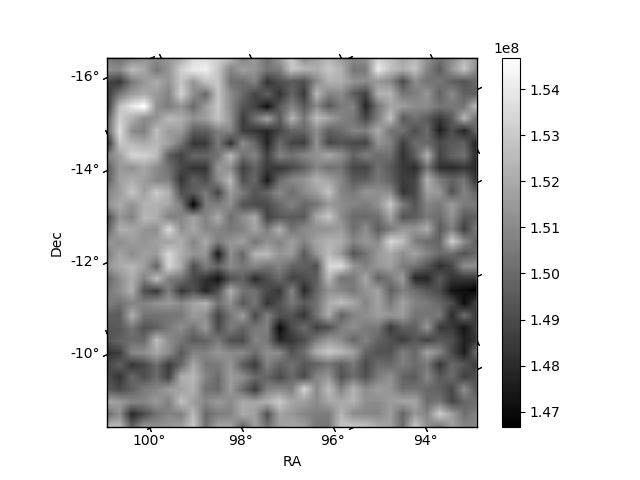
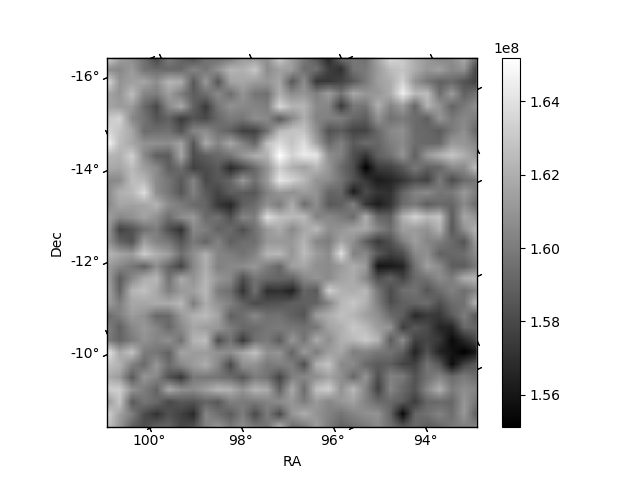
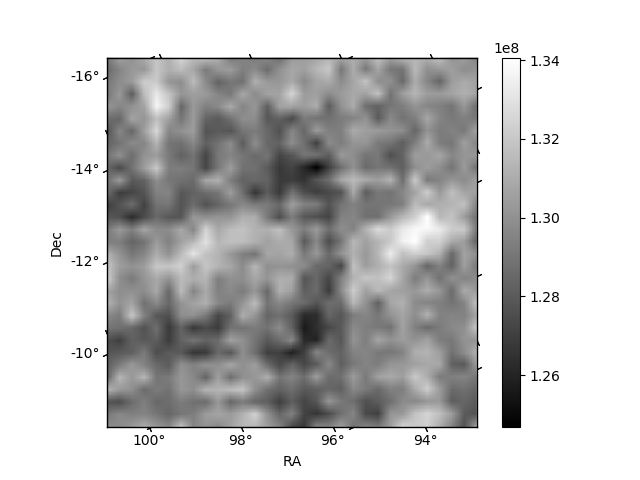
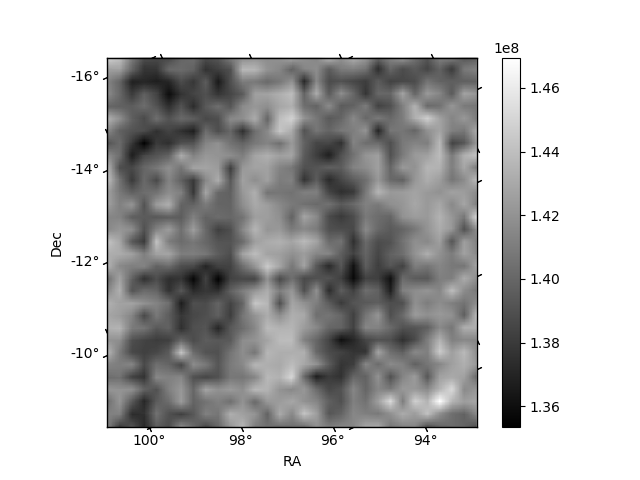
Histogram calculated using DETX and DETY for each event in the final _common_clean file
| Quadrant A | 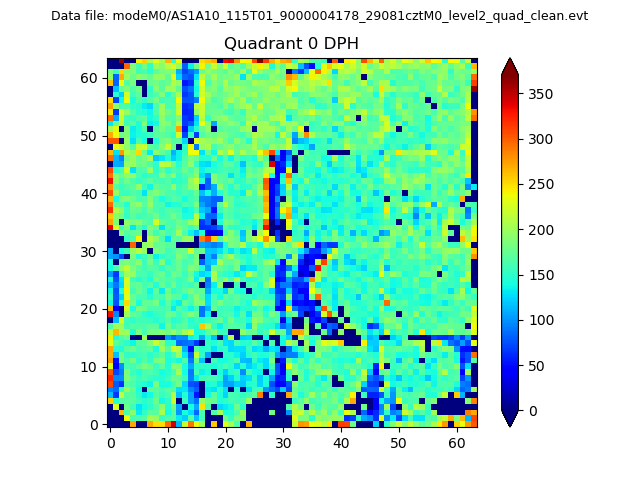 |
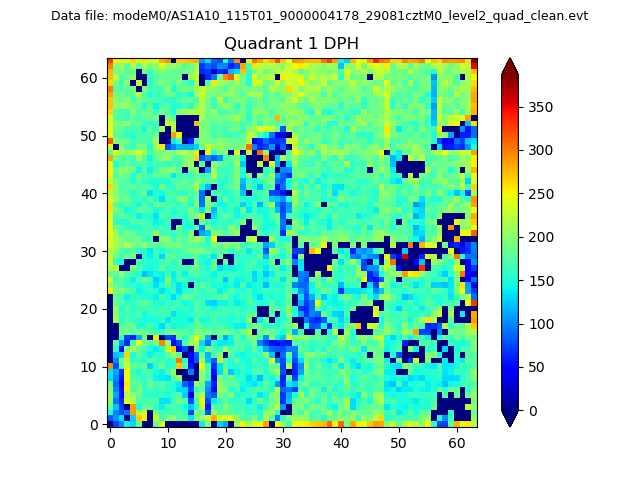 |
Quadrant B |
|---|---|---|---|
| Quadrant D | 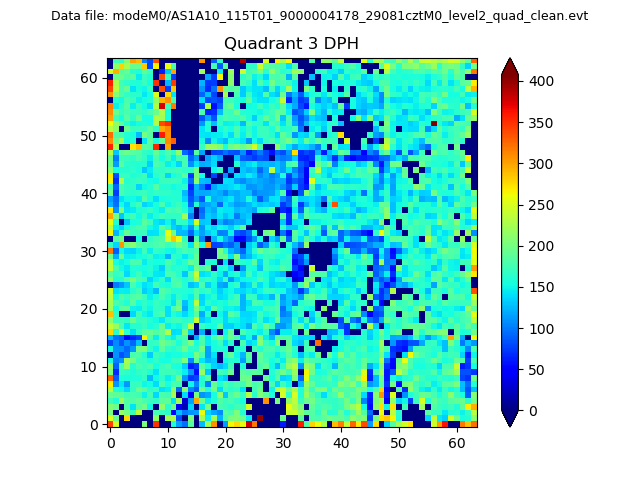 |
 |
Quadrant C |
| Plot type | Count rate plots | Images |
|---|---|---|
| Comparison with Poisson distribution Blue bars denote a histogram of data divided into 1 sec bins. Red curve is a Poisson curve with rate = median count rate of data. |
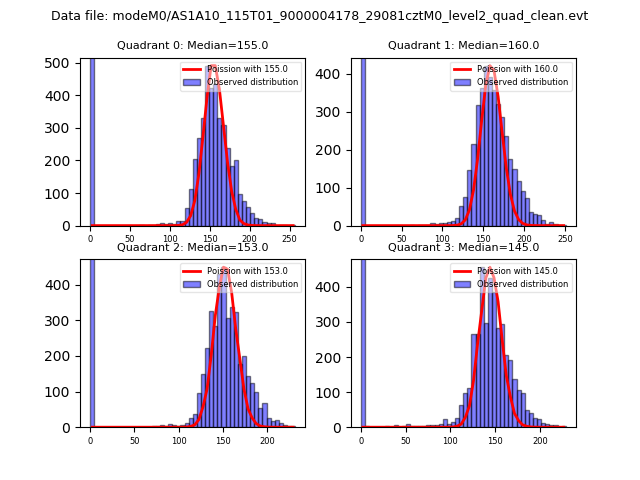 |
 |
| Quadrant-wise count rates Data is divided into 100 sec bins |
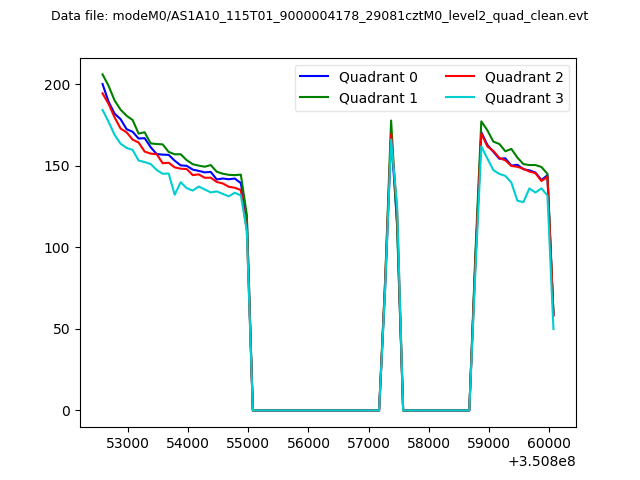 |
|
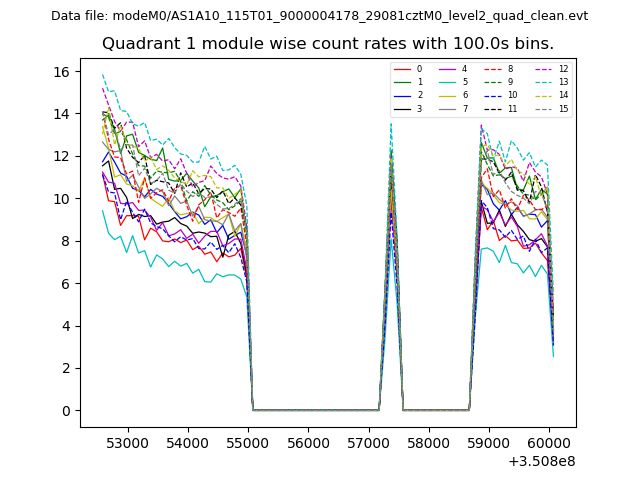
| Module-wise count rates for Quadrant A Data is divided into 100 sec bins |
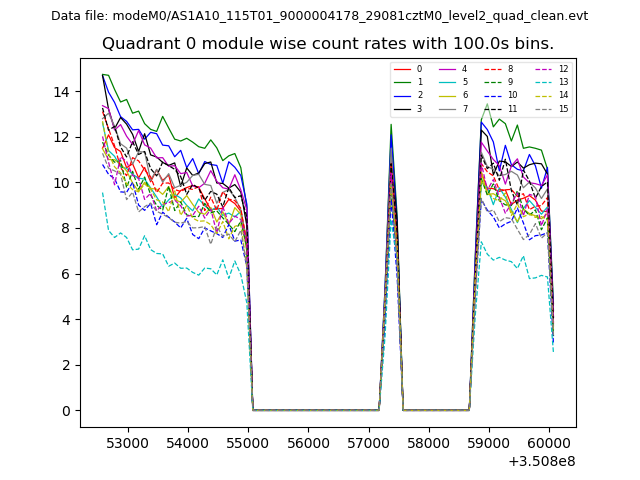 |
 |
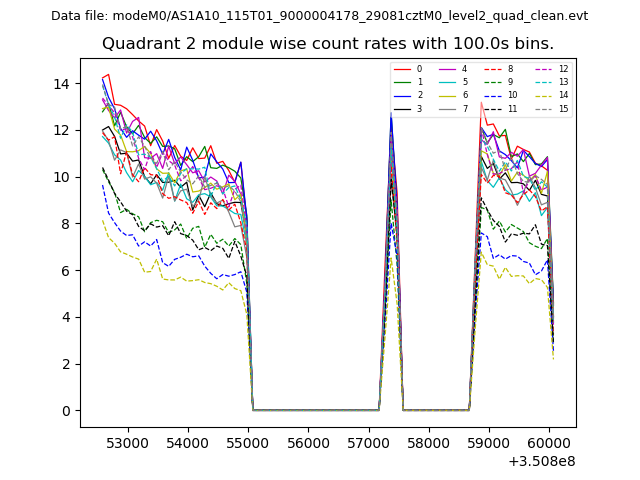
| Module-wise count rates for Quadrant B Data is divided into 100 sec bins |
 |
 |
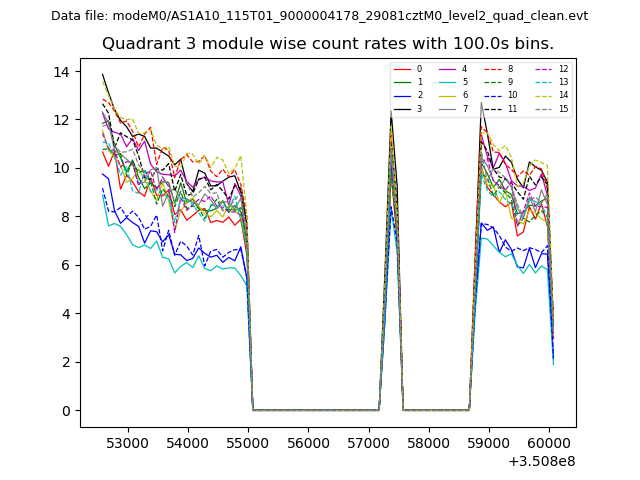
| Module-wise count rates for Quadrant C Data is divided into 100 sec bins |
 |
 |
| Module-wise count rates for Quadrant D Data is divided into 100 sec bins |
 |
 |
| Parameter | Plot |
|---|---|
| CZT HV Monitor | 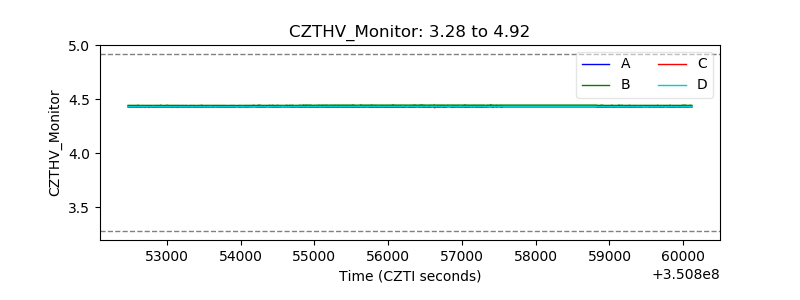 |
| D_VDD | 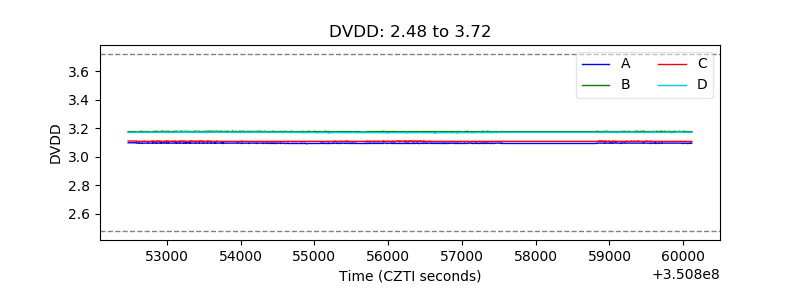 |
| Temperature 1 | 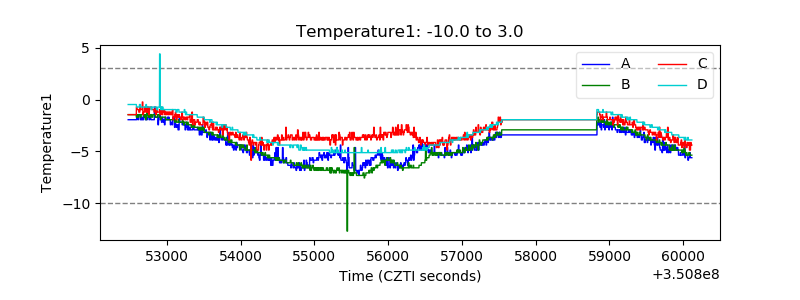 |
| Veto HV Monitor | 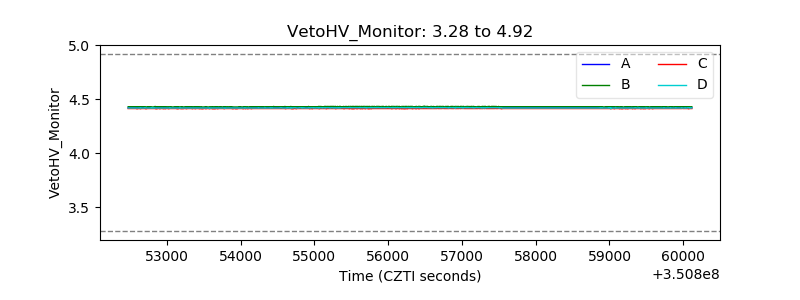 |
| Veto LLD | 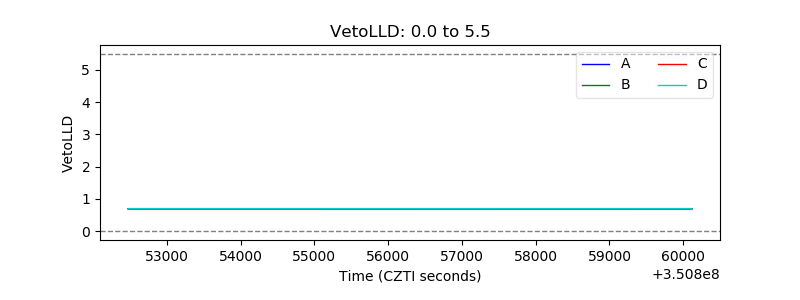 |
| Alpha Counter | 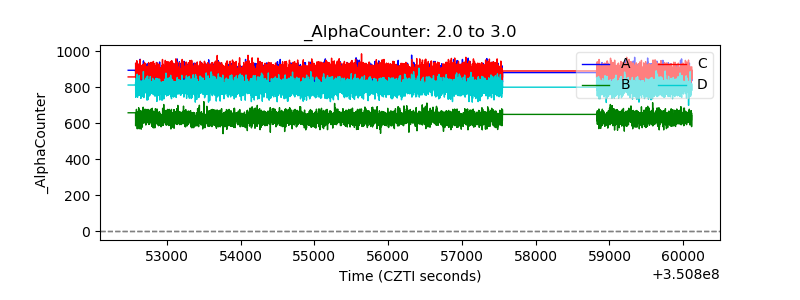 |
| _CPM_Rate | 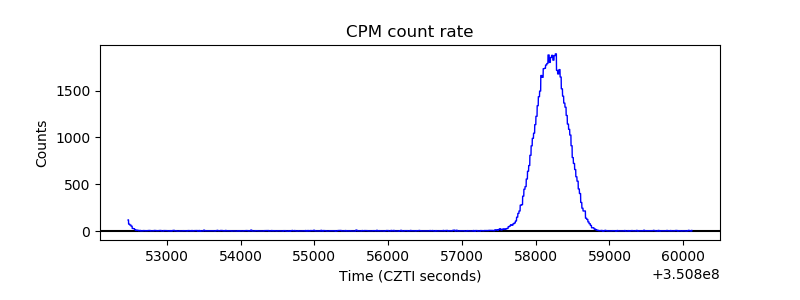 |
| CZT Counter | 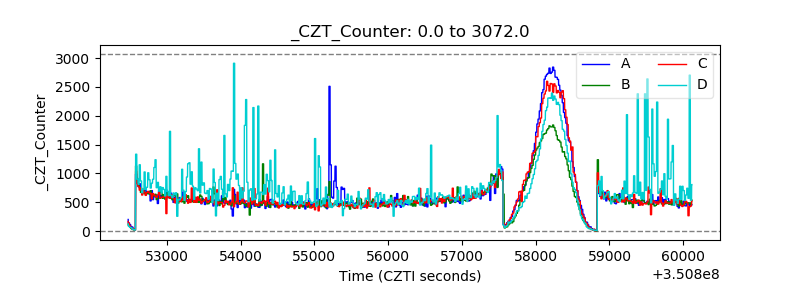 |
| +2.5 Volts monitor |  |
| +5 Volts monitor |  |
| _ROLL_ROT | 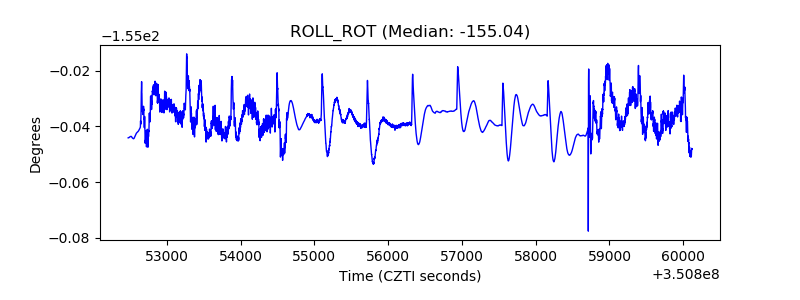 |
| _Roll_DEC | 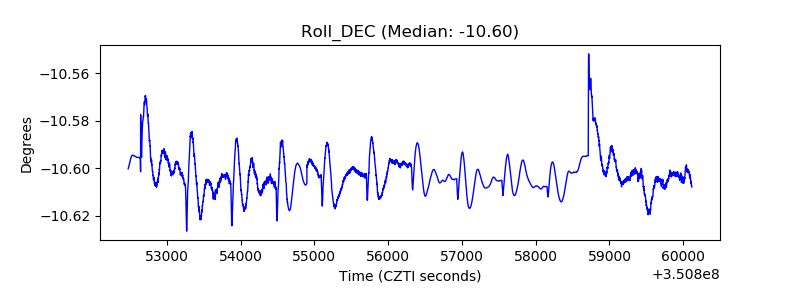 |
| _Roll_RA | 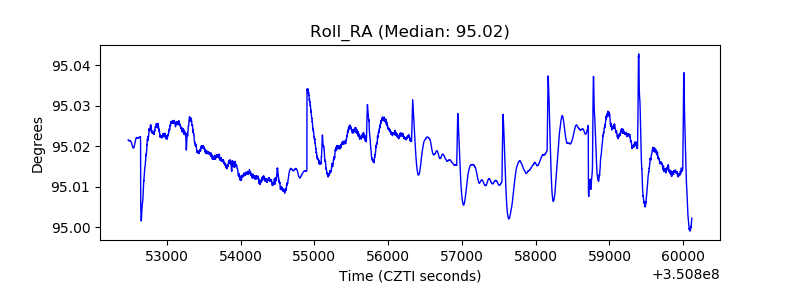 |
| Veto Counter | 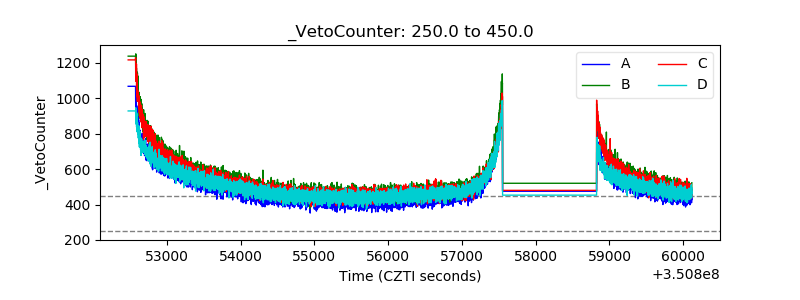 |