| Param | Original file | Final file |
|---|---|---|
| Filename | modeM0/AS1A10_115T01_9000004178_29082cztM0_level2.evt | modeM0/AS1A10_115T01_9000004178_29082cztM0_level2_quad_clean.evt |
| Size (bytes) | 500,195,520 | 93,029,760 |
| Size | 477.0 MB | 88.7 MB |
| Events in quadrant A | 3,185,756 | 600,580 |
| Events in quadrant B | 3,353,670 | 619,255 |
| Events in quadrant C | 3,219,843 | 595,526 |
| Events in quadrant D | 4,954,592 | 554,998 |
| Mode SS | |||
|---|---|---|---|
| Quadrant | BADHDUFLAG | Total packets | Discarded packets |
| A | 0 | 130 | 0 |
| B | 0 | 130 | 0 |
| C | 0 | 130 | 0 |
| D | 0 | 130 | 0 |
| Mode M9 | |||
|---|---|---|---|
| Quadrant | BADHDUFLAG | Total packets | Discarded packets |
| A | 0 | 22 | 0 |
| B | 0 | 23 | 0 |
| C | 0 | 23 | 0 |
| D | 0 | 23 | 0 |
| Mode M0 | |||
|---|---|---|---|
| Quadrant | BADHDUFLAG | Total packets | Discarded packets |
| A | 0 | 13542 | 2 |
| B | 0 | 13877 | 2 |
| C | 0 | 13497 | 2 |
| D | 0 | 19095 | 2 |
| Quadrant | Total seconds | Saturated seconds | Saturation percentage |
|---|---|---|---|
| A | 6406 | 36 | 0.561973% |
| B | 6406 | 57 | 0.889791% |
| C | 6406 | 61 | 0.952232% |
| D | 6406 | 287 | 4.480175% |
Noise dominated data is calculated using 1-second bins in cleaned event files. If a bin has >2000 counts, and if more than 50% of those come from <1% of pixels, then it is considered to be noise-dominated and hence unusable.
| Quadrant | # 1 sec bins | Bins with >0 counts | Bins with >2000 counts | High rate bins dominated by noise | Noise dominated (total time) | Noise dominated (detector-on time) | Marked lightcurve |
|---|---|---|---|---|---|---|---|
| A | 7546 | 6406 | 0 | 0 | 0.00% | 0.00% | 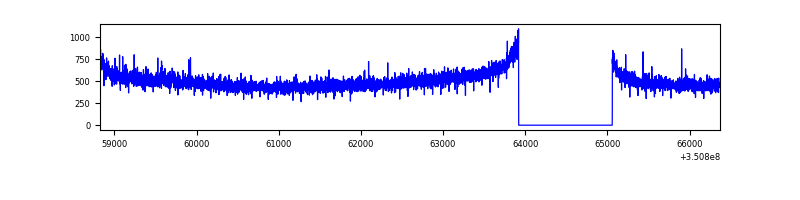 |
| B | 7545 | 6405 | 4 | 4 | 0.05% | 0.06% | 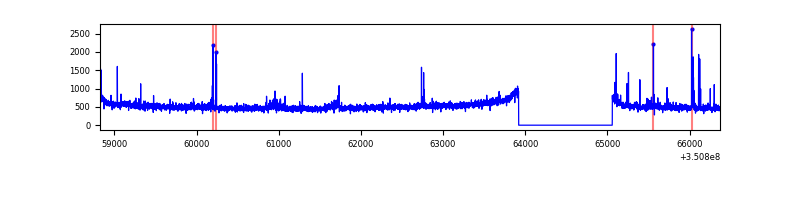 |
| C | 7545 | 6405 | 0 | 0 | 0.00% | 0.00% | 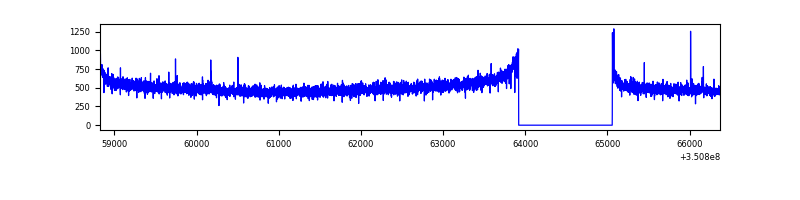 |
| D | 7546 | 6406 | 293 | 293 | 3.88% | 4.57% | 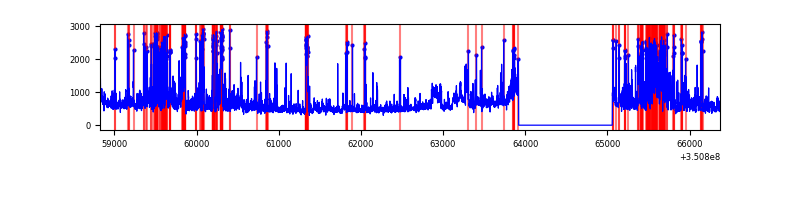 |
Top three noisy pixels from each quadrant. If the there are fewer than three noisy pixels in the level2.evt file, extra rows are filled as -1
| Pixel properties | Quadrant properties | ||||||
|---|---|---|---|---|---|---|---|
| Quadrant | DetID | PixID | Counts | Sigma | Mean | Median | Sigma |
| A | 13 | 254 | 11980 | 67.6 | 820 | 806 | 165.3 |
| A | 6 | 16 | 10235 | 57.04 | 820 | 806 | 165.3 |
| A | 0 | 13 | 8396 | 45.91 | 820 | 806 | 165.3 |
| B | 0 | 183 | 40263 | 254.33 | 821 | 800 | 155.2 |
| B | 0 | 230 | 31496 | 197.83 | 821 | 800 | 155.2 |
| B | 5 | 255 | 24652 | 153.72 | 821 | 800 | 155.2 |
| C | 14 | 238 | 128493 | 697.11 | 786 | 793 | 183.2 |
| C | 2 | 114 | 15506 | 80.32 | 786 | 793 | 183.2 |
| C | 2 | 16 | 5605 | 26.27 | 786 | 793 | 183.2 |
| D | 1 | 52 | 890635 | 4821.2 | 775 | 754 | 184.6 |
| D | 8 | 195 | 750813 | 4063.67 | 775 | 754 | 184.6 |
| D | 12 | 233 | 336517 | 1819.1 | 775 | 754 | 184.6 |
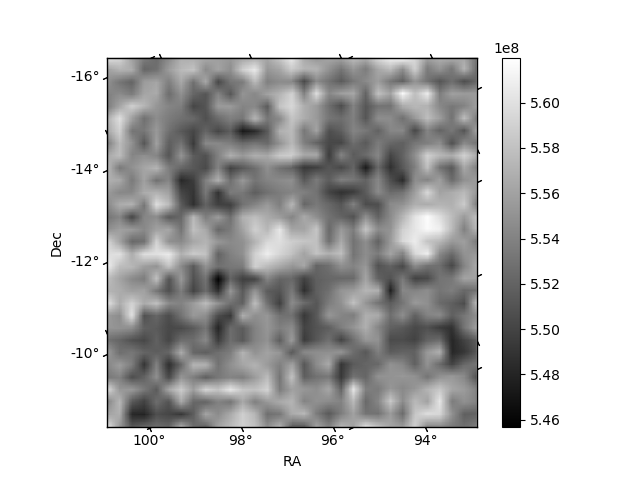
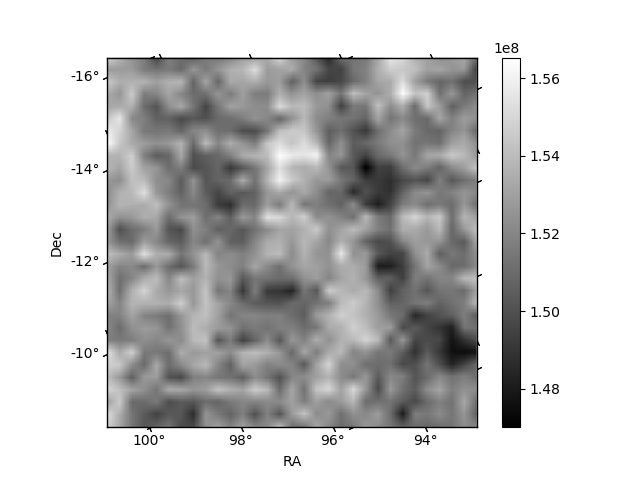
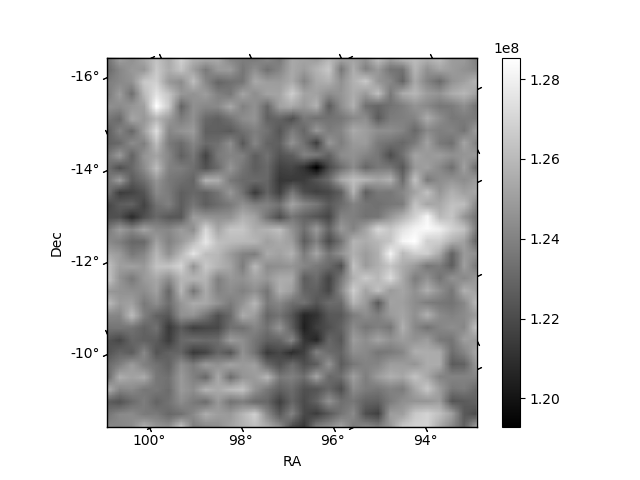
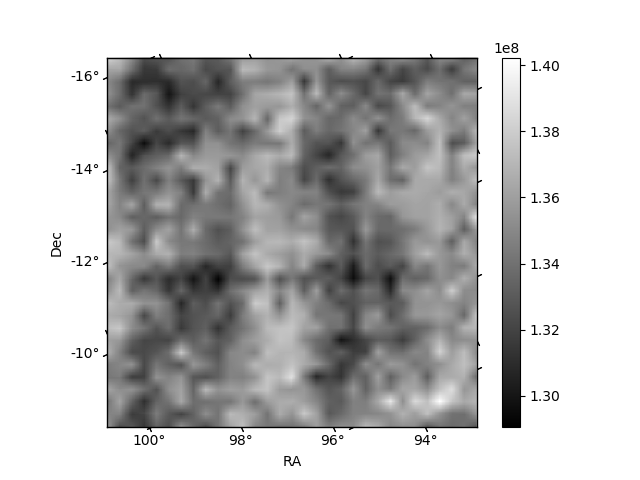
Histogram calculated using DETX and DETY for each event in the final _common_clean file
| Quadrant A | 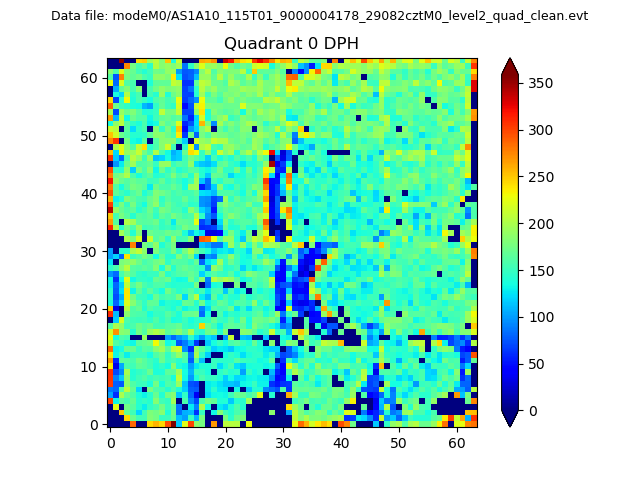 |
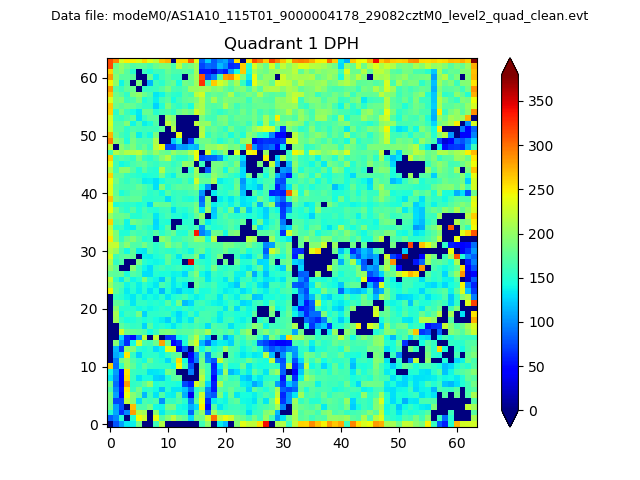 |
Quadrant B |
|---|---|---|---|
| Quadrant D | 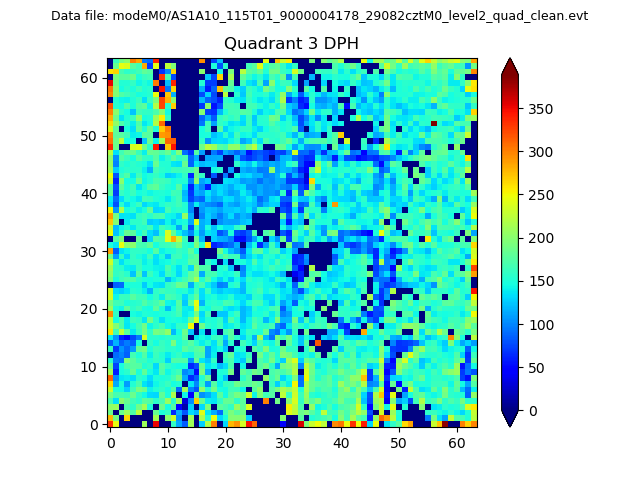 |
 |
Quadrant C |
| Plot type | Count rate plots | Images |
|---|---|---|
| Comparison with Poisson distribution Blue bars denote a histogram of data divided into 1 sec bins. Red curve is a Poisson curve with rate = median count rate of data. |
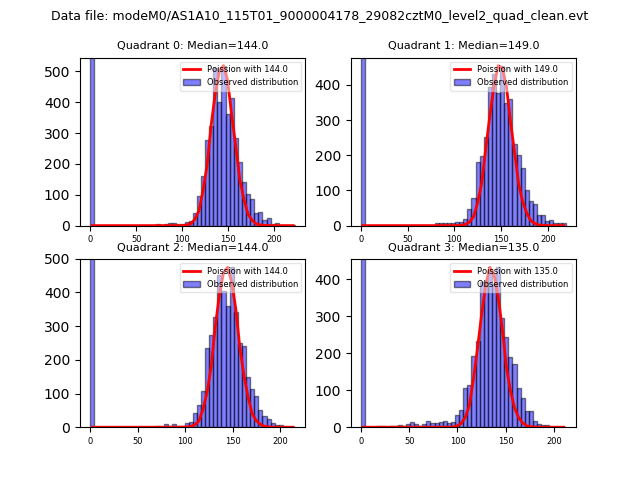 |
 |
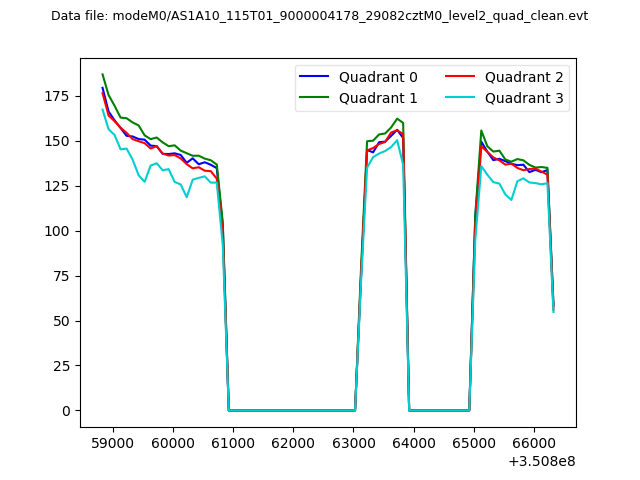
| Quadrant-wise count rates Data is divided into 100 sec bins |
 |
|
| Module-wise count rates for Quadrant A Data is divided into 100 sec bins |
 |
 |
| Module-wise count rates for Quadrant B Data is divided into 100 sec bins |
 |
 |
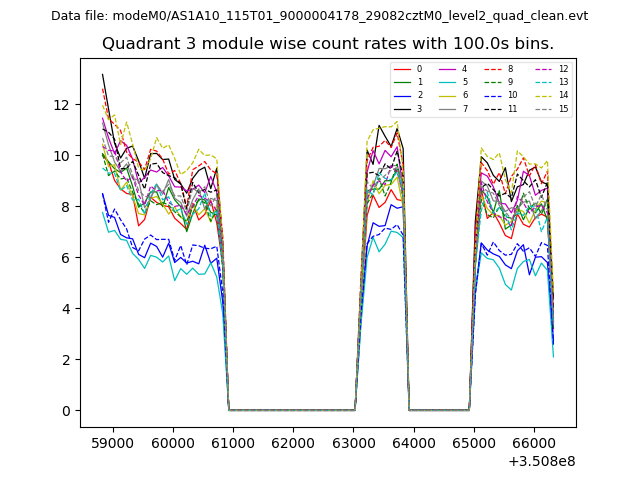
| Module-wise count rates for Quadrant C Data is divided into 100 sec bins |
 |
 |
| Module-wise count rates for Quadrant D Data is divided into 100 sec bins |
 |
 |
| Parameter | Plot |
|---|---|
| CZT HV Monitor | 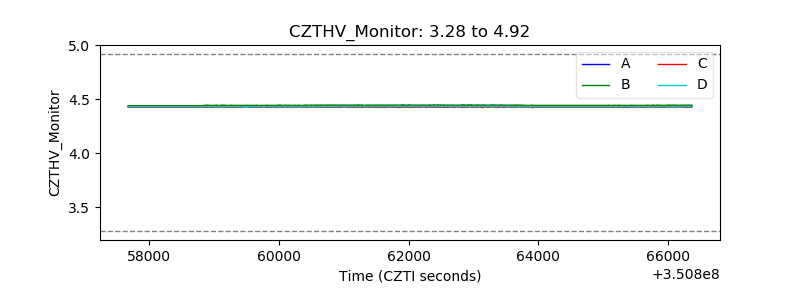 |
| D_VDD |  |
| Temperature 1 | 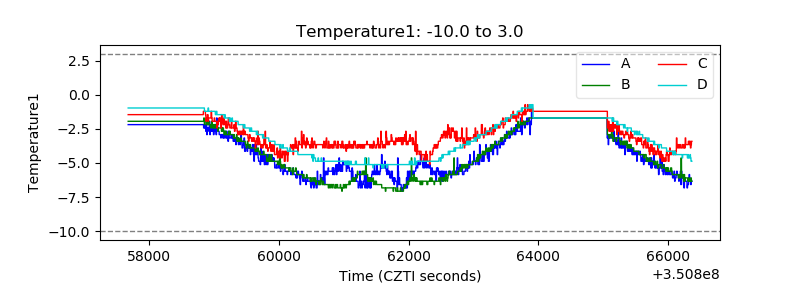 |
| Veto HV Monitor | 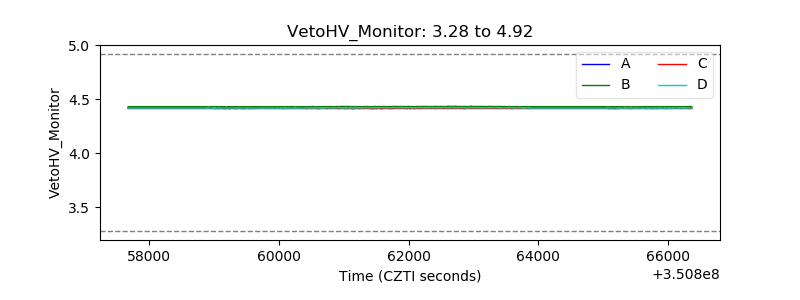 |
| Veto LLD | 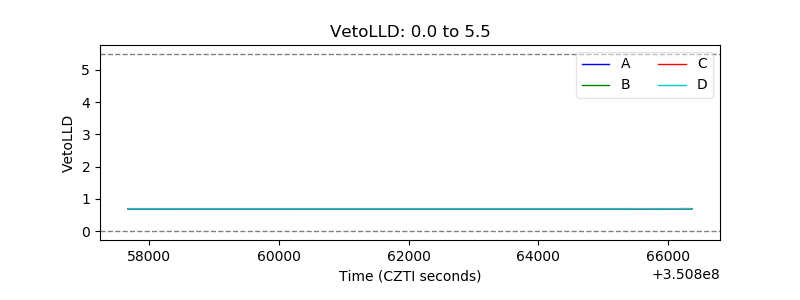 |
| Alpha Counter | 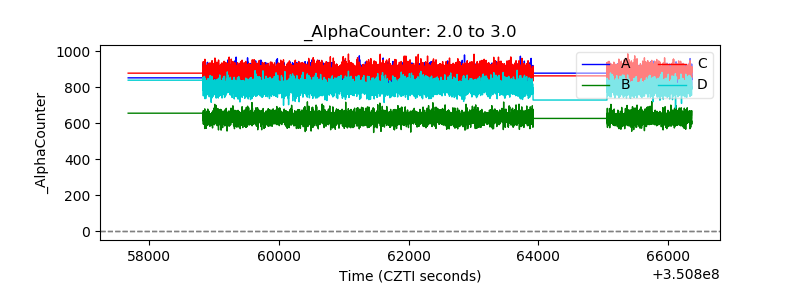 |
| _CPM_Rate | 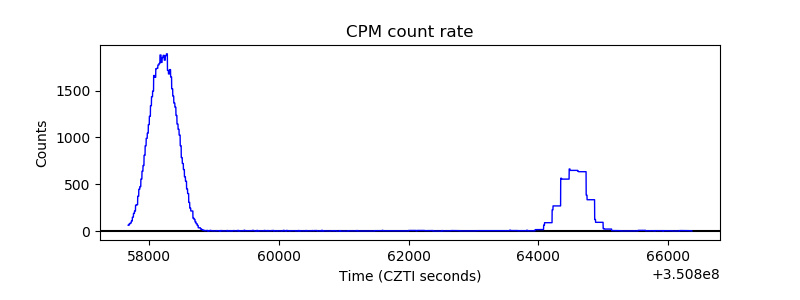 |
| CZT Counter | 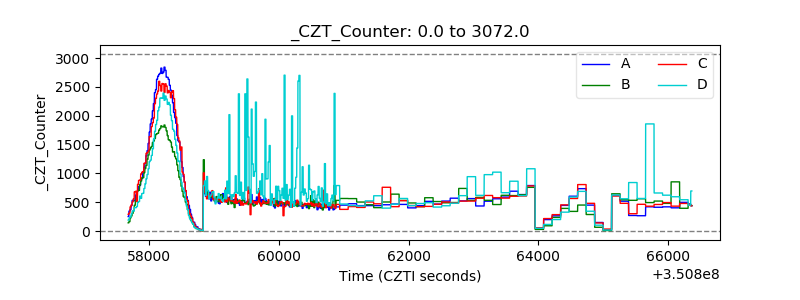 |
| +2.5 Volts monitor |  |
| +5 Volts monitor |  |
| _ROLL_ROT | 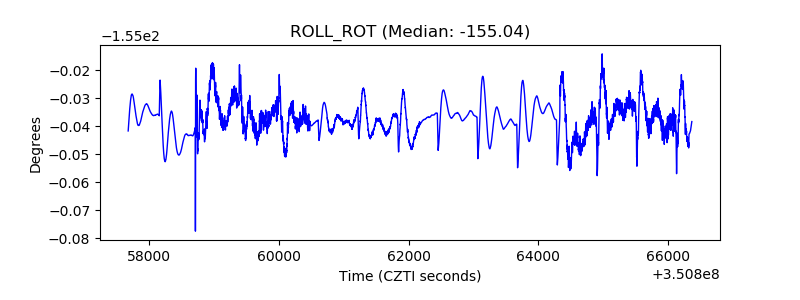 |
| _Roll_DEC | 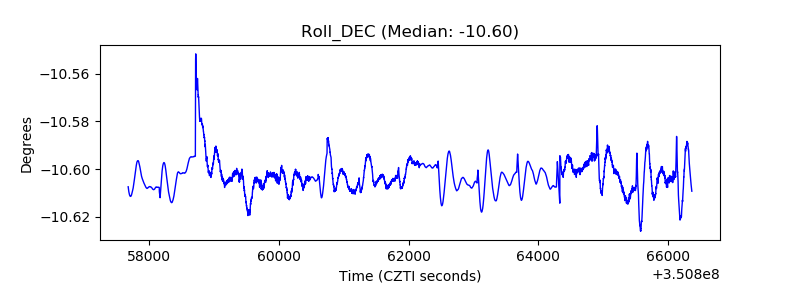 |
| _Roll_RA | 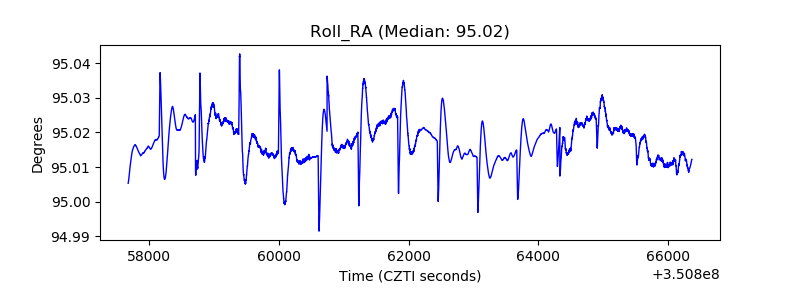 |
| Veto Counter |  |