| Param | Original file | Final file |
|---|---|---|
| Filename | modeM0/AS1A10_115T01_9000004178_29084cztM0_level2.evt | modeM0/AS1A10_115T01_9000004178_29084cztM0_level2_quad_clean.evt |
| Size (bytes) | 563,869,440 | 97,248,960 |
| Size | 537.7 MB | 92.7 MB |
| Events in quadrant A | 3,340,409 | 629,858 |
| Events in quadrant B | 3,521,775 | 645,681 |
| Events in quadrant C | 3,403,093 | 628,050 |
| Events in quadrant D | 6,345,656 | 562,186 |
| Mode SS | |||
|---|---|---|---|
| Quadrant | BADHDUFLAG | Total packets | Discarded packets |
| A | 0 | 144 | 0 |
| B | 0 | 144 | 0 |
| C | 0 | 144 | 0 |
| D | 0 | 144 | 0 |
| Mode M9 | |||
|---|---|---|---|
| Quadrant | BADHDUFLAG | Total packets | Discarded packets |
| A | 0 | 18 | 0 |
| B | 0 | 18 | 0 |
| C | 0 | 18 | 0 |
| D | 0 | 18 | 0 |
| Mode M0 | |||
|---|---|---|---|
| Quadrant | BADHDUFLAG | Total packets | Discarded packets |
| A | 0 | 14341 | 2 |
| B | 0 | 14697 | 2 |
| C | 0 | 14343 | 2 |
| D | 0 | 23585 | 2 |
| Quadrant | Total seconds | Saturated seconds | Saturation percentage |
|---|---|---|---|
| A | 6865 | 50 | 0.728332% |
| B | 6865 | 82 | 1.194465% |
| C | 6866 | 98 | 1.427323% |
| D | 6866 | 715 | 10.413632% |
Noise dominated data is calculated using 1-second bins in cleaned event files. If a bin has >2000 counts, and if more than 50% of those come from <1% of pixels, then it is considered to be noise-dominated and hence unusable.
| Quadrant | # 1 sec bins | Bins with >0 counts | Bins with >2000 counts | High rate bins dominated by noise | Noise dominated (total time) | Noise dominated (detector-on time) | Marked lightcurve |
|---|---|---|---|---|---|---|---|
| A | 8755 | 6866 | 0 | 0 | 0.00% | 0.00% | 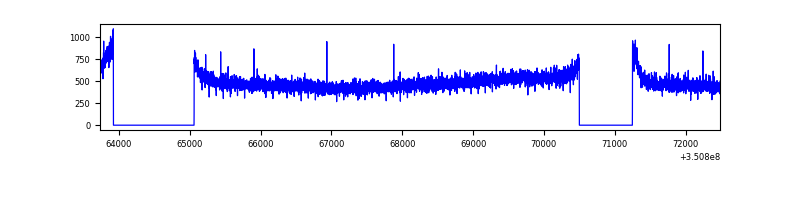 |
| B | 8755 | 6865 | 10 | 10 | 0.11% | 0.15% | 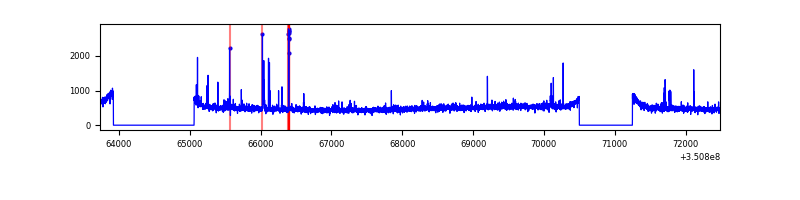 |
| C | 8755 | 6865 | 0 | 0 | 0.00% | 0.00% | 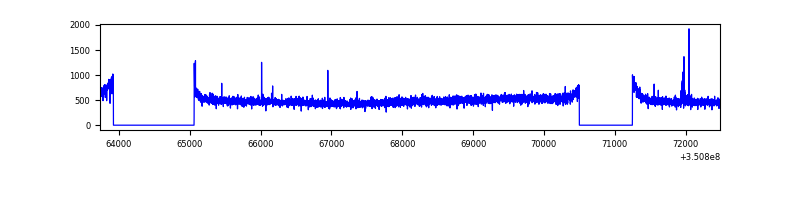 |
| D | 8756 | 6866 | 573 | 573 | 6.54% | 8.35% | 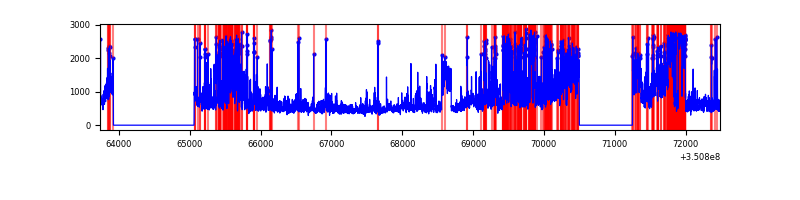 |
Top three noisy pixels from each quadrant. If the there are fewer than three noisy pixels in the level2.evt file, extra rows are filled as -1
| Pixel properties | Quadrant properties | ||||||
|---|---|---|---|---|---|---|---|
| Quadrant | DetID | PixID | Counts | Sigma | Mean | Median | Sigma |
| A | 13 | 254 | 12903 | 69.27 | 862 | 845 | 174.1 |
| A | 3 | 137 | 8722 | 45.25 | 862 | 845 | 174.1 |
| A | 0 | 226 | 7397 | 37.64 | 862 | 845 | 174.1 |
| B | 0 | 230 | 34733 | 204.04 | 861 | 841 | 166.1 |
| B | 0 | 183 | 32636 | 191.42 | 861 | 841 | 166.1 |
| B | 15 | 33 | 22343 | 129.45 | 861 | 841 | 166.1 |
| C | 14 | 238 | 133478 | 680.24 | 829 | 836 | 195.0 |
| C | 2 | 114 | 16317 | 79.39 | 829 | 836 | 195.0 |
| C | 2 | 16 | 9875 | 46.36 | 829 | 836 | 195.0 |
| D | 1 | 52 | 2098665 | 11002.38 | 799 | 779 | 190.7 |
| D | 8 | 195 | 836892 | 4385.0 | 799 | 779 | 190.7 |
| D | 12 | 233 | 312979 | 1637.34 | 799 | 779 | 190.7 |
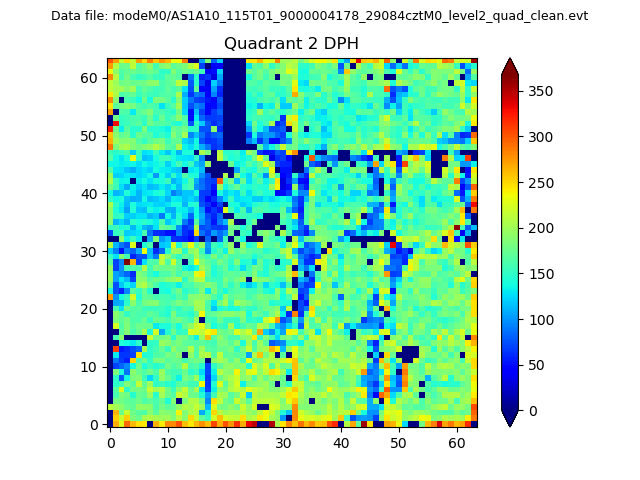
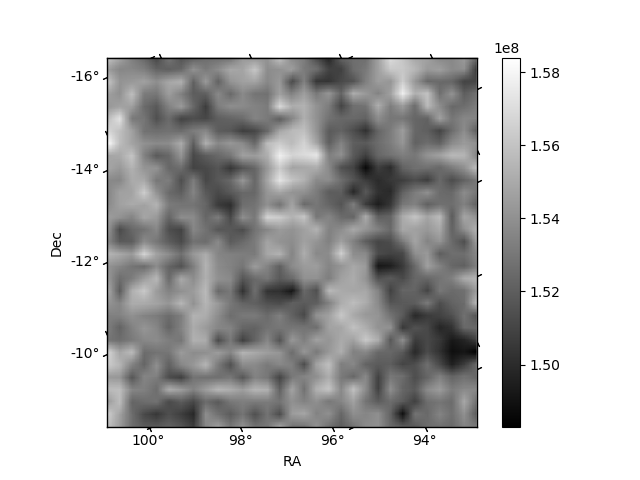
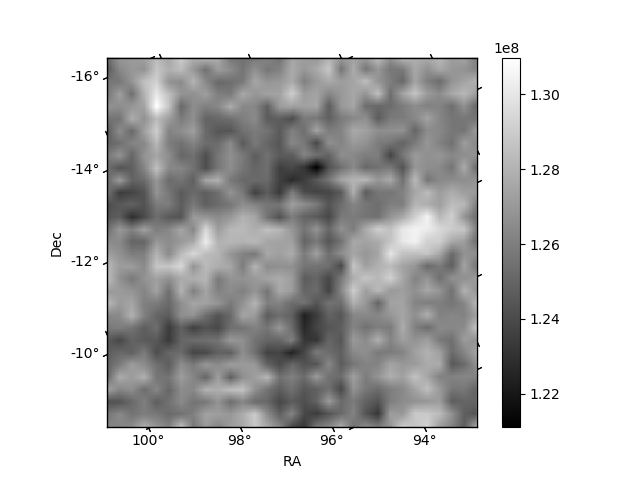
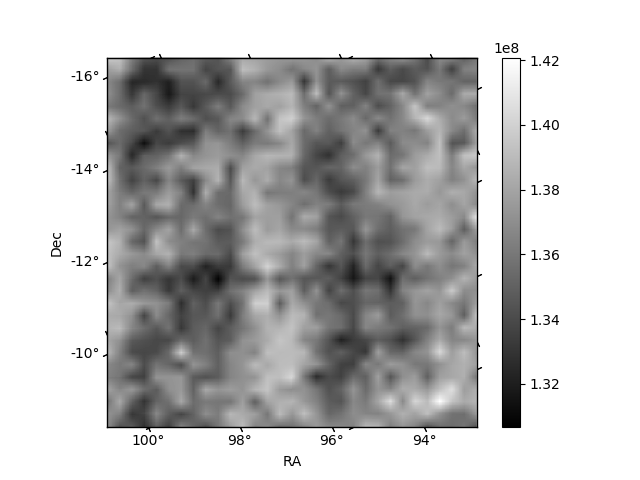
Histogram calculated using DETX and DETY for each event in the final _common_clean file
| Quadrant A | 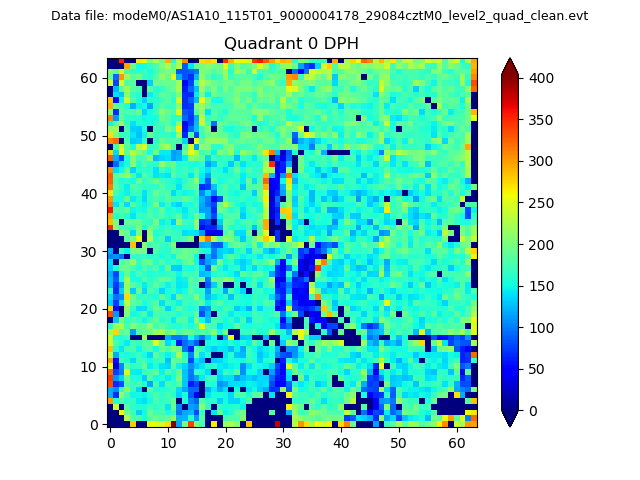 |
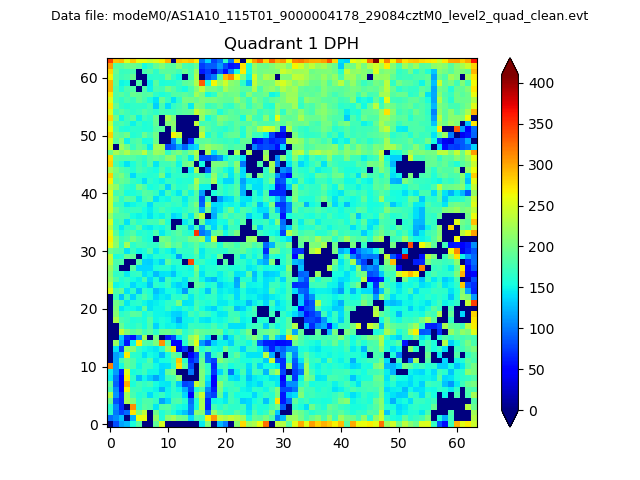 |
Quadrant B |
|---|---|---|---|
| Quadrant D | 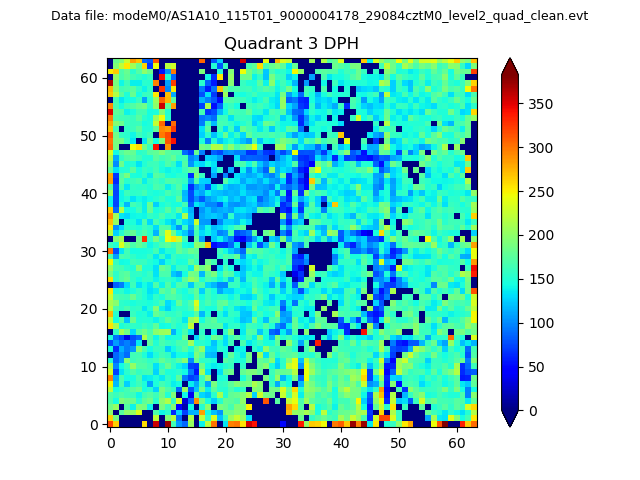 |
 |
Quadrant C |
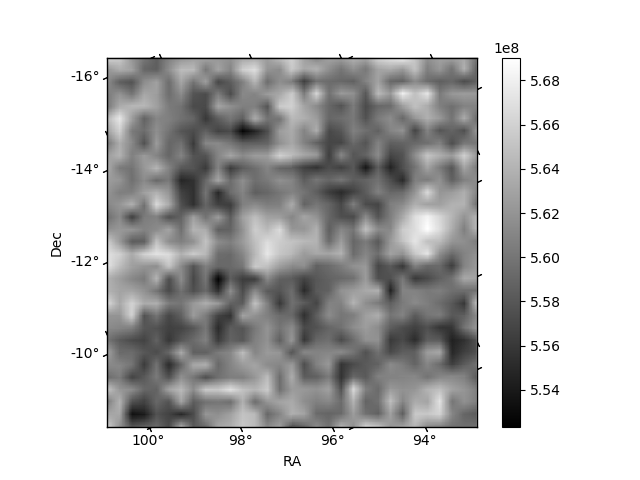
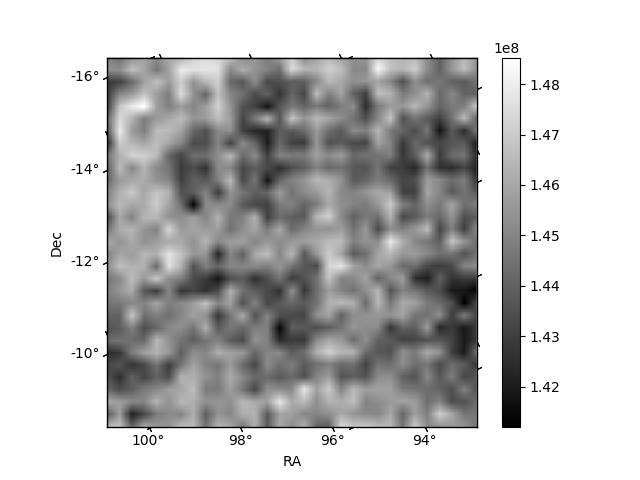
| Plot type | Count rate plots | Images |
|---|---|---|
| Comparison with Poisson distribution Blue bars denote a histogram of data divided into 1 sec bins. Red curve is a Poisson curve with rate = median count rate of data. |
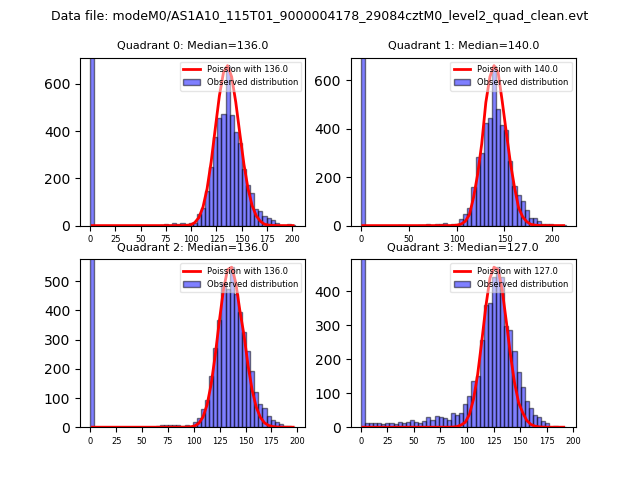 |
 |
| Quadrant-wise count rates Data is divided into 100 sec bins |
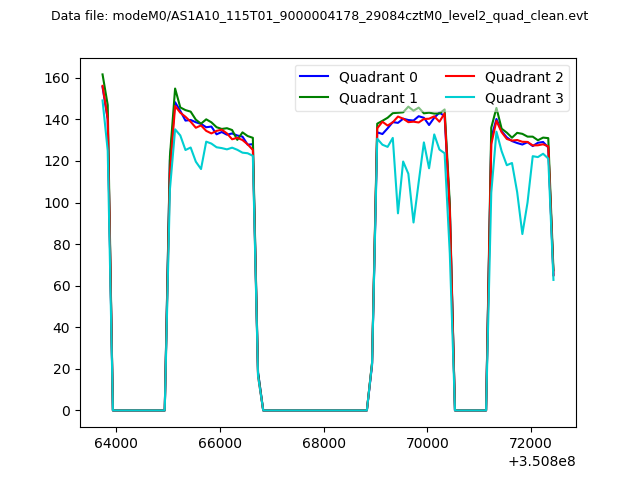 |
|
| Module-wise count rates for Quadrant A Data is divided into 100 sec bins |
 |
 |
| Module-wise count rates for Quadrant B Data is divided into 100 sec bins |
 |
 |
| Module-wise count rates for Quadrant C Data is divided into 100 sec bins |
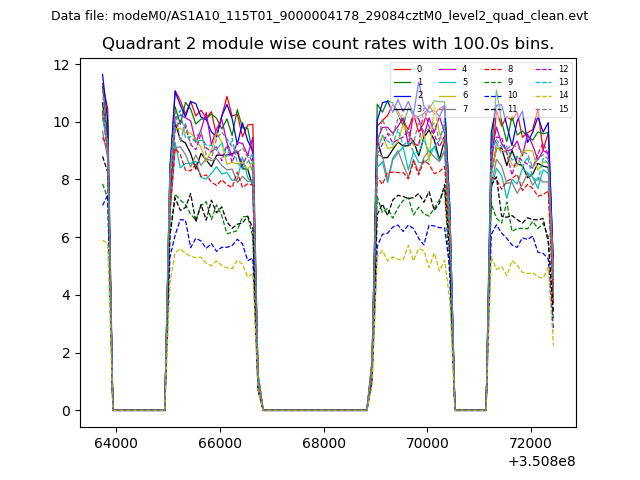 |
 |
| Module-wise count rates for Quadrant D Data is divided into 100 sec bins |
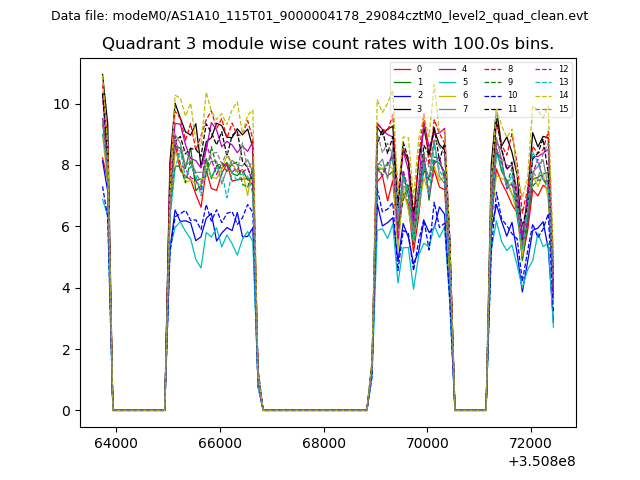 |
 |
| Parameter | Plot |
|---|---|
| CZT HV Monitor | 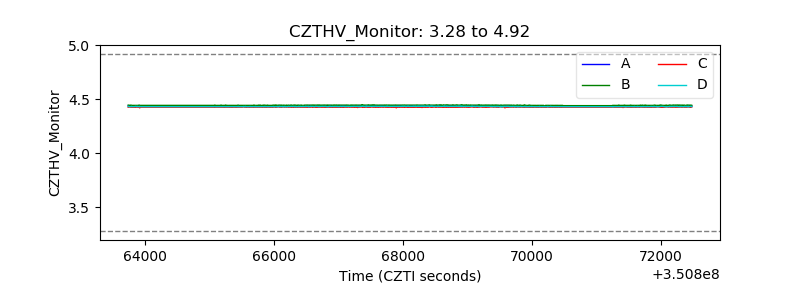 |
| D_VDD |  |
| Temperature 1 | 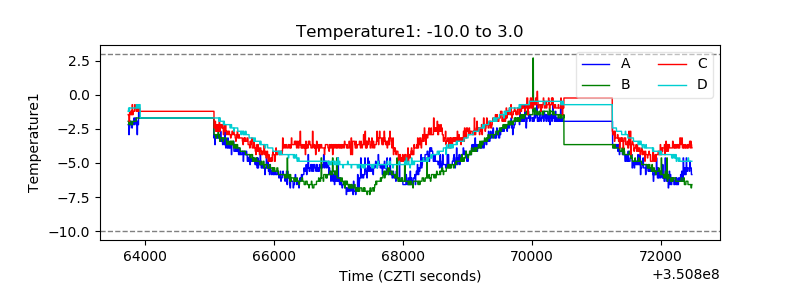 |
| Veto HV Monitor | 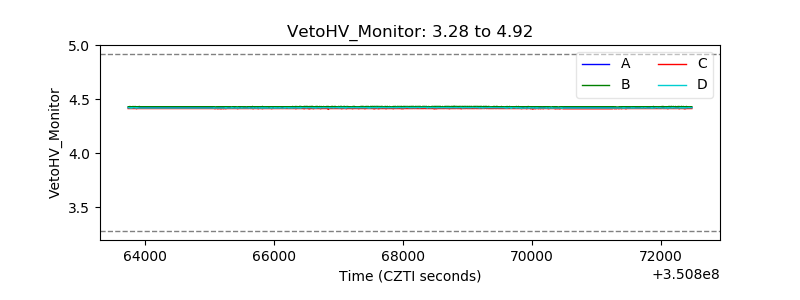 |
| Veto LLD | 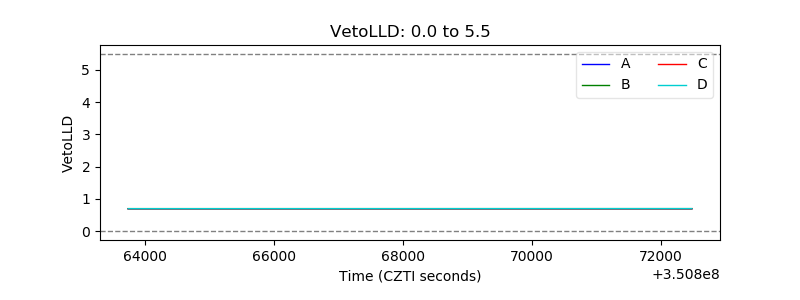 |
| Alpha Counter | 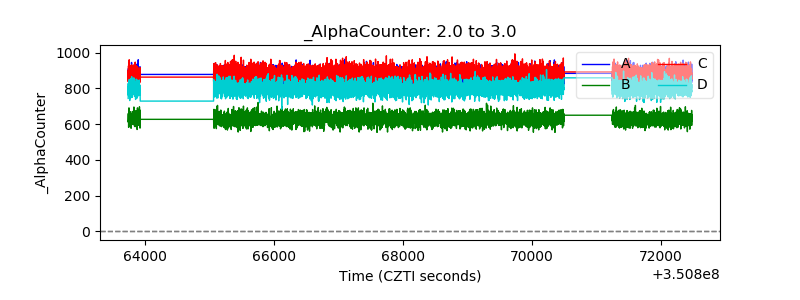 |
| _CPM_Rate | 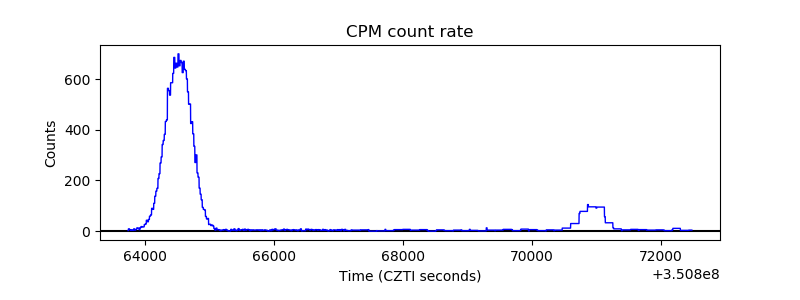 |
| CZT Counter | 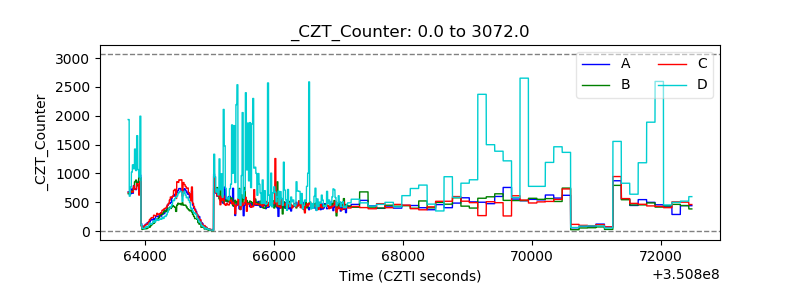 |
| +2.5 Volts monitor |  |
| +5 Volts monitor | 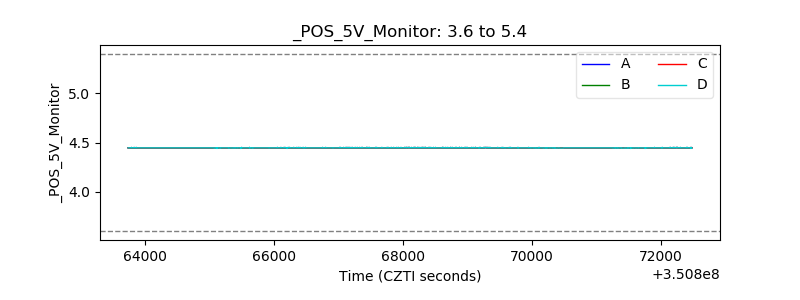 |
| _ROLL_ROT | 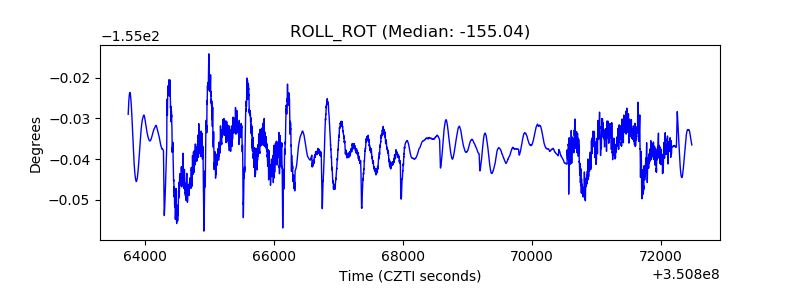 |
| _Roll_DEC | 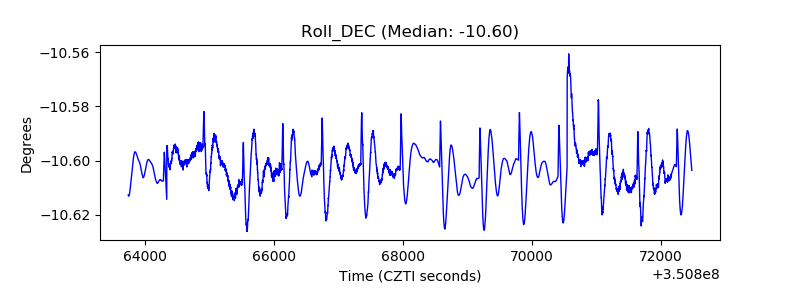 |
| _Roll_RA | 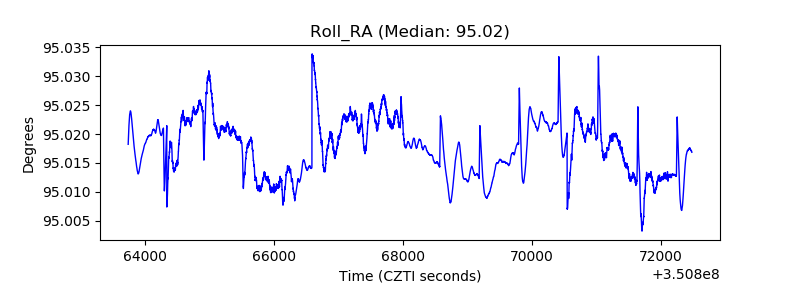 |
| Veto Counter | 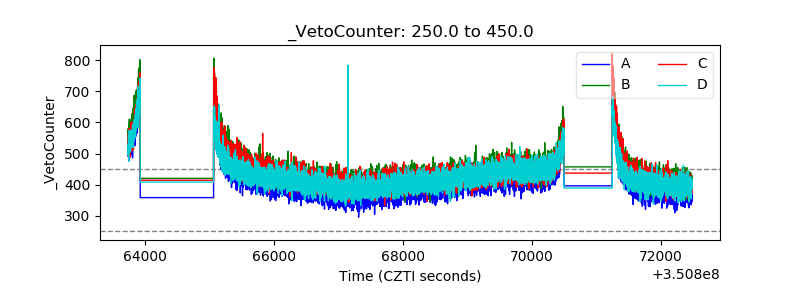 |