| Param | Original file | Final file |
|---|---|---|
| Filename | modeM0/AS1A10_063T01_9000004182_29096cztM0_level2.evt | modeM0/AS1A10_063T01_9000004182_29096cztM0_level2_quad_clean.evt |
| Size (bytes) | 174,758,400 | 25,755,840 |
| Size | 166.7 MB | 24.6 MB |
| Events in quadrant A | 1,077,201 | 165,088 |
| Events in quadrant B | 1,120,939 | 169,764 |
| Events in quadrant C | 1,113,666 | 158,631 |
| Events in quadrant D | 1,851,281 | 149,118 |
| Mode M0 | |||
|---|---|---|---|
| Quadrant | BADHDUFLAG | Total packets | Discarded packets |
| A | 0 | 4345 | 1 |
| B | 0 | 4491 | 1 |
| C | 0 | 4465 | 1 |
| D | 0 | 6865 | 1 |
| Mode M9 | |||
|---|---|---|---|
| Quadrant | BADHDUFLAG | Total packets | Discarded packets |
| A | 0 | 13 | 0 |
| B | 0 | 13 | 0 |
| C | 0 | 13 | 0 |
| D | 0 | 13 | 0 |
| Mode SS | |||
|---|---|---|---|
| Quadrant | BADHDUFLAG | Total packets | Discarded packets |
| A | 0 | 40 | 0 |
| B | 0 | 40 | 0 |
| C | 0 | 40 | 0 |
| D | 0 | 40 | 0 |
| Quadrant | Total seconds | Saturated seconds | Saturation percentage |
|---|---|---|---|
| A | 1872 | 83 | 4.433761% |
| B | 1872 | 101 | 5.395299% |
| C | 1872 | 122 | 6.517094% |
| D | 1872 | 224 | 11.965812% |
Noise dominated data is calculated using 1-second bins in cleaned event files. If a bin has >2000 counts, and if more than 50% of those come from <1% of pixels, then it is considered to be noise-dominated and hence unusable.
| Quadrant | # 1 sec bins | Bins with >0 counts | Bins with >2000 counts | High rate bins dominated by noise | Noise dominated (total time) | Noise dominated (detector-on time) | Marked lightcurve |
|---|---|---|---|---|---|---|---|
| A | 3116 | 1872 | 0 | 0 | 0.00% | 0.00% | 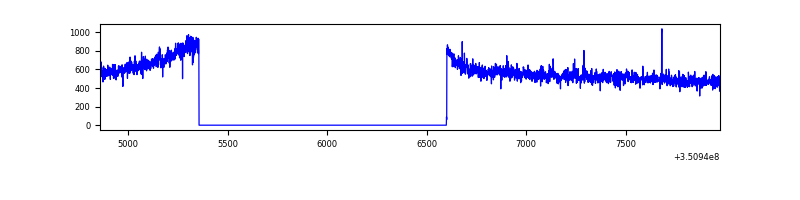 |
| B | 3117 | 1873 | 1 | 1 | 0.03% | 0.05% | 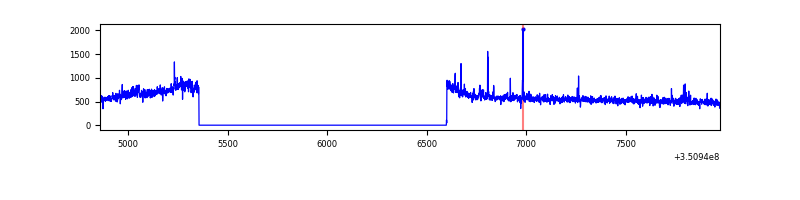 |
| C | 3117 | 1873 | 2 | 2 | 0.06% | 0.11% | 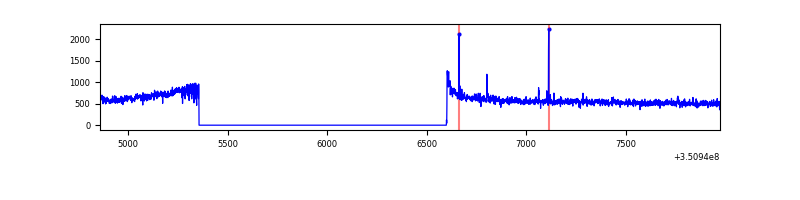 |
| D | 3117 | 1873 | 213 | 213 | 6.83% | 11.37% | 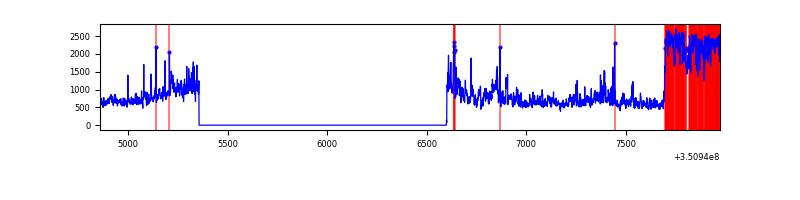 |
Top three noisy pixels from each quadrant. If the there are fewer than three noisy pixels in the level2.evt file, extra rows are filled as -1
| Pixel properties | Quadrant properties | ||||||
|---|---|---|---|---|---|---|---|
| Quadrant | DetID | PixID | Counts | Sigma | Mean | Median | Sigma |
| A | 6 | 16 | 8837 | 150.64 | 276 | 271 | 56.9 |
| A | 13 | 254 | 3510 | 56.96 | 276 | 271 | 56.9 |
| A | 3 | 137 | 2771 | 43.96 | 276 | 271 | 56.9 |
| B | 0 | 183 | 9323 | 164.39 | 276 | 270 | 55.1 |
| B | 0 | 190 | 7435 | 130.11 | 276 | 270 | 55.1 |
| B | 12 | 111 | 6432 | 111.89 | 276 | 270 | 55.1 |
| C | 14 | 238 | 42488 | 667.32 | 264 | 265 | 63.3 |
| C | 3 | 233 | 26526 | 415.05 | 264 | 265 | 63.3 |
| C | 2 | 16 | 9464 | 145.39 | 264 | 265 | 63.3 |
| D | 8 | 195 | 673852 | 10498.44 | 263 | 257 | 64.2 |
| D | 1 | 52 | 135791 | 2112.39 | 263 | 257 | 64.2 |
| D | 2 | 250 | 31383 | 485.12 | 263 | 257 | 64.2 |
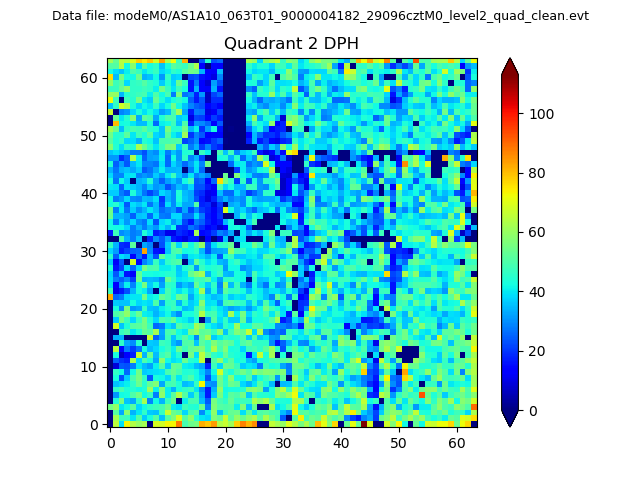
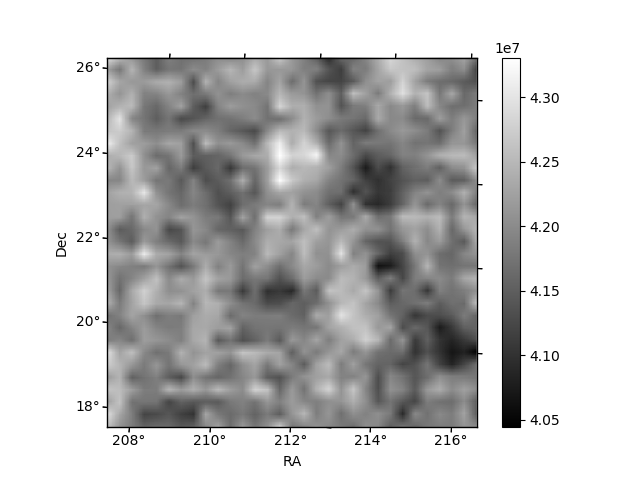
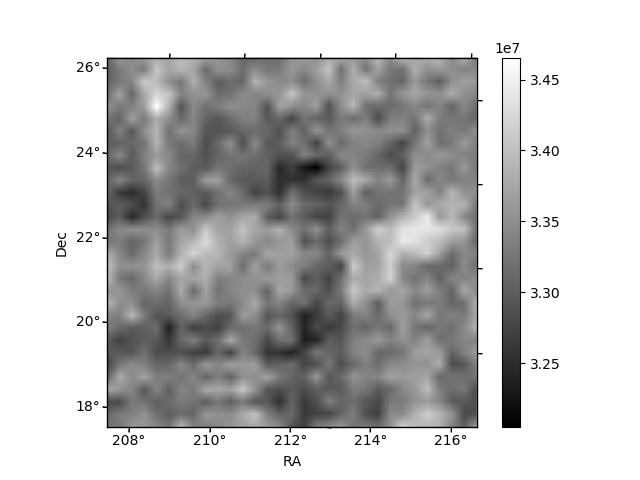
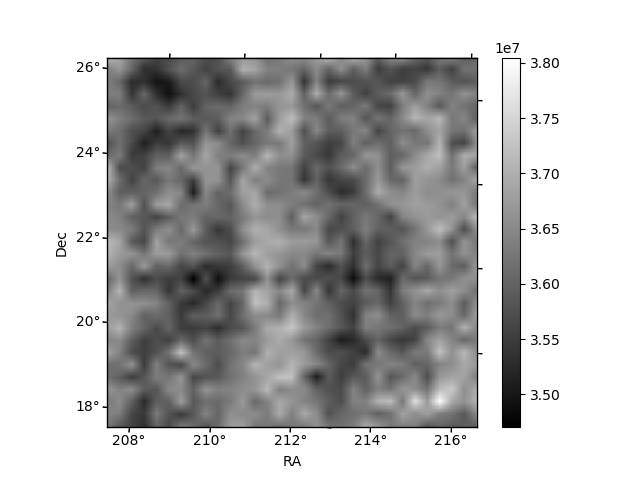
Histogram calculated using DETX and DETY for each event in the final _common_clean file
| Quadrant A | 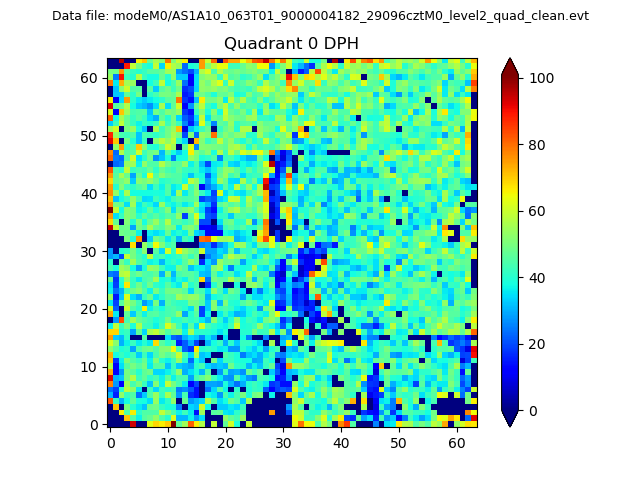 |
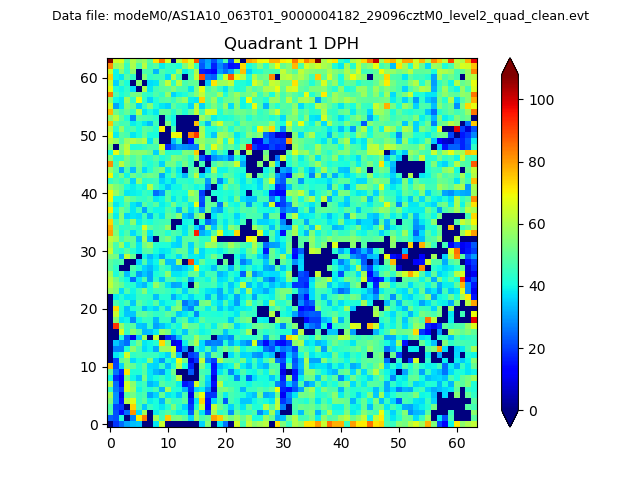 |
Quadrant B |
|---|---|---|---|
| Quadrant D | 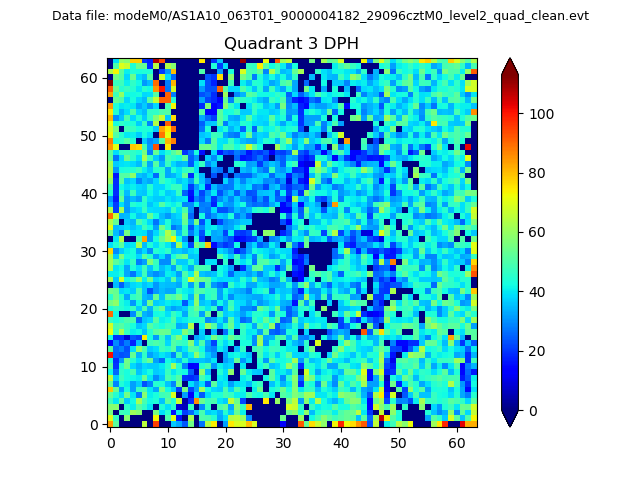 |
 |
Quadrant C |
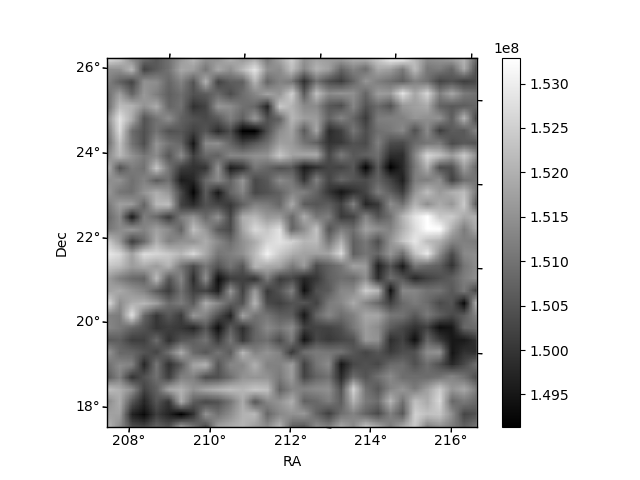
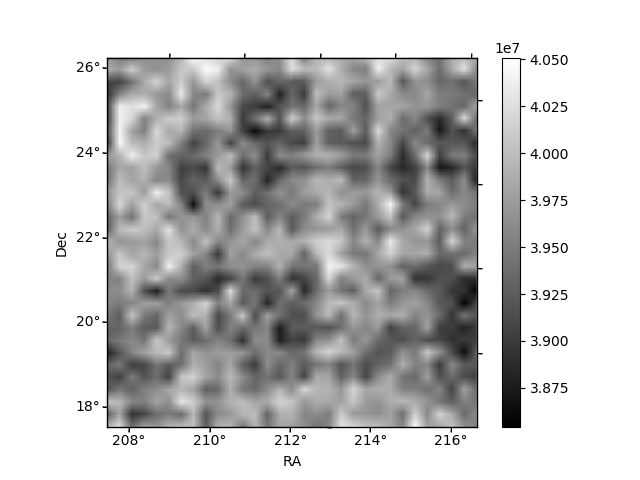
| Plot type | Count rate plots | Images |
|---|---|---|
| Comparison with Poisson distribution Blue bars denote a histogram of data divided into 1 sec bins. Red curve is a Poisson curve with rate = median count rate of data. |
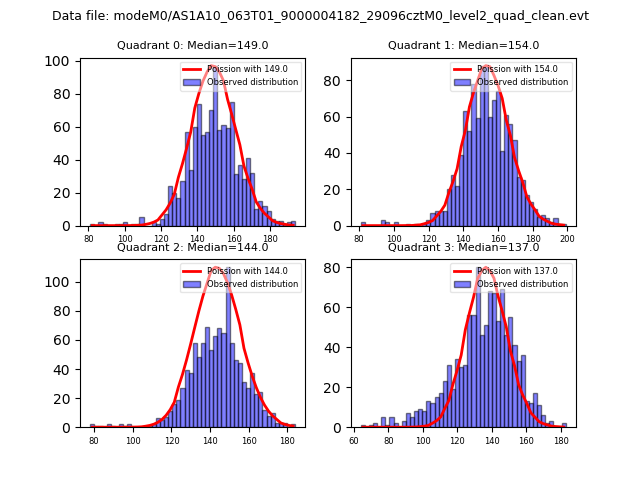 |
 |
| Quadrant-wise count rates Data is divided into 100 sec bins |
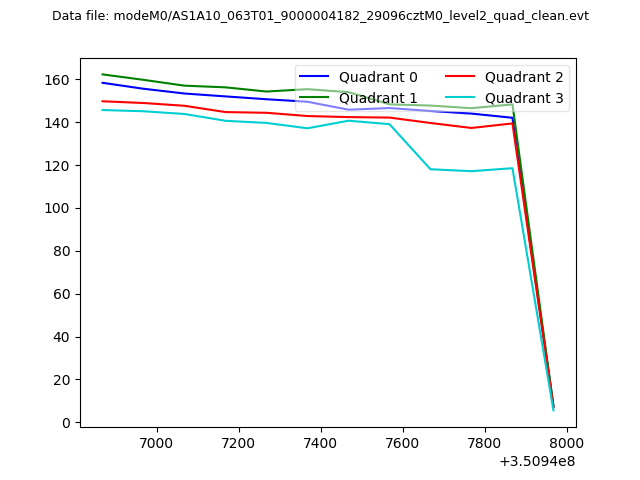 |
|
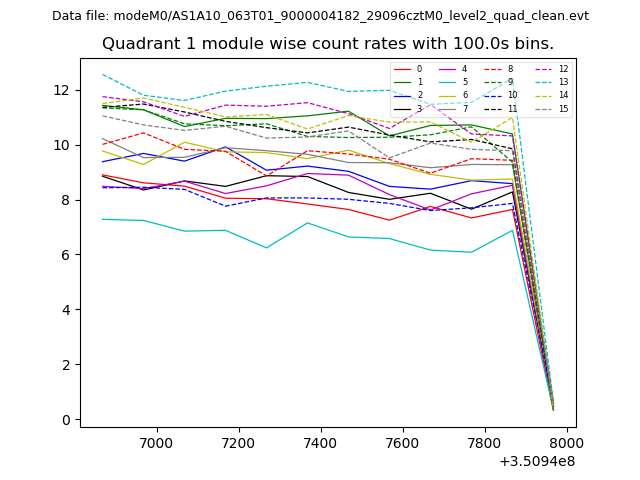
| Module-wise count rates for Quadrant A Data is divided into 100 sec bins |
 |
 |
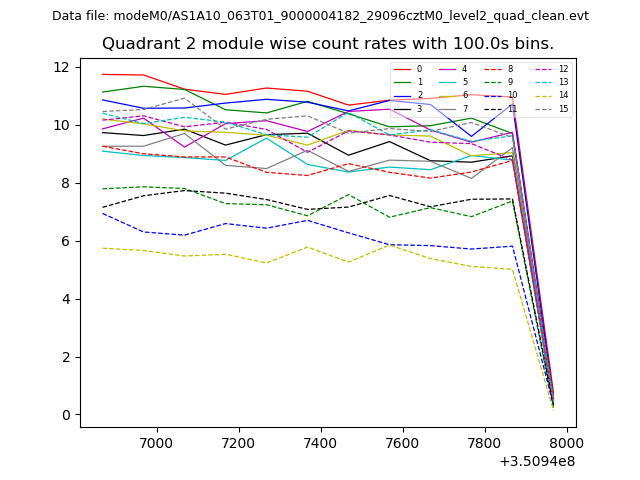
| Module-wise count rates for Quadrant B Data is divided into 100 sec bins |
 |
 |
| Module-wise count rates for Quadrant C Data is divided into 100 sec bins |
 |
 |
| Module-wise count rates for Quadrant D Data is divided into 100 sec bins |
 |
 |
| Parameter | Plot |
|---|---|
| CZT HV Monitor | 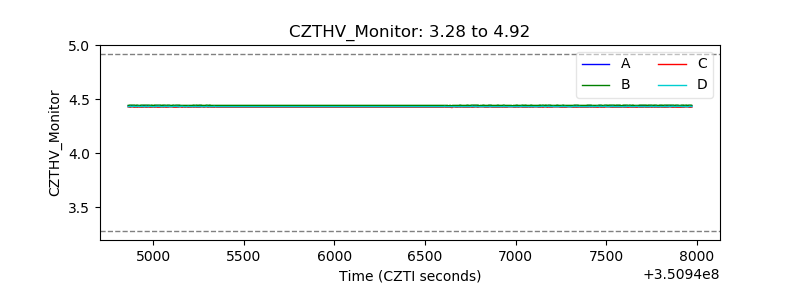 |
| D_VDD | 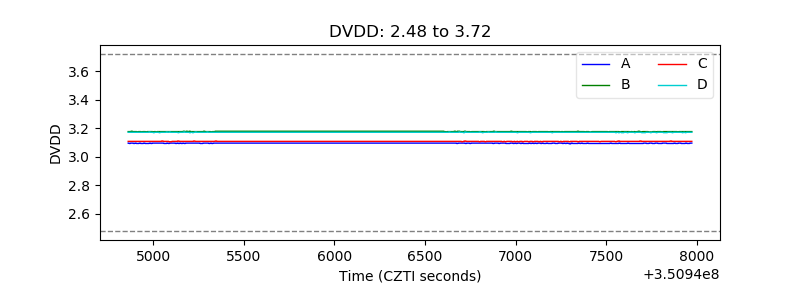 |
| Temperature 1 | 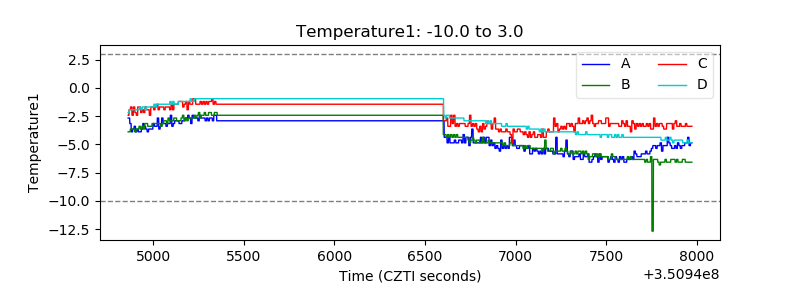 |
| Veto HV Monitor | 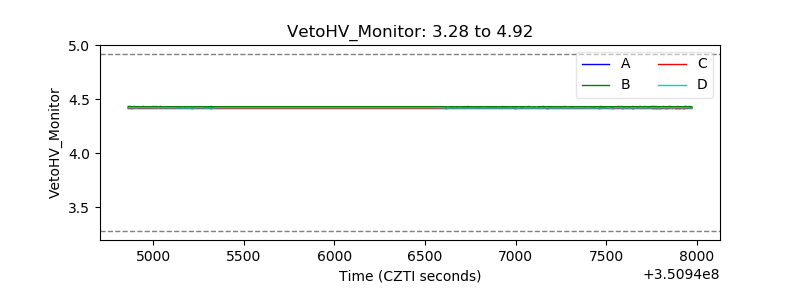 |
| Veto LLD |  |
| Alpha Counter | 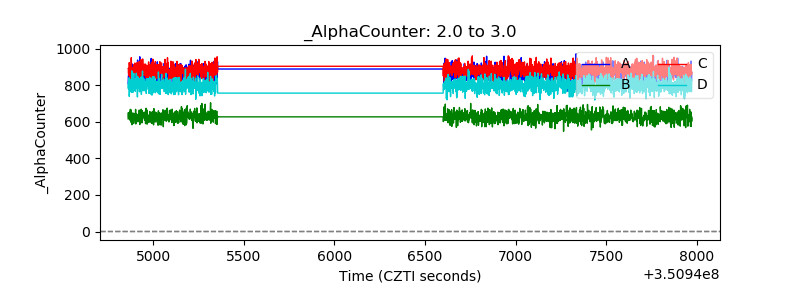 |
| _CPM_Rate |  |
| CZT Counter | 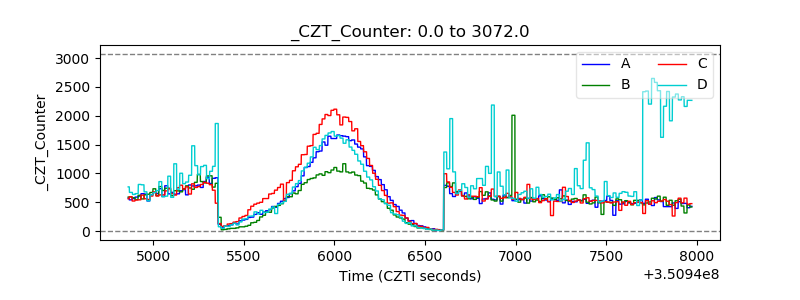 |
| +2.5 Volts monitor |  |
| +5 Volts monitor |  |
| _ROLL_ROT | 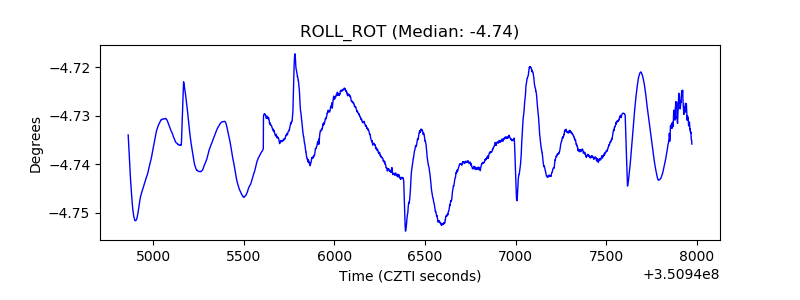 |
| _Roll_DEC | 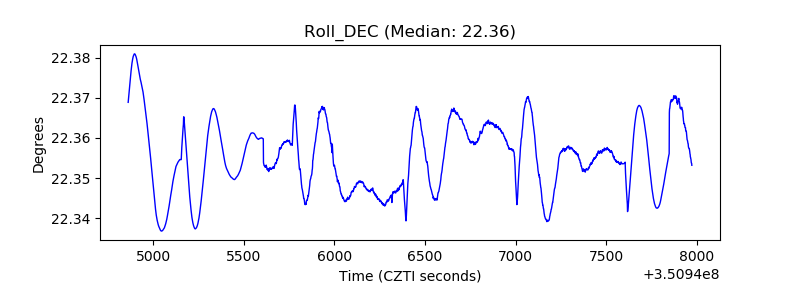 |
| _Roll_RA | 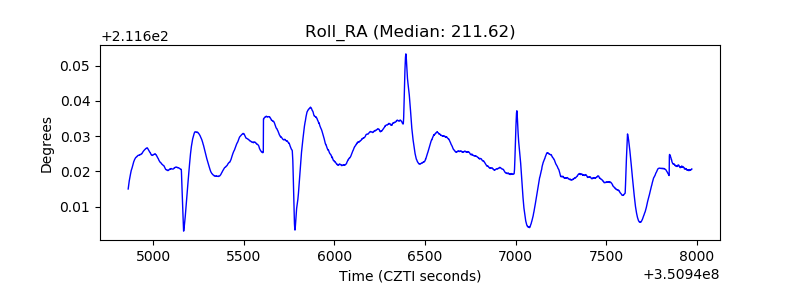 |
| Veto Counter | 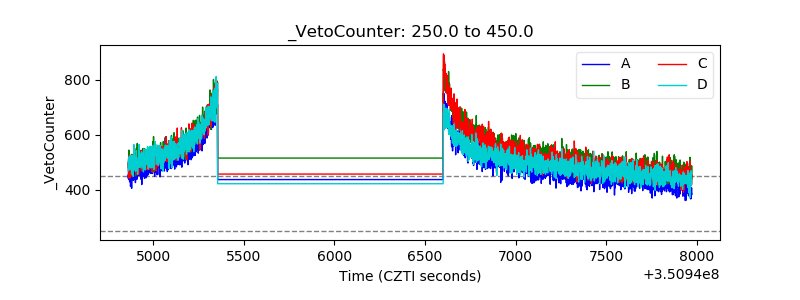 |