| Param | Original file | Final file |
|---|---|---|
| Filename | modeM0/AS1A10_063T01_9000004182_29097cztM0_level2.evt | modeM0/AS1A10_063T01_9000004182_29097cztM0_level2_quad_clean.evt |
| Size (bytes) | 551,975,040 | 104,186,880 |
| Size | 526.4 MB | 99.4 MB |
| Events in quadrant A | 3,339,052 | 686,073 |
| Events in quadrant B | 3,403,669 | 704,712 |
| Events in quadrant C | 3,442,196 | 668,927 |
| Events in quadrant D | 6,084,810 | 635,745 |
| Mode M0 | |||
|---|---|---|---|
| Quadrant | BADHDUFLAG | Total packets | Discarded packets |
| A | 0 | 14062 | 2 |
| B | 0 | 14255 | 2 |
| C | 0 | 14247 | 2 |
| D | 0 | 22621 | 2 |
| Mode M9 | |||
|---|---|---|---|
| Quadrant | BADHDUFLAG | Total packets | Discarded packets |
| A | 0 | 20 | 0 |
| B | 0 | 21 | 0 |
| C | 0 | 21 | 0 |
| D | 0 | 21 | 0 |
| Mode SS | |||
|---|---|---|---|
| Quadrant | BADHDUFLAG | Total packets | Discarded packets |
| A | 0 | 132 | 0 |
| B | 0 | 132 | 0 |
| C | 0 | 132 | 0 |
| D | 0 | 132 | 0 |
| Quadrant | Total seconds | Saturated seconds | Saturation percentage |
|---|---|---|---|
| A | 6602 | 28 | 0.424114% |
| B | 6602 | 66 | 0.999697% |
| C | 6602 | 112 | 1.696456% |
| D | 6602 | 616 | 9.330506% |
Noise dominated data is calculated using 1-second bins in cleaned event files. If a bin has >2000 counts, and if more than 50% of those come from <1% of pixels, then it is considered to be noise-dominated and hence unusable.
| Quadrant | # 1 sec bins | Bins with >0 counts | Bins with >2000 counts | High rate bins dominated by noise | Noise dominated (total time) | Noise dominated (detector-on time) | Marked lightcurve |
|---|---|---|---|---|---|---|---|
| A | 7552 | 6603 | 0 | 0 | 0.00% | 0.00% | 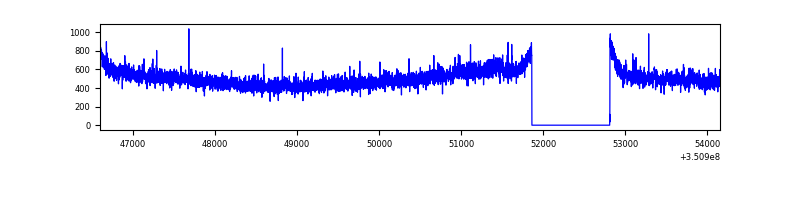 |
| B | 7552 | 6603 | 3 | 3 | 0.04% | 0.05% | 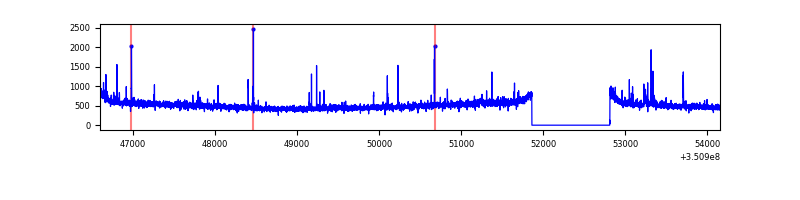 |
| C | 7552 | 6603 | 2 | 2 | 0.03% | 0.03% | 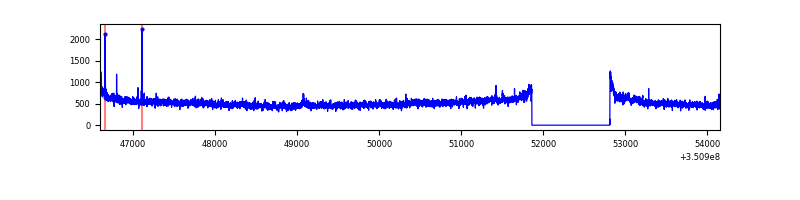 |
| D | 7552 | 6603 | 680 | 680 | 9.00% | 10.30% | 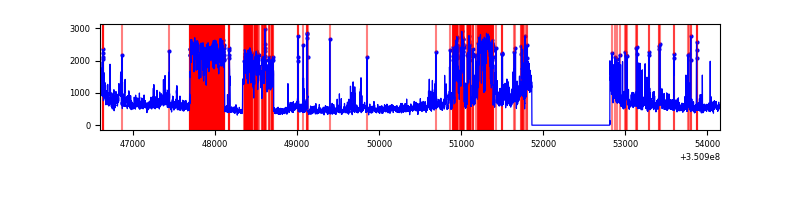 |
Top three noisy pixels from each quadrant. If the there are fewer than three noisy pixels in the level2.evt file, extra rows are filled as -1
| Pixel properties | Quadrant properties | ||||||
|---|---|---|---|---|---|---|---|
| Quadrant | DetID | PixID | Counts | Sigma | Mean | Median | Sigma |
| A | 6 | 16 | 74626 | 435.28 | 845 | 828 | 169.5 |
| A | 13 | 254 | 11492 | 62.9 | 845 | 828 | 169.5 |
| A | 3 | 137 | 7927 | 41.87 | 845 | 828 | 169.5 |
| B | 10 | 245 | 28584 | 174.01 | 844 | 822 | 159.5 |
| B | 0 | 183 | 25472 | 154.51 | 844 | 822 | 159.5 |
| B | 12 | 111 | 19485 | 116.98 | 844 | 822 | 159.5 |
| C | 14 | 238 | 130704 | 688.87 | 810 | 818 | 188.5 |
| C | 3 | 233 | 127866 | 673.82 | 810 | 818 | 188.5 |
| C | 2 | 114 | 15221 | 76.39 | 810 | 818 | 188.5 |
| D | 8 | 195 | 1879168 | 9923.12 | 790 | 772 | 189.3 |
| D | 1 | 52 | 844390 | 4456.63 | 790 | 772 | 189.3 |
| D | 12 | 233 | 288495 | 1519.97 | 790 | 772 | 189.3 |
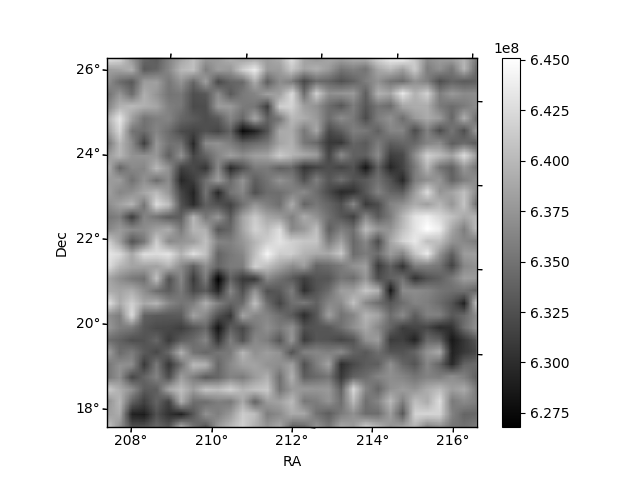
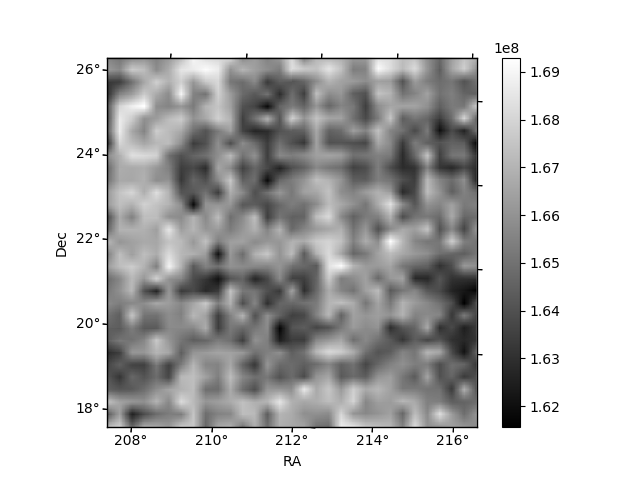
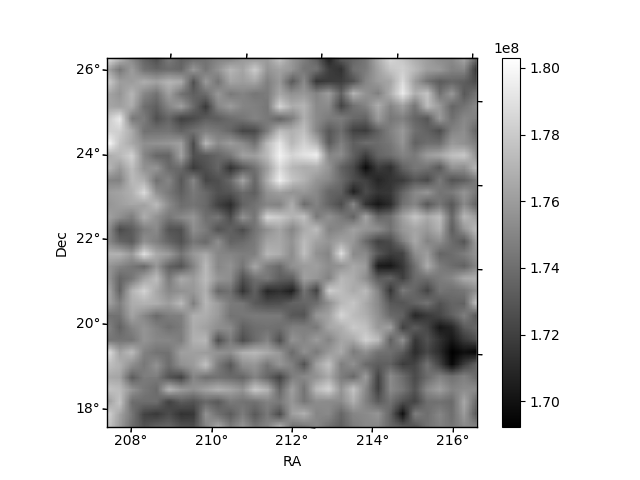
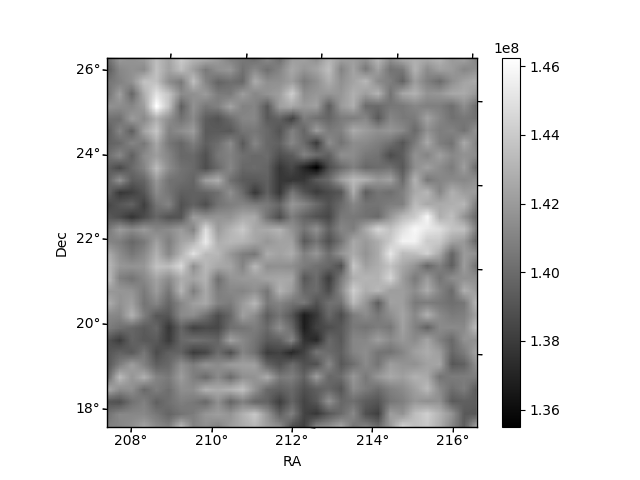
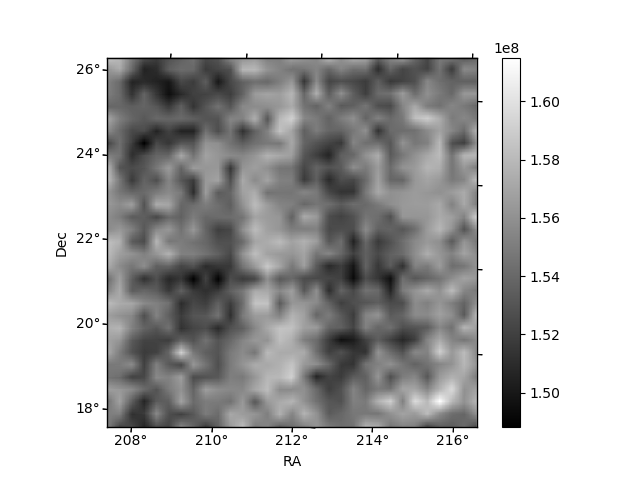
Histogram calculated using DETX and DETY for each event in the final _common_clean file
| Quadrant A | 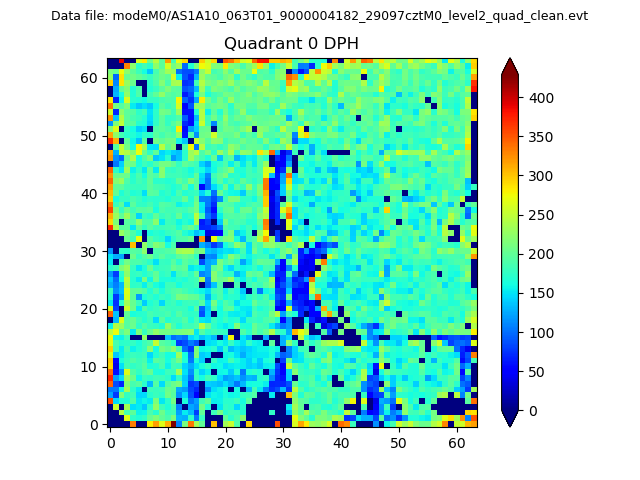 |
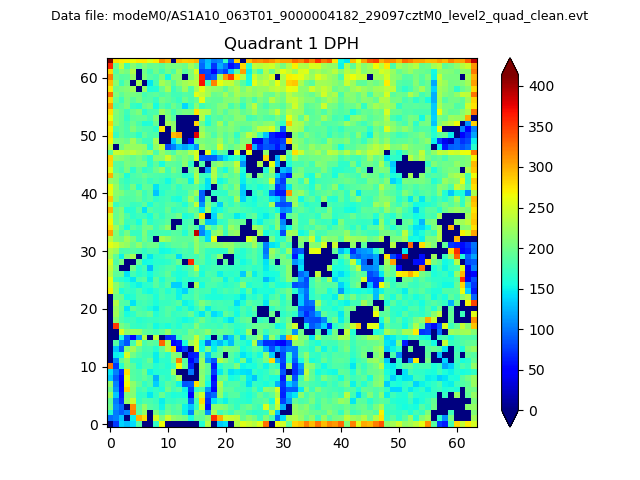 |
Quadrant B |
|---|---|---|---|
| Quadrant D | 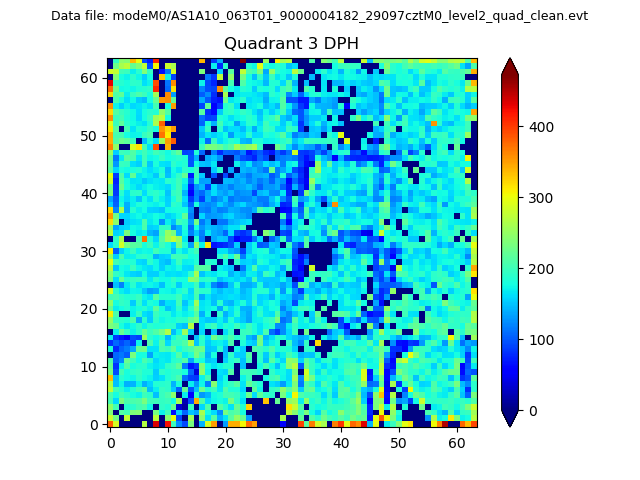 |
 |
Quadrant C |
| Plot type | Count rate plots | Images |
|---|---|---|
| Comparison with Poisson distribution Blue bars denote a histogram of data divided into 1 sec bins. Red curve is a Poisson curve with rate = median count rate of data. |
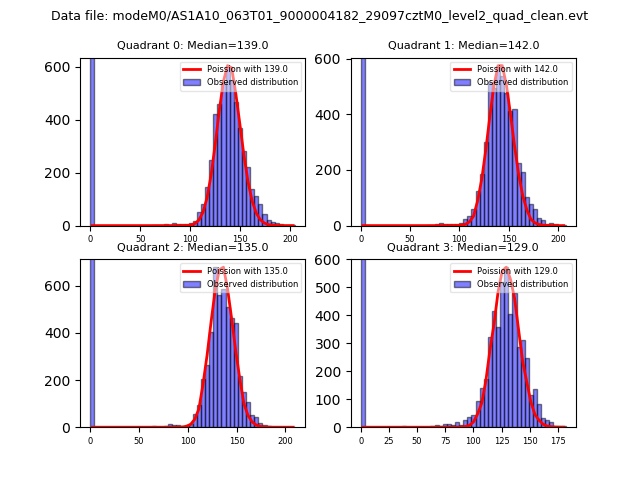 |
 |
| Quadrant-wise count rates Data is divided into 100 sec bins |
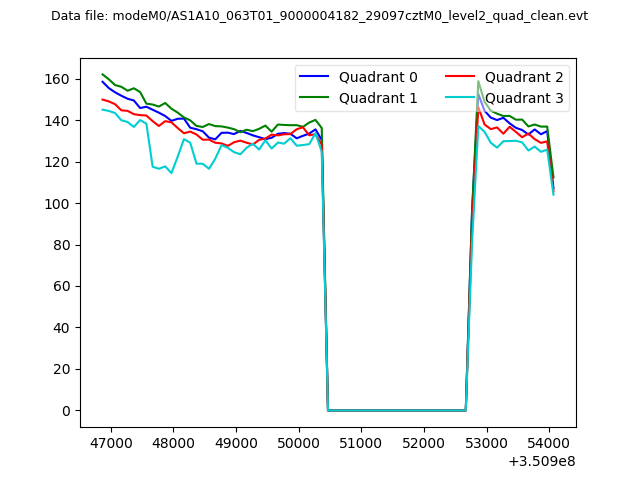 |
|
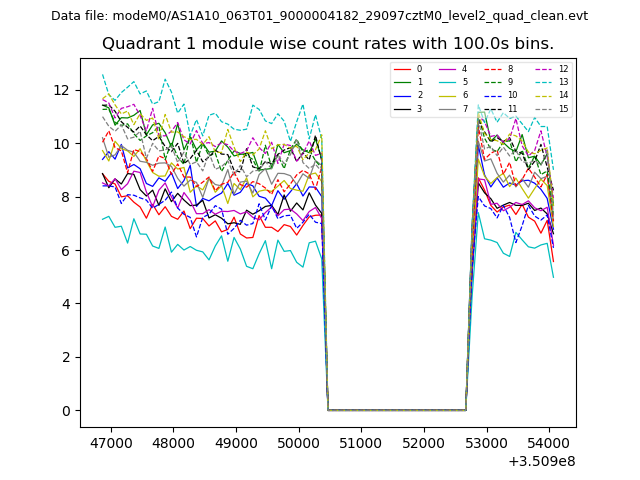
| Module-wise count rates for Quadrant A Data is divided into 100 sec bins |
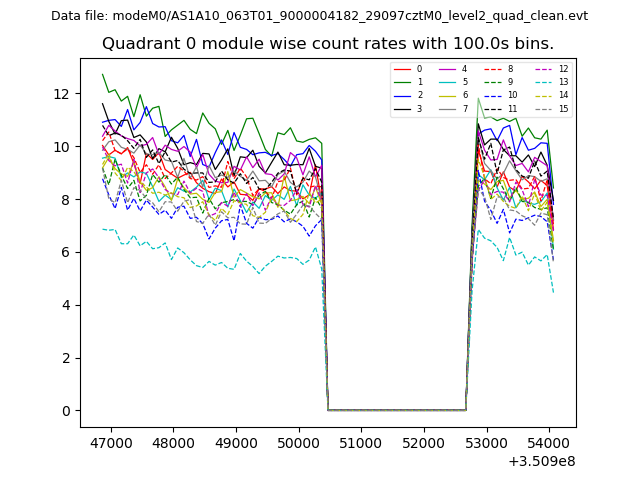 |
 |
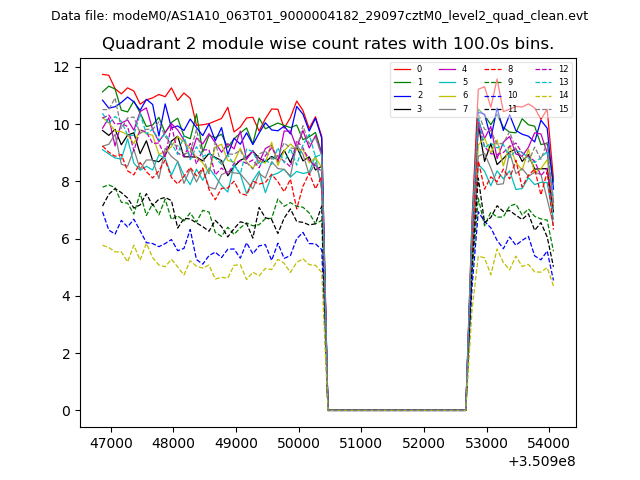
| Module-wise count rates for Quadrant B Data is divided into 100 sec bins |
 |
 |
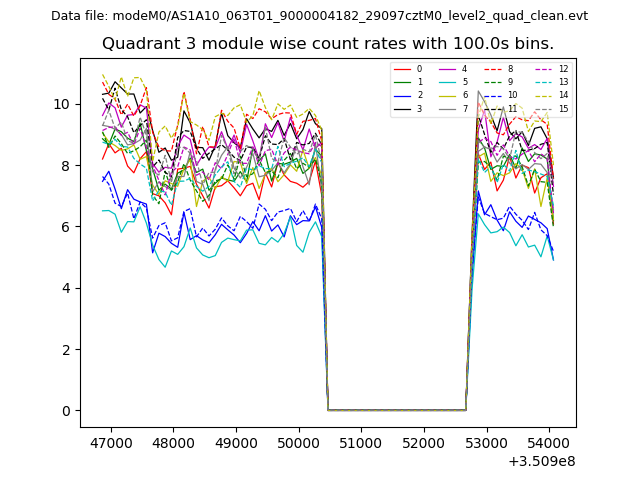
| Module-wise count rates for Quadrant C Data is divided into 100 sec bins |
 |
 |
| Module-wise count rates for Quadrant D Data is divided into 100 sec bins |
 |
 |
| Parameter | Plot |
|---|---|
| CZT HV Monitor | 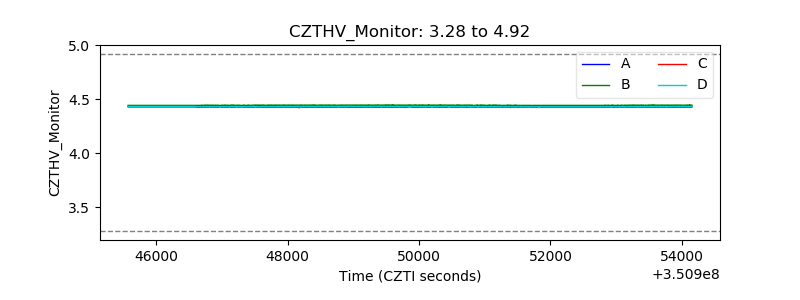 |
| D_VDD | 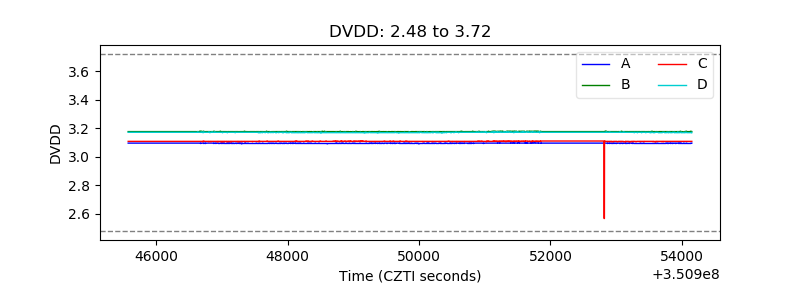 |
| Temperature 1 | 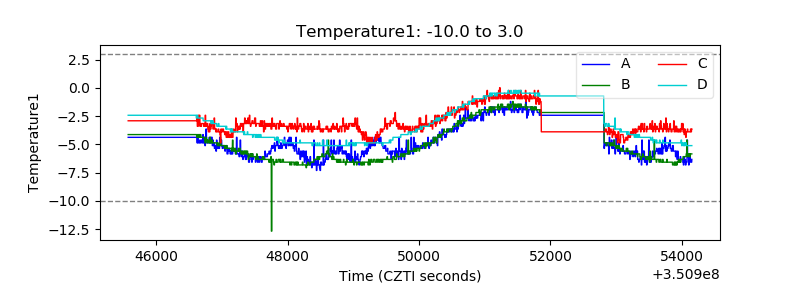 |
| Veto HV Monitor | 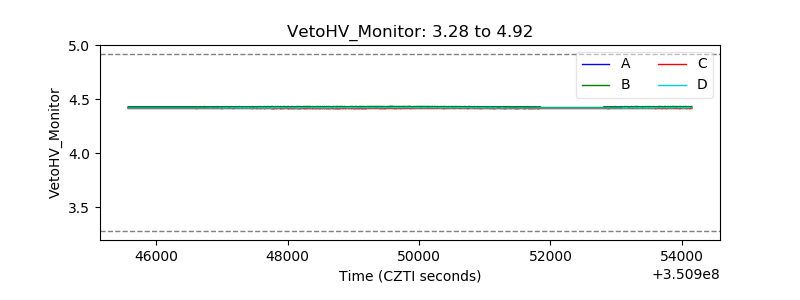 |
| Veto LLD | 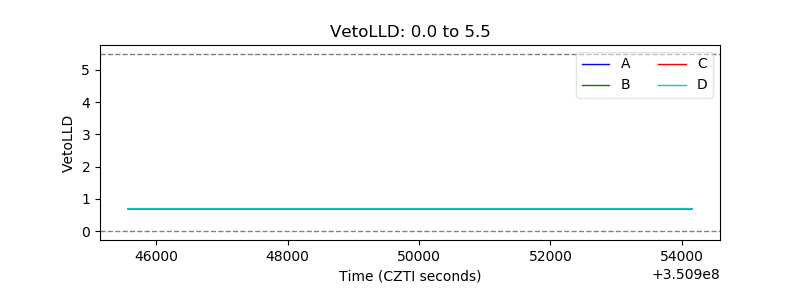 |
| Alpha Counter | 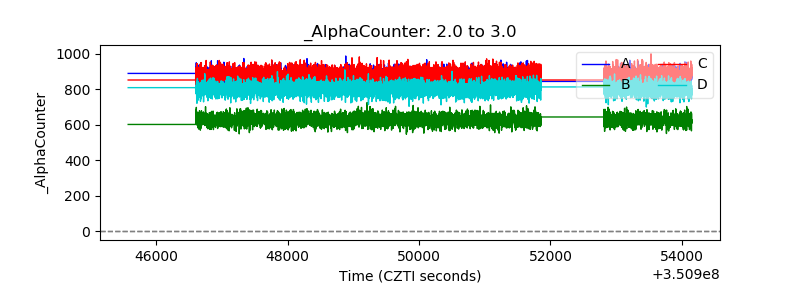 |
| _CPM_Rate | 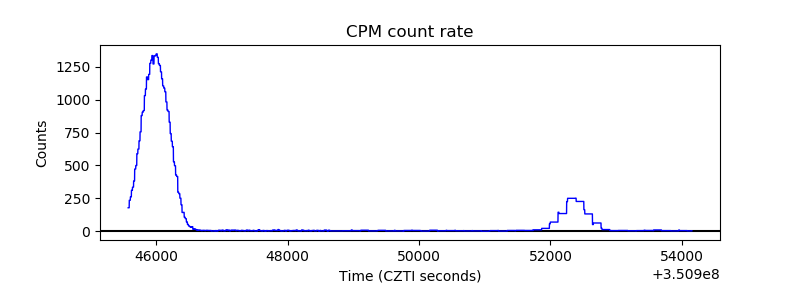 |
| CZT Counter | 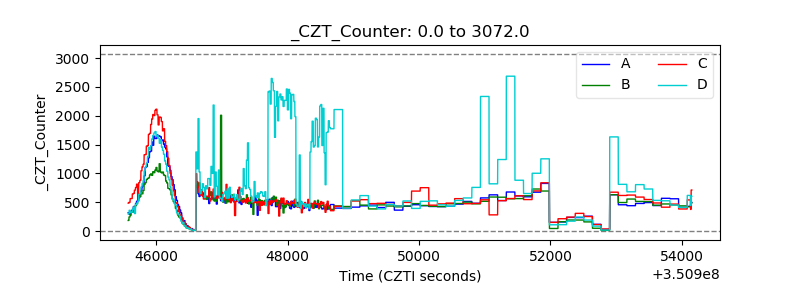 |
| +2.5 Volts monitor |  |
| +5 Volts monitor | 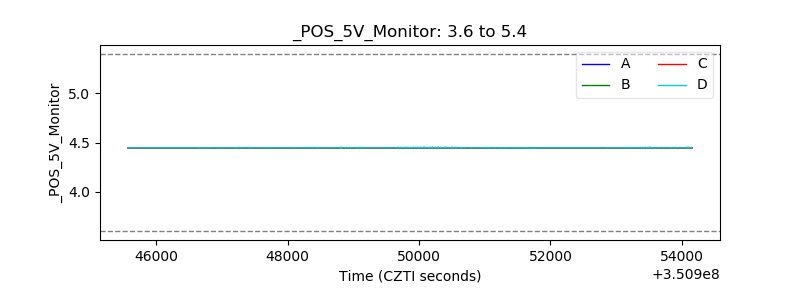 |
| _ROLL_ROT | 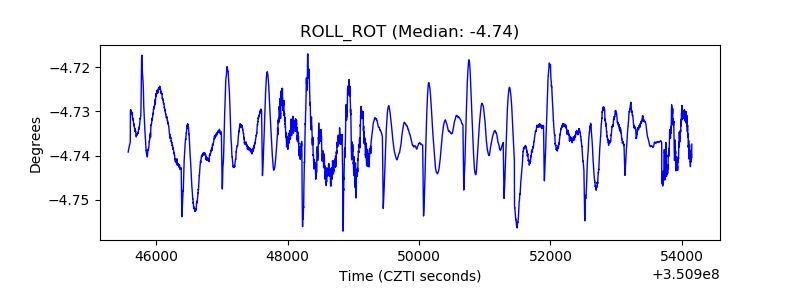 |
| _Roll_DEC | 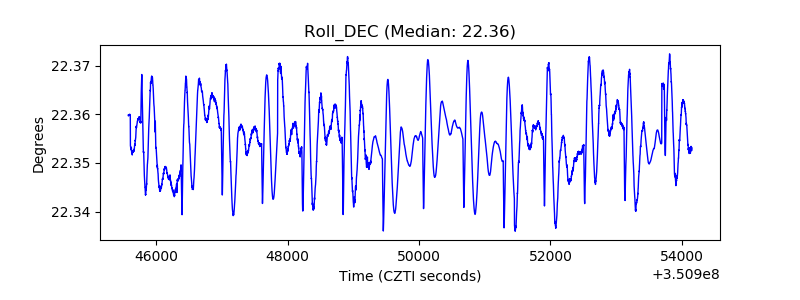 |
| _Roll_RA | 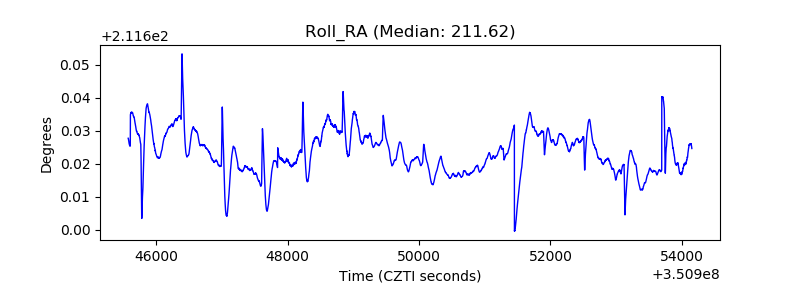 |
| Veto Counter | 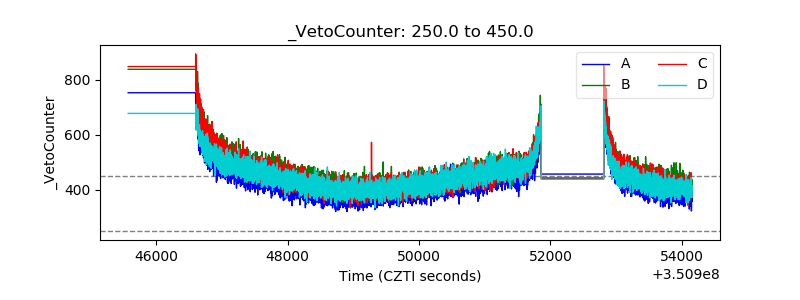 |