| Param | Original file | Final file |
|---|---|---|
| Filename | modeM0/AS1A10_063T01_9000004182_29098cztM0_level2.evt | modeM0/AS1A10_063T01_9000004182_29098cztM0_level2_quad_clean.evt |
| Size (bytes) | 629,104,320 | 103,423,680 |
| Size | 600.0 MB | 98.6 MB |
| Events in quadrant A | 3,791,928 | 660,161 |
| Events in quadrant B | 3,916,068 | 677,861 |
| Events in quadrant C | 3,940,805 | 649,414 |
| Events in quadrant D | 6,895,826 | 622,949 |
| Mode M0 | |||
|---|---|---|---|
| Quadrant | BADHDUFLAG | Total packets | Discarded packets |
| A | 0 | 16017 | 2 |
| B | 0 | 16510 | 2 |
| C | 0 | 16633 | 2 |
| D | 0 | 25657 | 2 |
| Mode M9 | |||
|---|---|---|---|
| Quadrant | BADHDUFLAG | Total packets | Discarded packets |
| A | 0 | 15 | 0 |
| B | 0 | 15 | 0 |
| C | 0 | 15 | 0 |
| D | 0 | 15 | 0 |
| Mode SS | |||
|---|---|---|---|
| Quadrant | BADHDUFLAG | Total packets | Discarded packets |
| A | 0 | 152 | 0 |
| B | 0 | 152 | 0 |
| C | 0 | 152 | 0 |
| D | 0 | 152 | 0 |
| Quadrant | Total seconds | Saturated seconds | Saturation percentage |
|---|---|---|---|
| A | 7503 | 70 | 0.932960% |
| B | 7504 | 165 | 2.198827% |
| C | 7504 | 187 | 2.492004% |
| D | 7504 | 811 | 10.807569% |
Noise dominated data is calculated using 1-second bins in cleaned event files. If a bin has >2000 counts, and if more than 50% of those come from <1% of pixels, then it is considered to be noise-dominated and hence unusable.
| Quadrant | # 1 sec bins | Bins with >0 counts | Bins with >2000 counts | High rate bins dominated by noise | Noise dominated (total time) | Noise dominated (detector-on time) | Marked lightcurve |
|---|---|---|---|---|---|---|---|
| A | 8913 | 7505 | 0 | 0 | 0.00% | 0.00% | 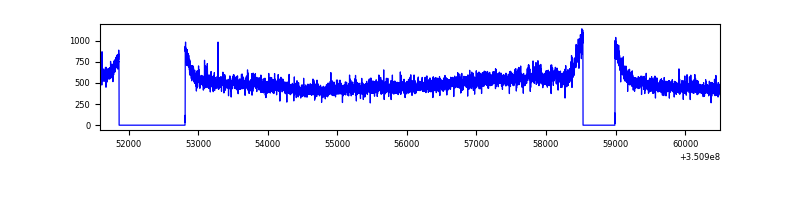 |
| B | 8914 | 7506 | 11 | 11 | 0.12% | 0.15% | 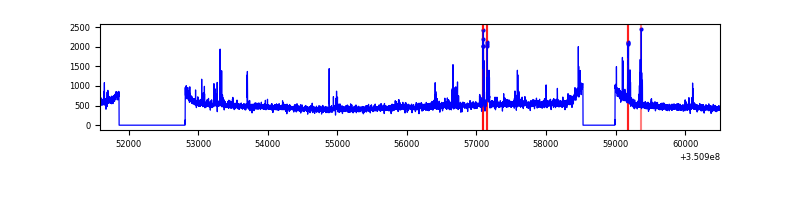 |
| C | 8913 | 7505 | 9 | 9 | 0.10% | 0.12% |  |
| D | 8914 | 7506 | 355 | 355 | 3.98% | 4.73% | 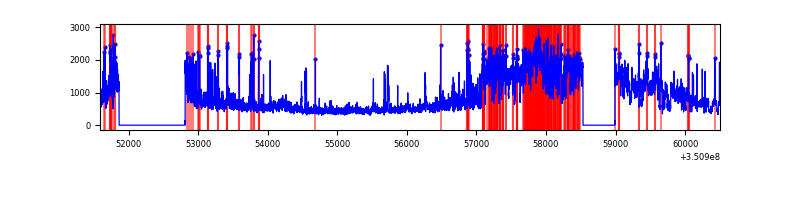 |
Top three noisy pixels from each quadrant. If the there are fewer than three noisy pixels in the level2.evt file, extra rows are filled as -1
| Pixel properties | Quadrant properties | ||||||
|---|---|---|---|---|---|---|---|
| Quadrant | DetID | PixID | Counts | Sigma | Mean | Median | Sigma |
| A | 6 | 16 | 98581 | 507.69 | 952 | 934 | 192.3 |
| A | 13 | 254 | 13172 | 63.63 | 952 | 934 | 192.3 |
| A | 3 | 137 | 9498 | 44.53 | 952 | 934 | 192.3 |
| B | 10 | 245 | 100181 | 545.74 | 949 | 924 | 181.9 |
| B | 0 | 190 | 50520 | 272.69 | 949 | 924 | 181.9 |
| B | 12 | 111 | 22753 | 120.02 | 949 | 924 | 181.9 |
| C | 14 | 238 | 145821 | 673.11 | 916 | 924 | 215.3 |
| C | 3 | 233 | 133614 | 616.4 | 916 | 924 | 215.3 |
| C | 9 | 54 | 64309 | 294.45 | 916 | 924 | 215.3 |
| D | 8 | 195 | 2569922 | 12022.15 | 894 | 871 | 213.7 |
| D | 1 | 52 | 754592 | 3527.12 | 894 | 871 | 213.7 |
| D | 2 | 250 | 76840 | 355.51 | 894 | 871 | 213.7 |
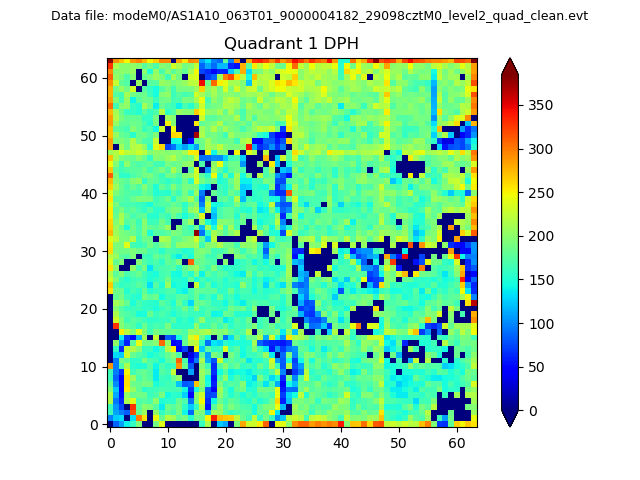
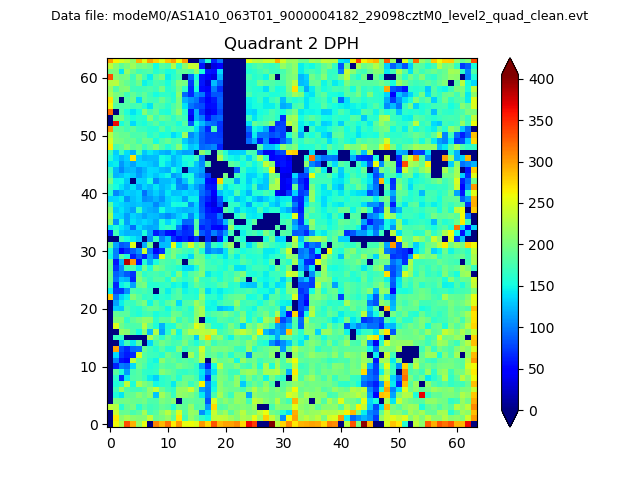
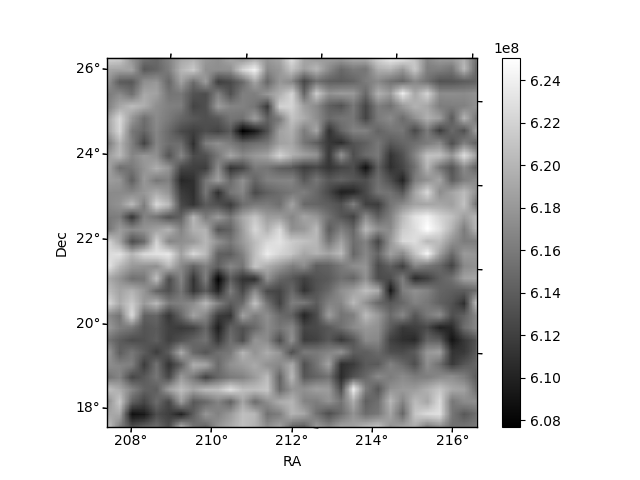
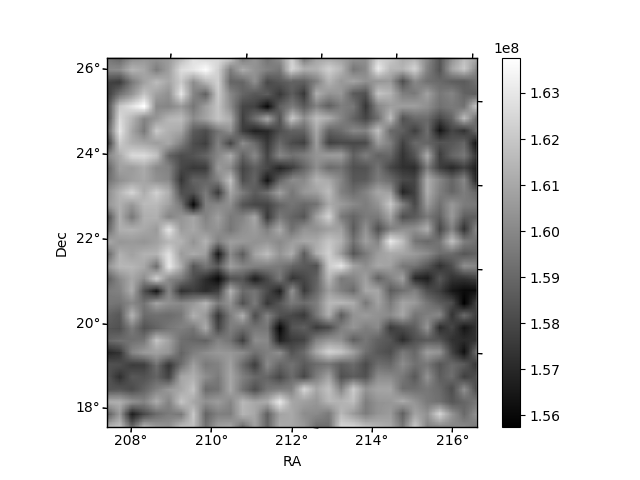
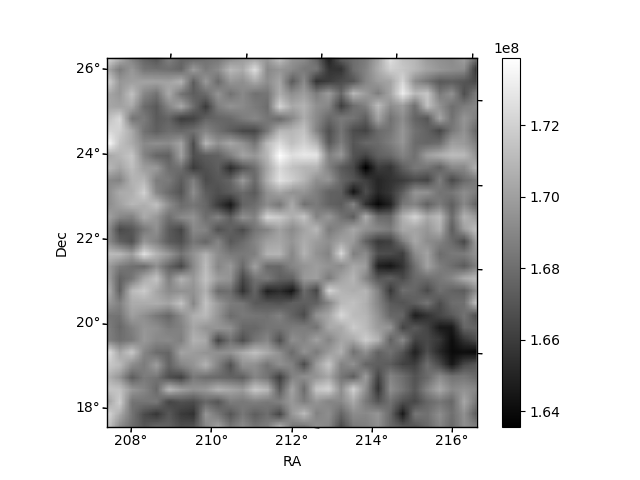
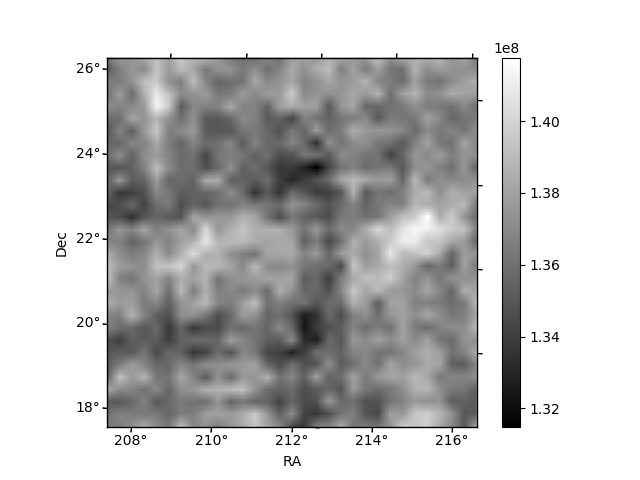
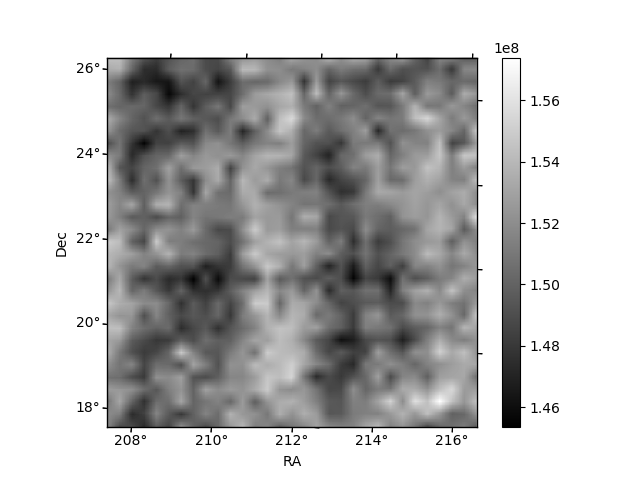
Histogram calculated using DETX and DETY for each event in the final _common_clean file
| Quadrant A | 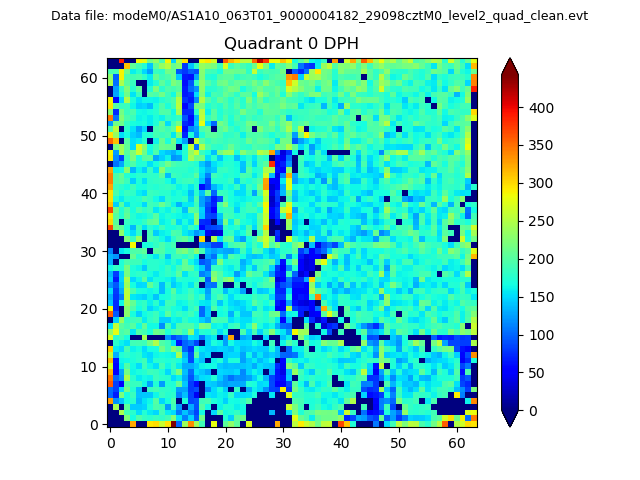 |
 |
Quadrant B |
|---|---|---|---|
| Quadrant D | 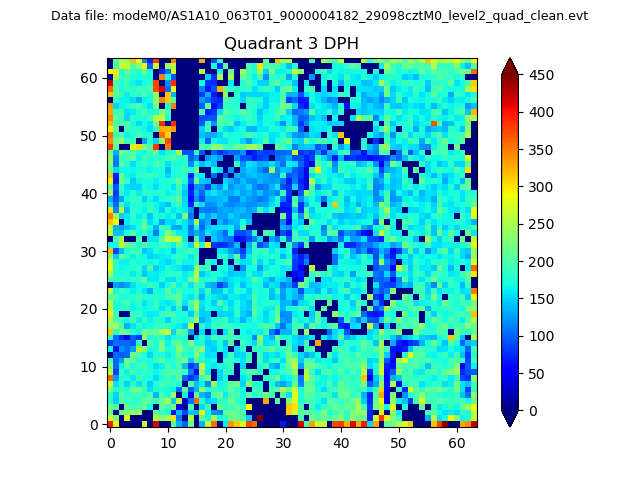 |
 |
Quadrant C |
| Plot type | Count rate plots | Images |
|---|---|---|
| Comparison with Poisson distribution Blue bars denote a histogram of data divided into 1 sec bins. Red curve is a Poisson curve with rate = median count rate of data. |
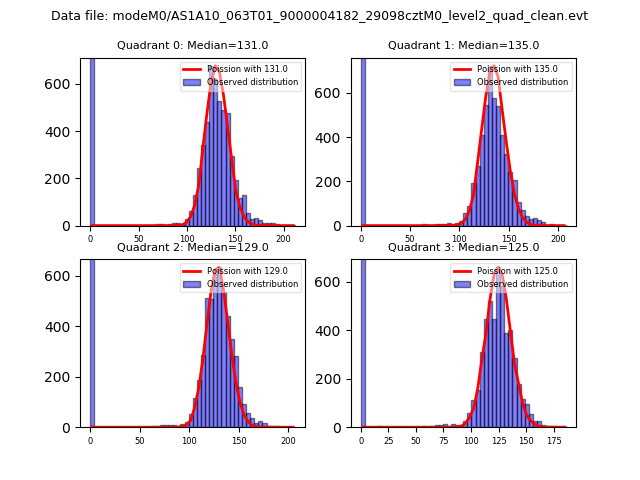 |
 |
| Quadrant-wise count rates Data is divided into 100 sec bins |
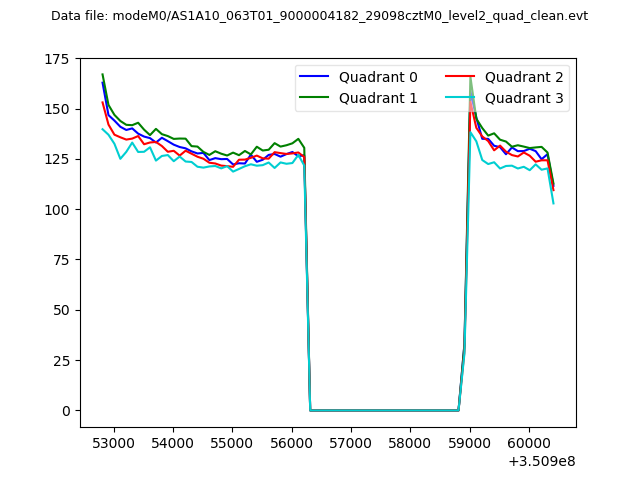 |
|
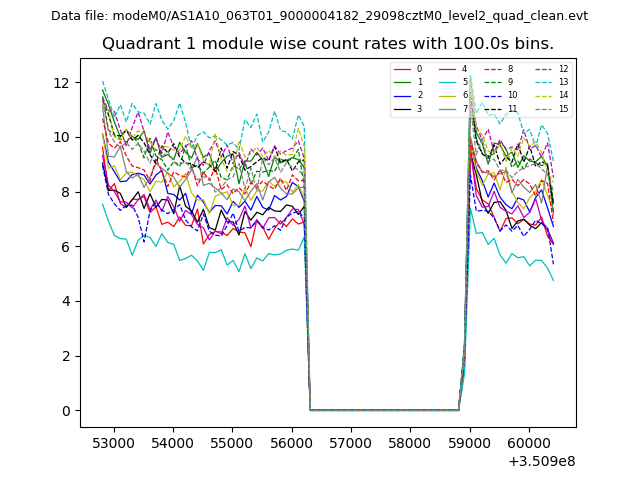
| Module-wise count rates for Quadrant A Data is divided into 100 sec bins |
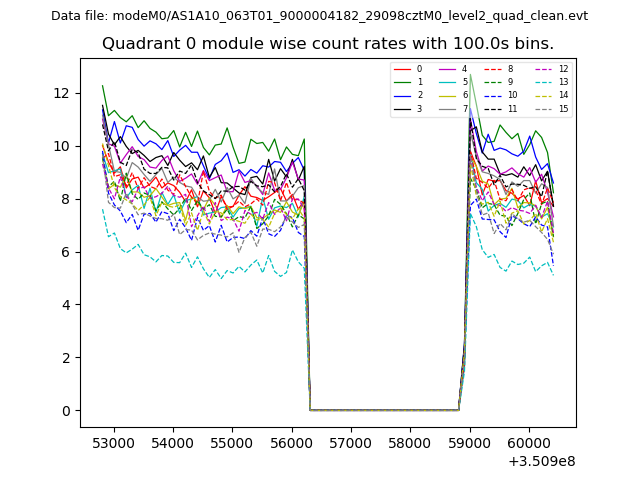 |
 |
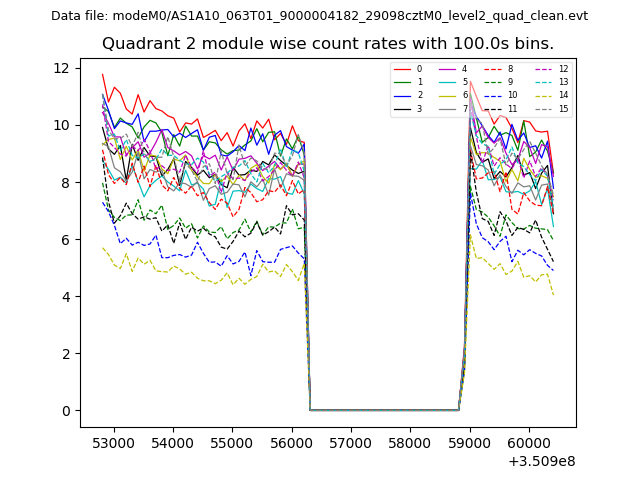
| Module-wise count rates for Quadrant B Data is divided into 100 sec bins |
 |
 |
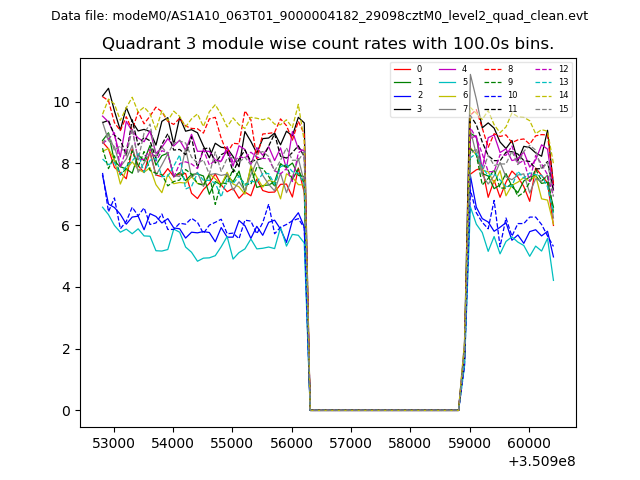
| Module-wise count rates for Quadrant C Data is divided into 100 sec bins |
 |
 |
| Module-wise count rates for Quadrant D Data is divided into 100 sec bins |
 |
 |
| Parameter | Plot |
|---|---|
| CZT HV Monitor | 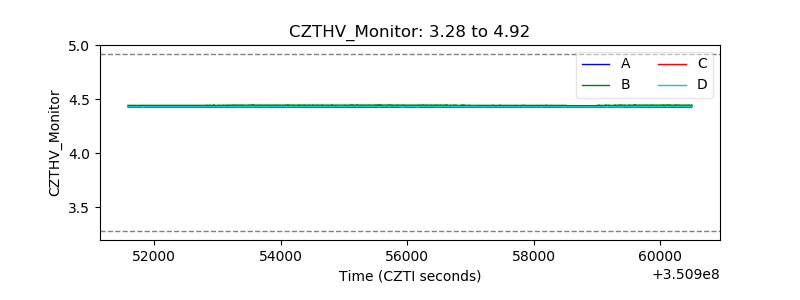 |
| D_VDD | 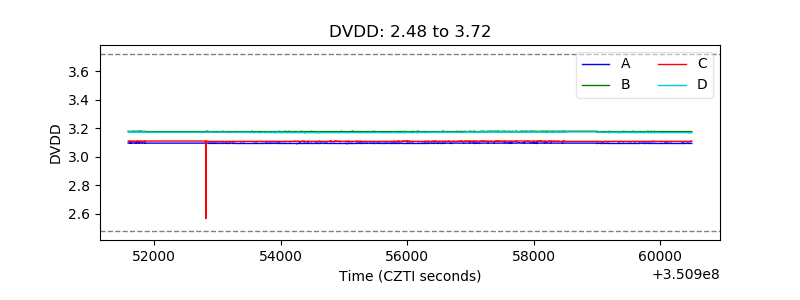 |
| Temperature 1 |  |
| Veto HV Monitor | 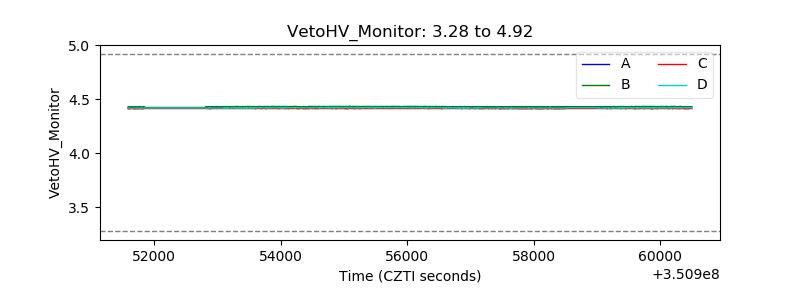 |
| Veto LLD | 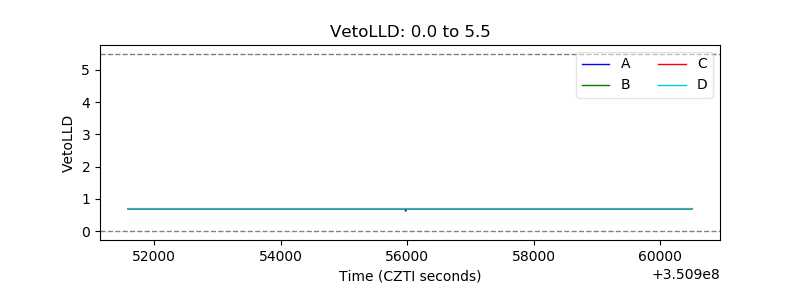 |
| Alpha Counter |  |
| _CPM_Rate | 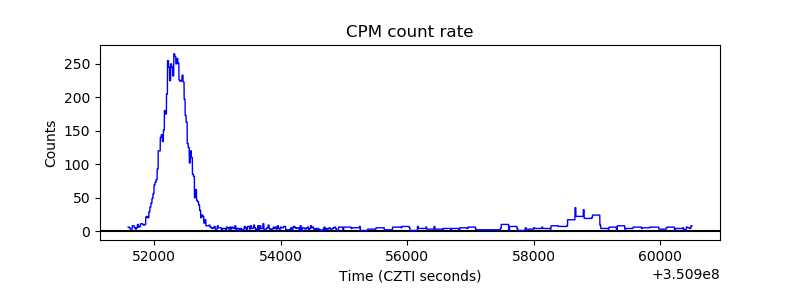 |
| CZT Counter | 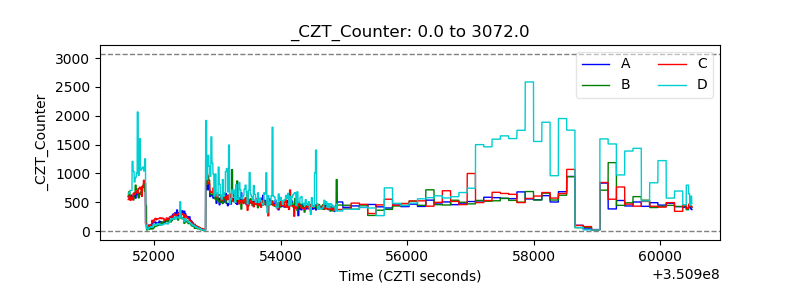 |
| +2.5 Volts monitor |  |
| +5 Volts monitor |  |
| _ROLL_ROT |  |
| _Roll_DEC | 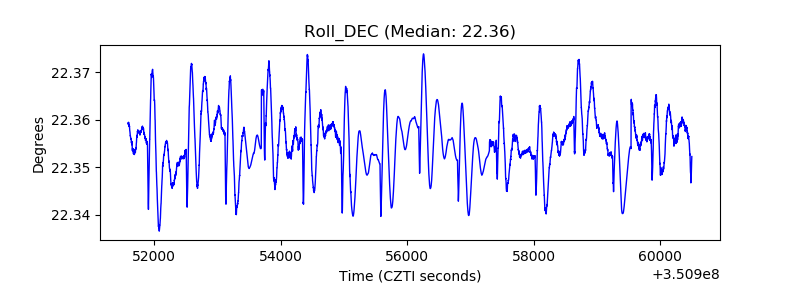 |
| _Roll_RA | 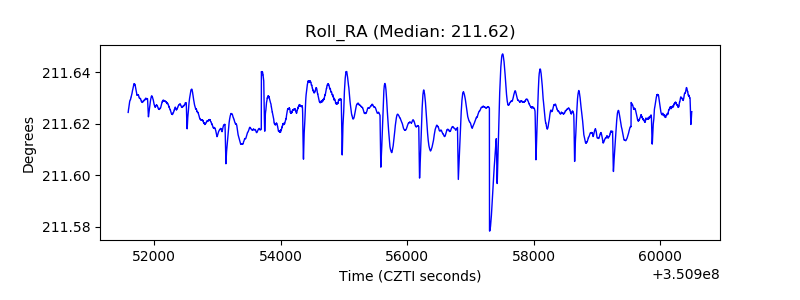 |
| Veto Counter | 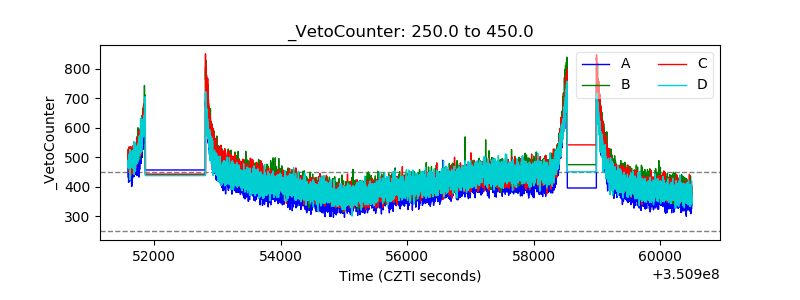 |