| Param | Original file | Final file |
|---|---|---|
| Filename | modeM0/AS1A10_063T01_9000004182_29100cztM0_level2.evt | modeM0/AS1A10_063T01_9000004182_29100cztM0_level2_quad_clean.evt |
| Size (bytes) | 730,555,200 | 108,547,200 |
| Size | 696.7 MB | 103.5 MB |
| Events in quadrant A | 3,744,238 | 706,143 |
| Events in quadrant B | 4,168,205 | 716,442 |
| Events in quadrant C | 3,944,211 | 693,681 |
| Events in quadrant D | 9,739,984 | 627,262 |
| Mode M0 | |||
|---|---|---|---|
| Quadrant | BADHDUFLAG | Total packets | Discarded packets |
| A | 0 | 16247 | 1 |
| B | 0 | 17534 | 1 |
| C | 0 | 16663 | 1 |
| D | 0 | 34421 | 2 |
| Mode SS | |||
|---|---|---|---|
| Quadrant | BADHDUFLAG | Total packets | Discarded packets |
| A | 0 | 156 | 0 |
| B | 0 | 156 | 0 |
| C | 0 | 156 | 0 |
| D | 0 | 156 | 0 |
| Quadrant | Total seconds | Saturated seconds | Saturation percentage |
|---|---|---|---|
| A | 7810 | 226 | 2.893726% |
| B | 7810 | 324 | 4.148528% |
| C | 7811 | 262 | 3.354244% |
| D | 7810 | 1580 | 20.230474% |
Noise dominated data is calculated using 1-second bins in cleaned event files. If a bin has >2000 counts, and if more than 50% of those come from <1% of pixels, then it is considered to be noise-dominated and hence unusable.
| Quadrant | # 1 sec bins | Bins with >0 counts | Bins with >2000 counts | High rate bins dominated by noise | Noise dominated (total time) | Noise dominated (detector-on time) | Marked lightcurve |
|---|---|---|---|---|---|---|---|
| A | 7840 | 7811 | 0 | 0 | 0.00% | 0.00% | 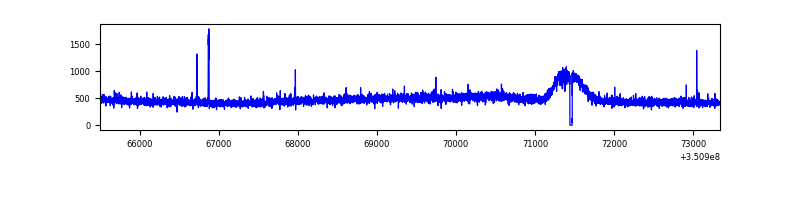 |
| B | 7840 | 7811 | 54 | 54 | 0.69% | 0.69% | 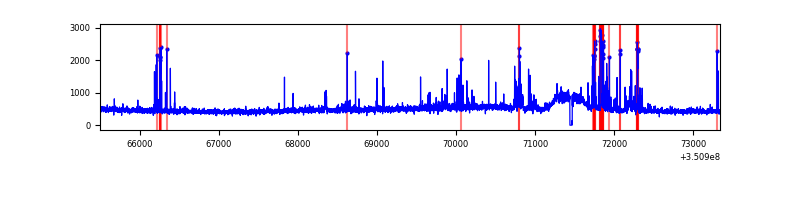 |
| C | 7841 | 7812 | 0 | 0 | 0.00% | 0.00% | 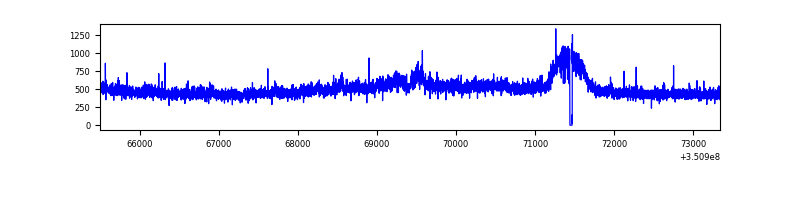 |
| D | 7840 | 7811 | 1183 | 1183 | 15.09% | 15.15% | 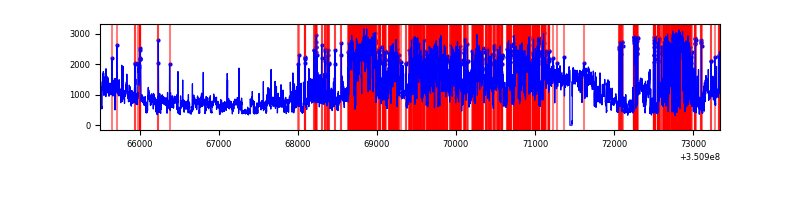 |
Top three noisy pixels from each quadrant. If the there are fewer than three noisy pixels in the level2.evt file, extra rows are filled as -1
| Pixel properties | Quadrant properties | ||||||
|---|---|---|---|---|---|---|---|
| Quadrant | DetID | PixID | Counts | Sigma | Mean | Median | Sigma |
| A | 6 | 16 | 18660 | 90.81 | 959 | 937 | 195.2 |
| A | 1 | 113 | 16250 | 78.46 | 959 | 937 | 195.2 |
| A | 13 | 254 | 13292 | 63.31 | 959 | 937 | 195.2 |
| B | 10 | 245 | 346630 | 1890.33 | 947 | 925 | 182.9 |
| B | 10 | 246 | 84804 | 458.65 | 947 | 925 | 182.9 |
| B | 12 | 111 | 23024 | 120.84 | 947 | 925 | 182.9 |
| C | 3 | 233 | 205148 | 945.97 | 915 | 919 | 215.9 |
| C | 14 | 238 | 145511 | 669.73 | 915 | 919 | 215.9 |
| C | 2 | 114 | 18525 | 81.55 | 915 | 919 | 215.9 |
| D | 1 | 52 | 3260740 | 15944.33 | 852 | 828 | 204.5 |
| D | 8 | 195 | 2880204 | 14083.12 | 852 | 828 | 204.5 |
| D | 12 | 233 | 265890 | 1296.43 | 852 | 828 | 204.5 |
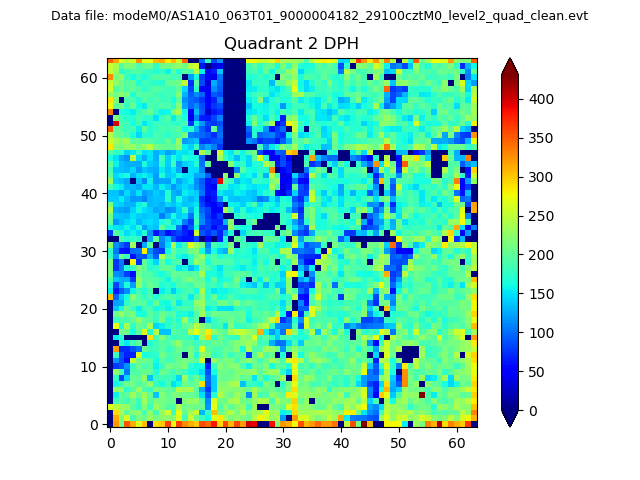
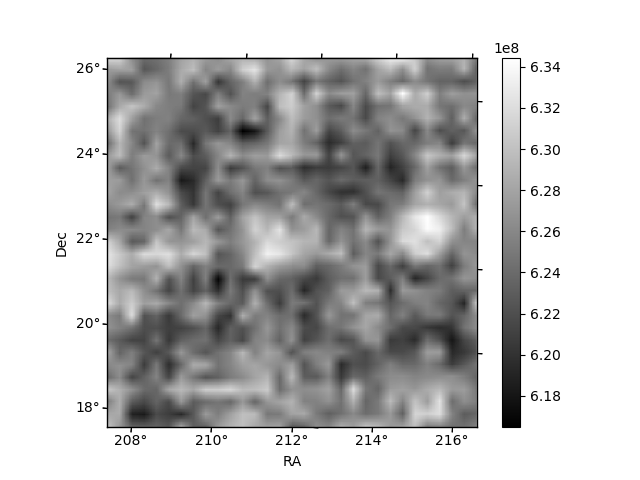
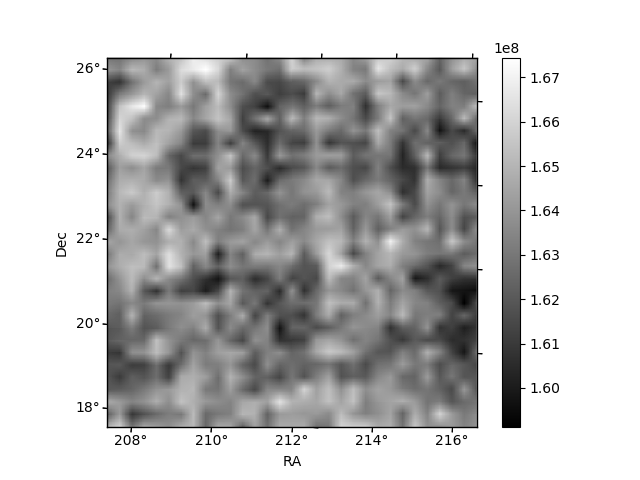
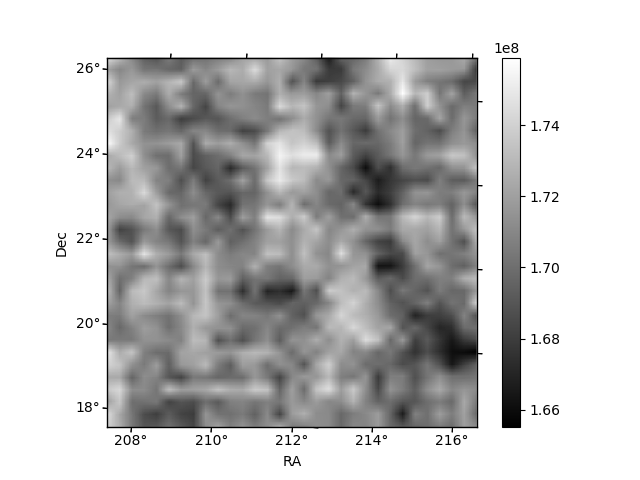
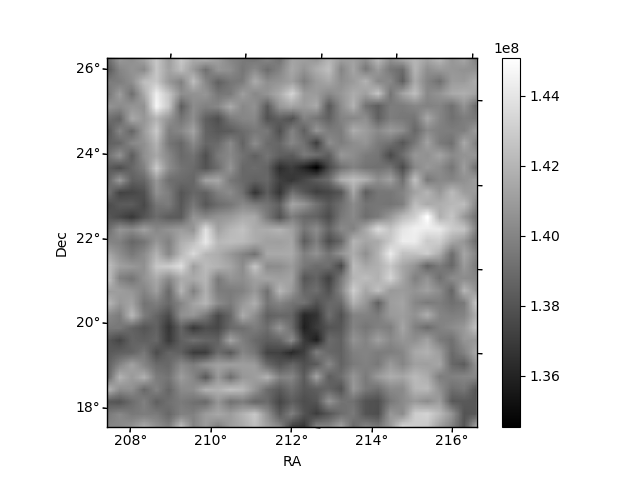
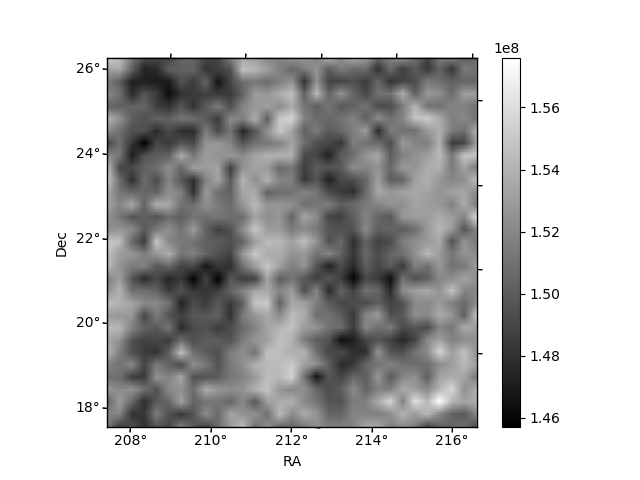
Histogram calculated using DETX and DETY for each event in the final _common_clean file
| Quadrant A | 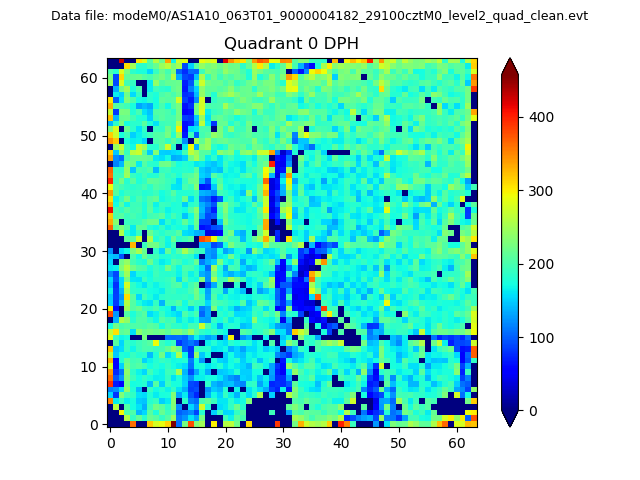 |
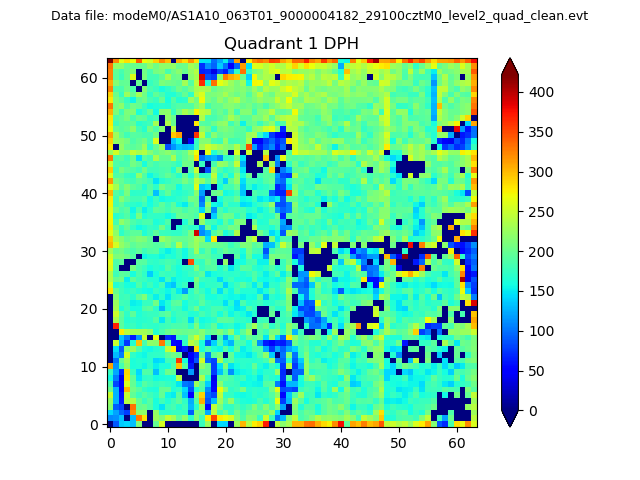 |
Quadrant B |
|---|---|---|---|
| Quadrant D | 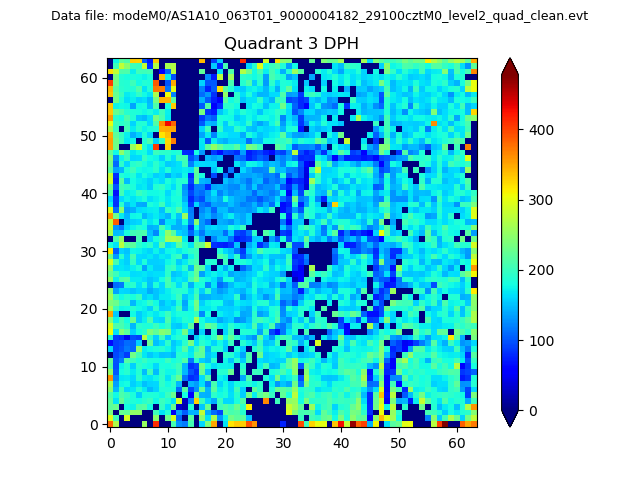 |
 |
Quadrant C |
| Plot type | Count rate plots | Images |
|---|---|---|
| Comparison with Poisson distribution Blue bars denote a histogram of data divided into 1 sec bins. Red curve is a Poisson curve with rate = median count rate of data. |
 |
 |
| Quadrant-wise count rates Data is divided into 100 sec bins |
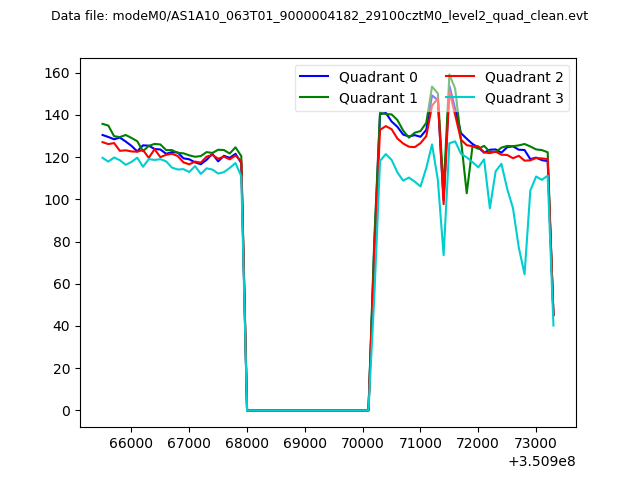 |
|
| Module-wise count rates for Quadrant A Data is divided into 100 sec bins |
 |
 |
| Module-wise count rates for Quadrant B Data is divided into 100 sec bins |
 |
 |
| Module-wise count rates for Quadrant C Data is divided into 100 sec bins |
 |
 |
| Module-wise count rates for Quadrant D Data is divided into 100 sec bins |
 |
 |
| Parameter | Plot |
|---|---|
| CZT HV Monitor | 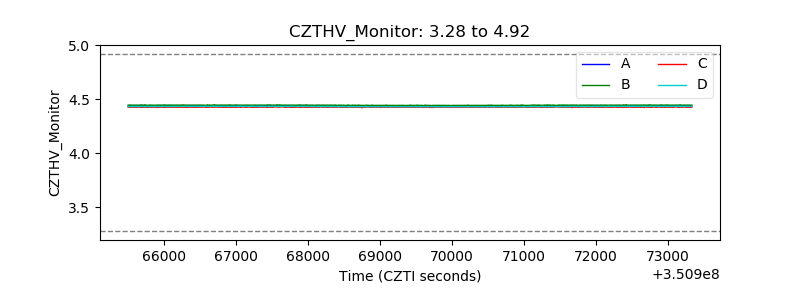 |
| D_VDD | 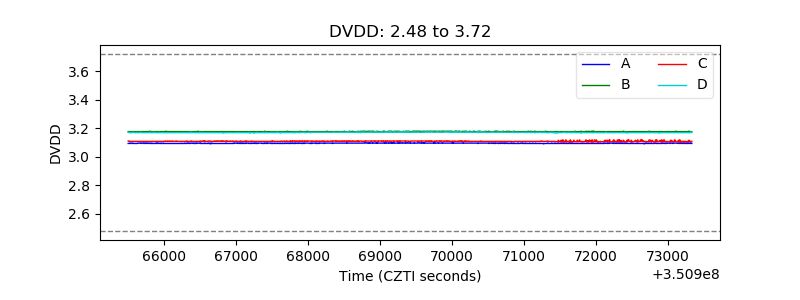 |
| Temperature 1 | 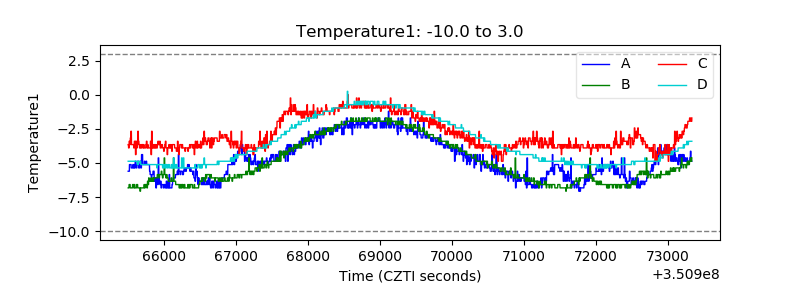 |
| Veto HV Monitor | 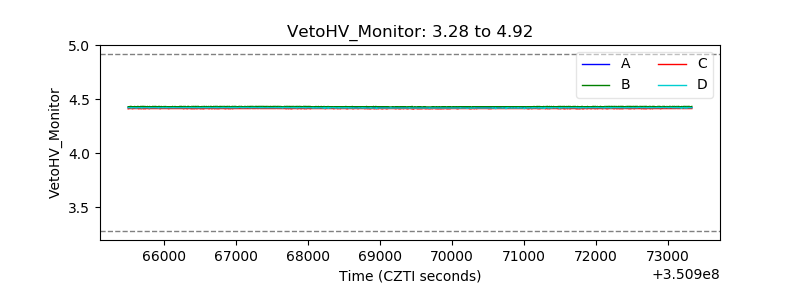 |
| Veto LLD |  |
| Alpha Counter | 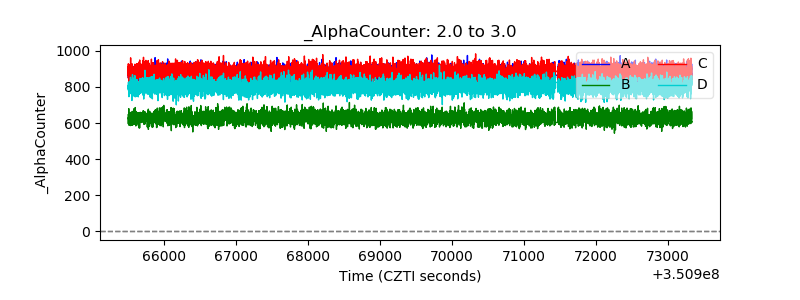 |
| _CPM_Rate | 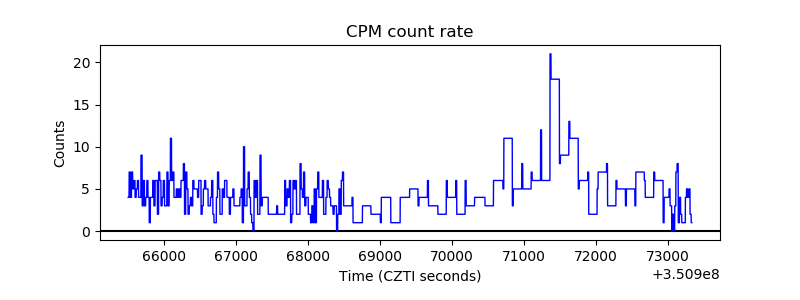 |
| CZT Counter | 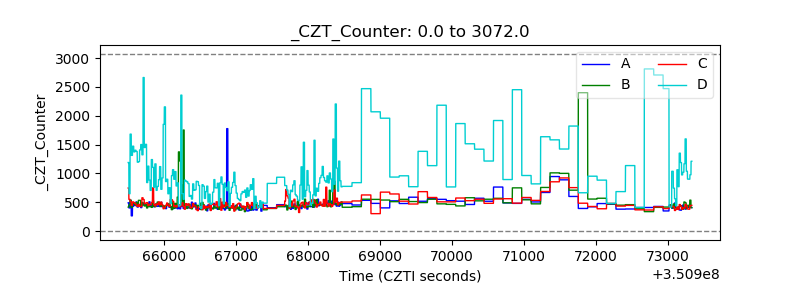 |
| +2.5 Volts monitor | 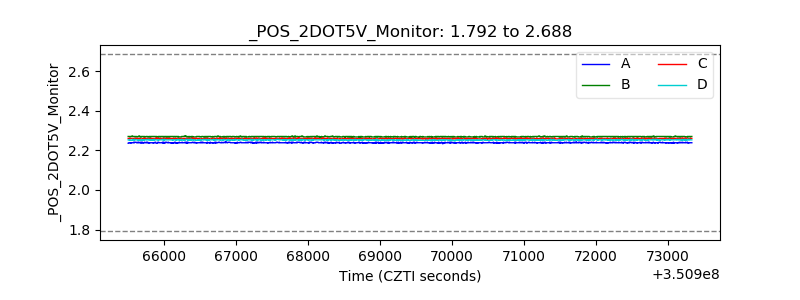 |
| +5 Volts monitor | 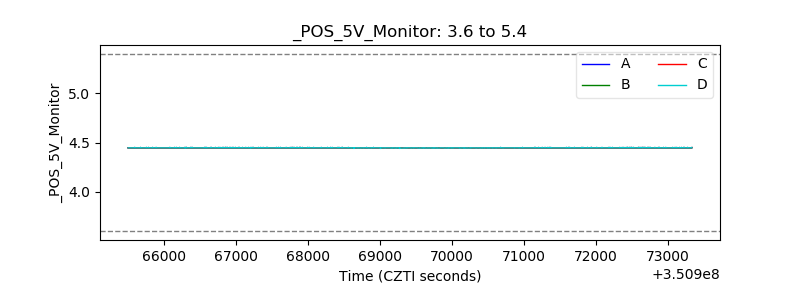 |
| _ROLL_ROT |  |
| _Roll_DEC |  |
| _Roll_RA | 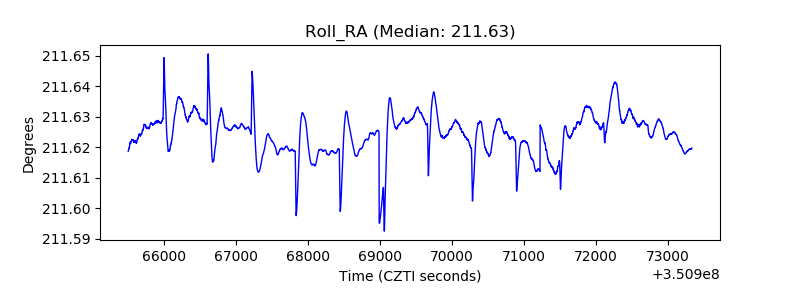 |
| Veto Counter |  |