| Param | Original file | Final file |
|---|---|---|
| Filename | modeM0/AS1A10_063T01_9000004182_29103cztM0_level2.evt | modeM0/AS1A10_063T01_9000004182_29103cztM0_level2_quad_clean.evt |
| Size (bytes) | 1,688,163,840 | 220,167,360 |
| Size | 1.6 GB | 210.0 MB |
| Events in quadrant A | 8,577,179 | 1,394,768 |
| Events in quadrant B | 8,935,524 | 1,426,395 |
| Events in quadrant C | 9,022,307 | 1,372,315 |
| Events in quadrant D | 23,361,962 | 1,217,106 |
| Mode M0 | |||
|---|---|---|---|
| Quadrant | BADHDUFLAG | Total packets | Discarded packets |
| A | 0 | 37060 | 3 |
| B | 0 | 37913 | 3 |
| C | 0 | 37926 | 3 |
| D | 0 | 81940 | 3 |
| Mode M9 | |||
|---|---|---|---|
| Quadrant | BADHDUFLAG | Total packets | Discarded packets |
| A | 0 | 18 | 0 |
| B | 0 | 18 | 0 |
| C | 0 | 18 | 0 |
| D | 0 | 18 | 0 |
| Mode SS | |||
|---|---|---|---|
| Quadrant | BADHDUFLAG | Total packets | Discarded packets |
| A | 0 | 372 | 0 |
| B | 0 | 372 | 0 |
| C | 0 | 372 | 0 |
| D | 0 | 372 | 0 |
| Quadrant | Total seconds | Saturated seconds | Saturation percentage |
|---|---|---|---|
| A | 18229 | 179 | 0.981952% |
| B | 18229 | 207 | 1.135553% |
| C | 18230 | 259 | 1.420735% |
| D | 18230 | 4397 | 24.119583% |
Noise dominated data is calculated using 1-second bins in cleaned event files. If a bin has >2000 counts, and if more than 50% of those come from <1% of pixels, then it is considered to be noise-dominated and hence unusable.
| Quadrant | # 1 sec bins | Bins with >0 counts | Bins with >2000 counts | High rate bins dominated by noise | Noise dominated (total time) | Noise dominated (detector-on time) | Marked lightcurve |
|---|---|---|---|---|---|---|---|
| A | 20014 | 18232 | 0 | 0 | 0.00% | 0.00% | 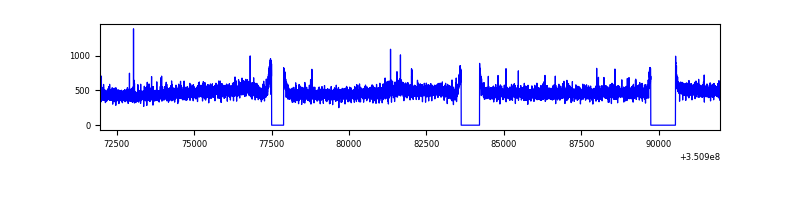 |
| B | 20014 | 18232 | 21 | 21 | 0.10% | 0.12% | 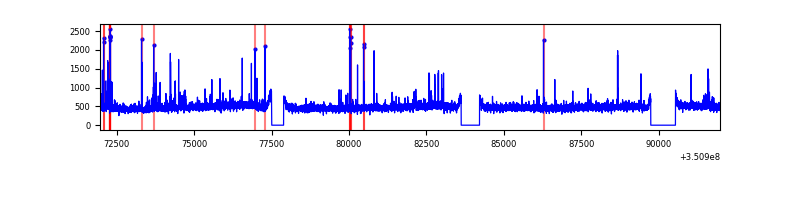 |
| C | 20015 | 18233 | 3 | 3 | 0.01% | 0.02% | 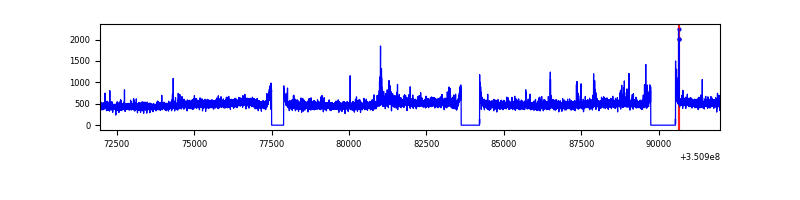 |
| D | 20015 | 18233 | 4286 | 4286 | 21.41% | 23.51% | 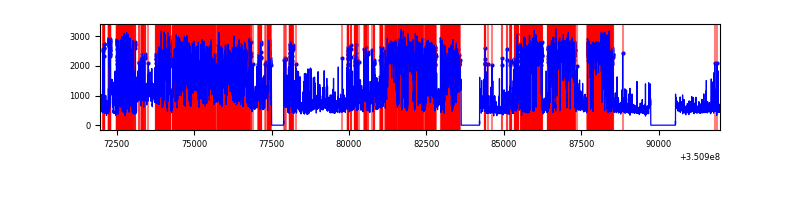 |
Top three noisy pixels from each quadrant. If the there are fewer than three noisy pixels in the level2.evt file, extra rows are filled as -1
| Pixel properties | Quadrant properties | ||||||
|---|---|---|---|---|---|---|---|
| Quadrant | DetID | PixID | Counts | Sigma | Mean | Median | Sigma |
| A | 6 | 16 | 32331 | 68.03 | 2208 | 2159 | 443.5 |
| A | 13 | 254 | 31279 | 65.66 | 2208 | 2159 | 443.5 |
| A | 3 | 137 | 22157 | 45.09 | 2208 | 2159 | 443.5 |
| B | 10 | 245 | 217773 | 515.31 | 2189 | 2132 | 418.5 |
| B | 0 | 190 | 61595 | 142.1 | 2189 | 2132 | 418.5 |
| B | 12 | 111 | 53287 | 122.24 | 2189 | 2132 | 418.5 |
| C | 3 | 233 | 380160 | 756.53 | 2114 | 2122 | 499.7 |
| C | 14 | 238 | 338735 | 673.63 | 2114 | 2122 | 499.7 |
| C | 2 | 114 | 42960 | 81.72 | 2114 | 2122 | 499.7 |
| D | 1 | 52 | 10500928 | 22790.46 | 1929 | 1877 | 460.7 |
| D | 8 | 195 | 5243736 | 11378.59 | 1929 | 1877 | 460.7 |
| D | 12 | 233 | 158499 | 339.98 | 1929 | 1877 | 460.7 |
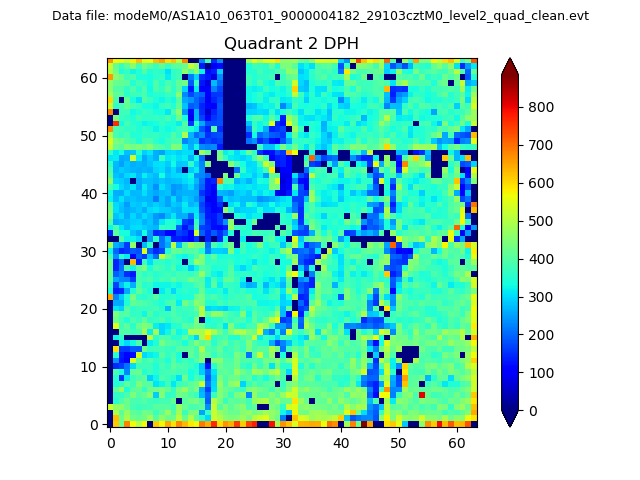
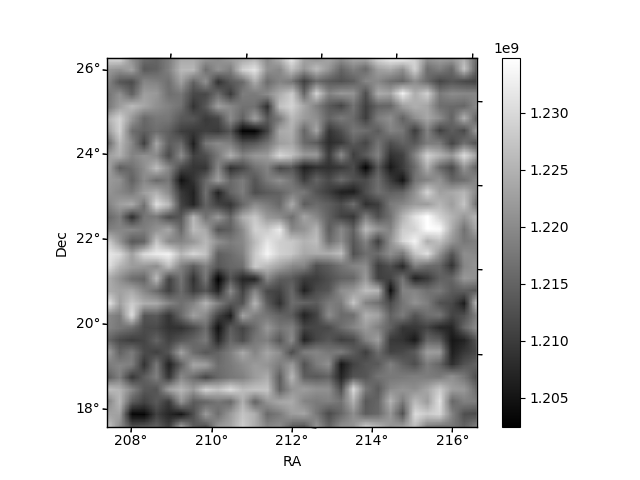
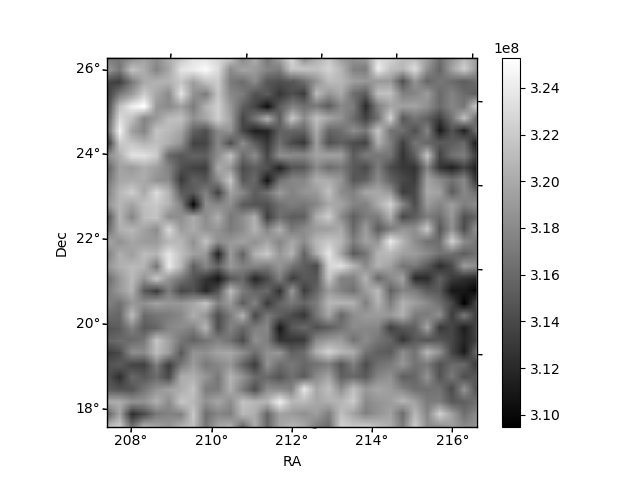
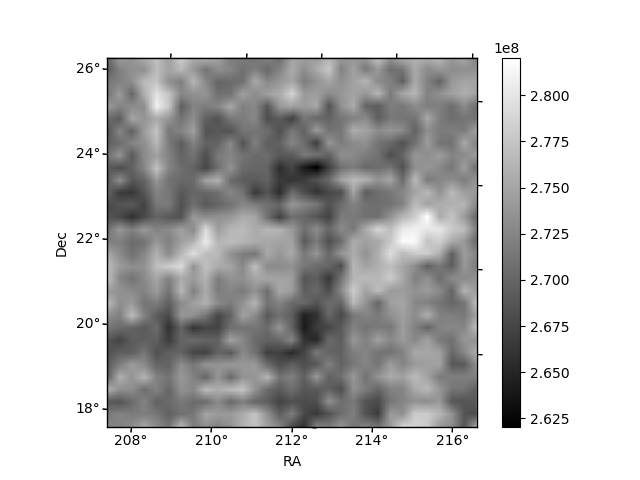
Histogram calculated using DETX and DETY for each event in the final _common_clean file
| Quadrant A | 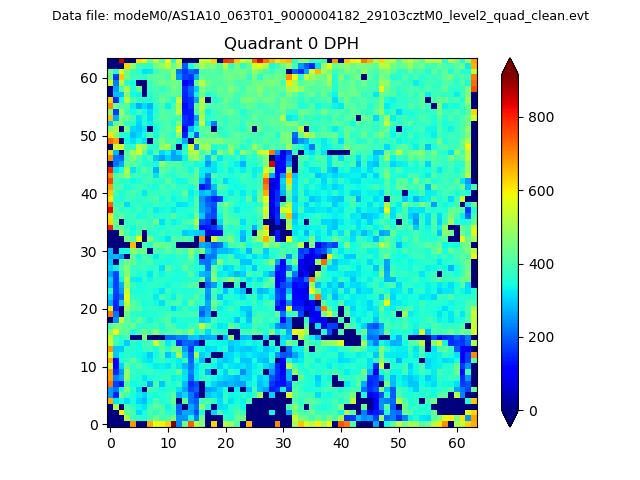 |
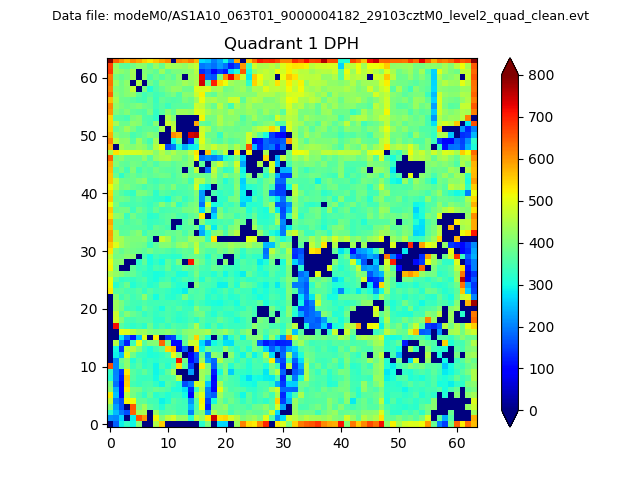 |
Quadrant B |
|---|---|---|---|
| Quadrant D | 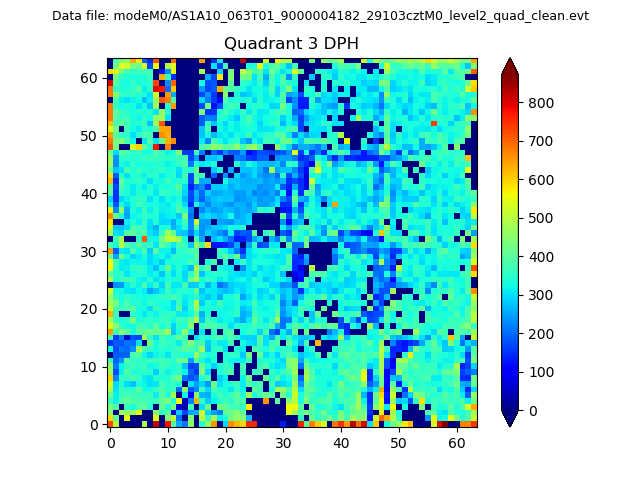 |
 |
Quadrant C |
| Plot type | Count rate plots | Images |
|---|---|---|
| Comparison with Poisson distribution Blue bars denote a histogram of data divided into 1 sec bins. Red curve is a Poisson curve with rate = median count rate of data. |
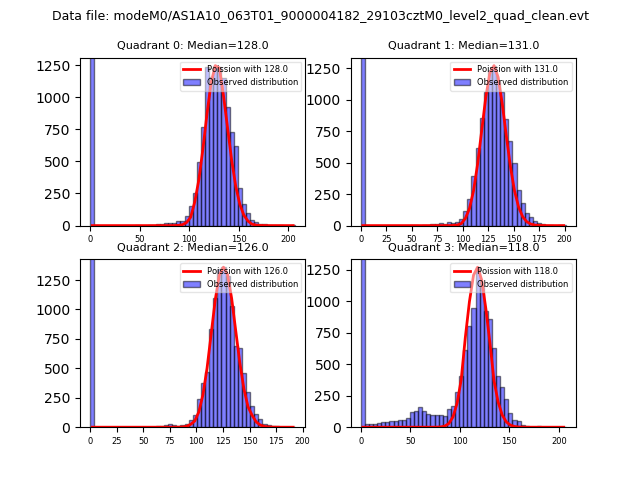 |
 |
| Quadrant-wise count rates Data is divided into 100 sec bins |
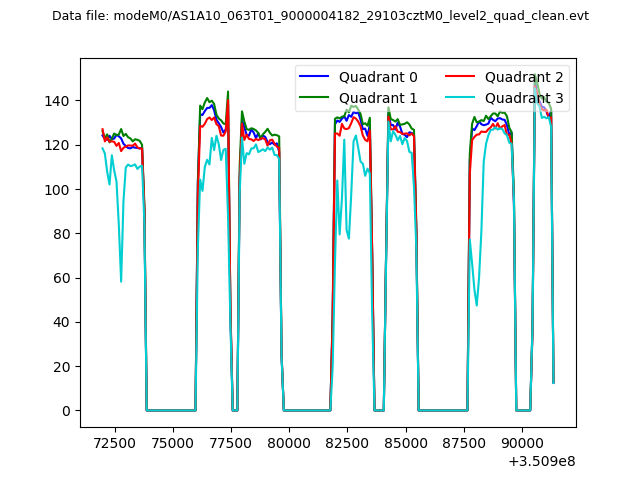 |
|
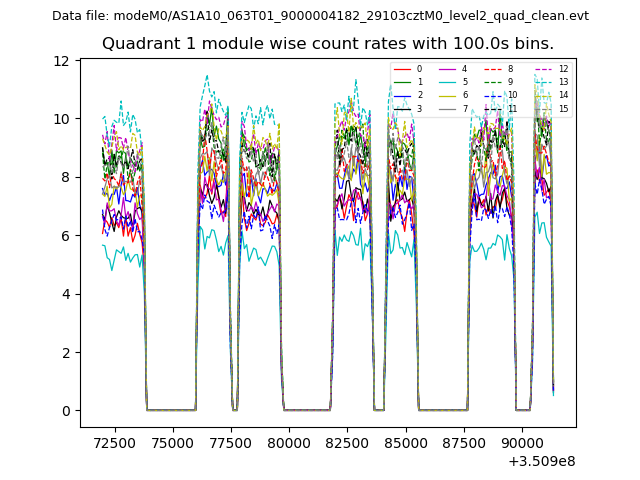
| Module-wise count rates for Quadrant A Data is divided into 100 sec bins |
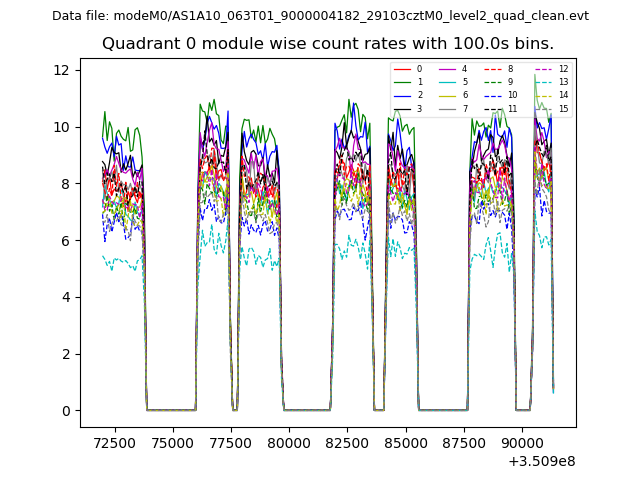 |
 |
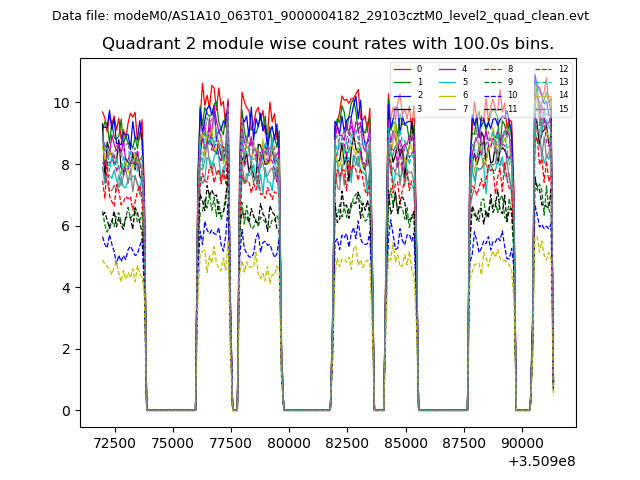
| Module-wise count rates for Quadrant B Data is divided into 100 sec bins |
 |
 |
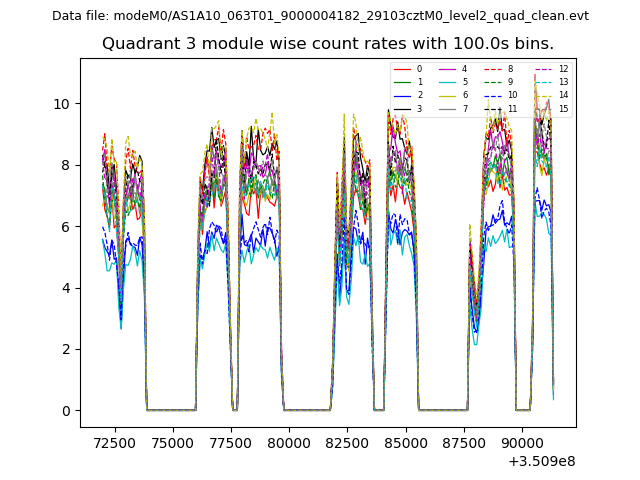
| Module-wise count rates for Quadrant C Data is divided into 100 sec bins |
 |
 |
| Module-wise count rates for Quadrant D Data is divided into 100 sec bins |
 |
 |
| Parameter | Plot |
|---|---|
| CZT HV Monitor | 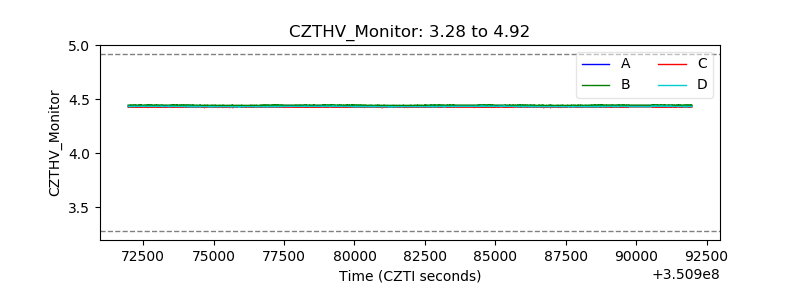 |
| D_VDD | 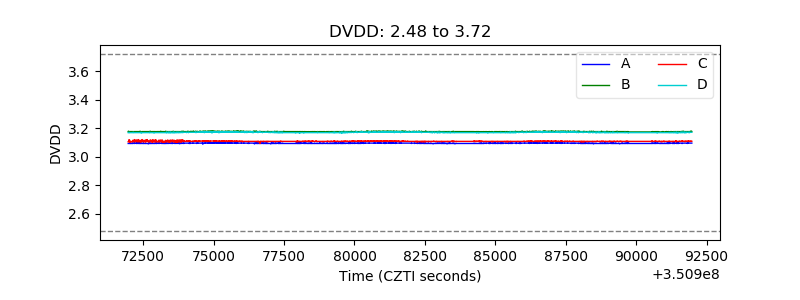 |
| Temperature 1 | 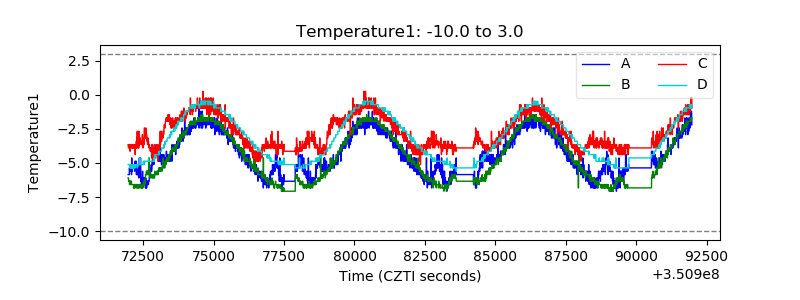 |
| Veto HV Monitor | 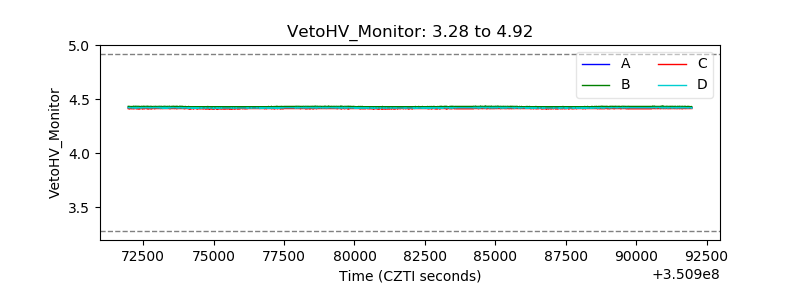 |
| Veto LLD | 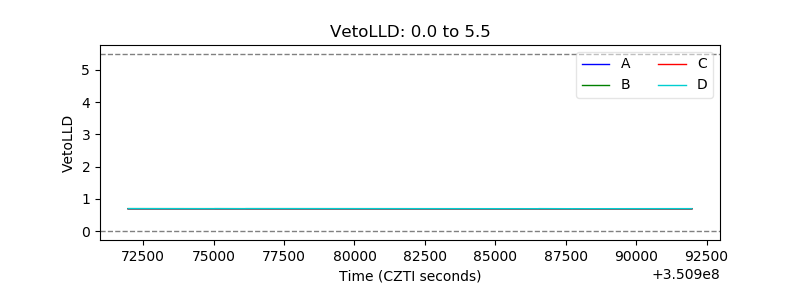 |
| Alpha Counter | 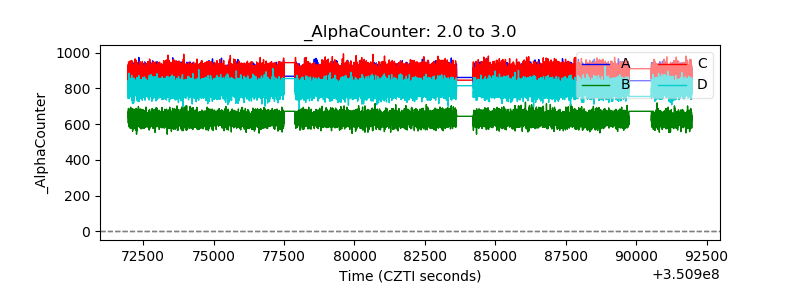 |
| _CPM_Rate | 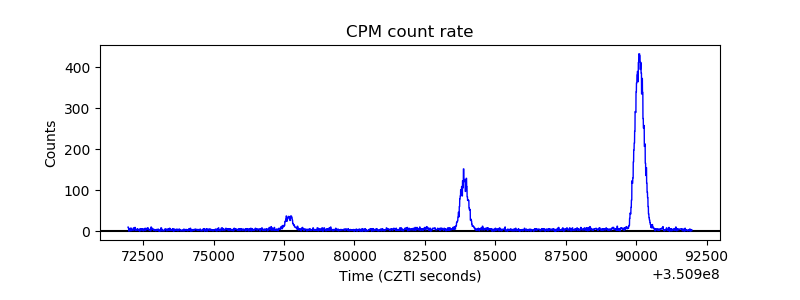 |
| CZT Counter | 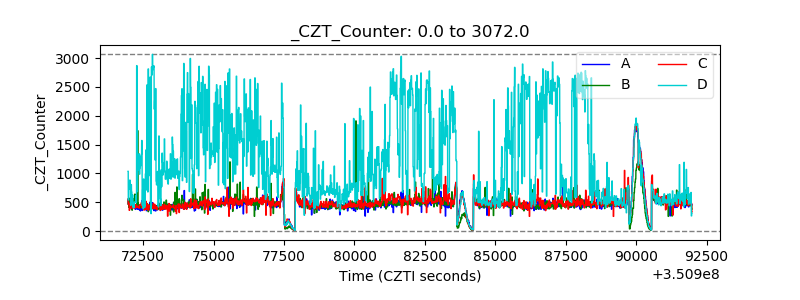 |
| +2.5 Volts monitor |  |
| +5 Volts monitor |  |
| _ROLL_ROT | 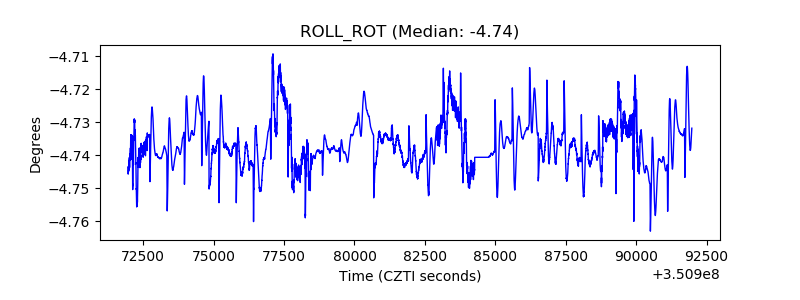 |
| _Roll_DEC | 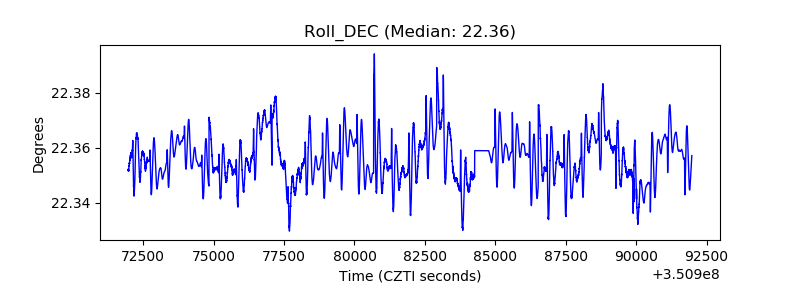 |
| _Roll_RA | 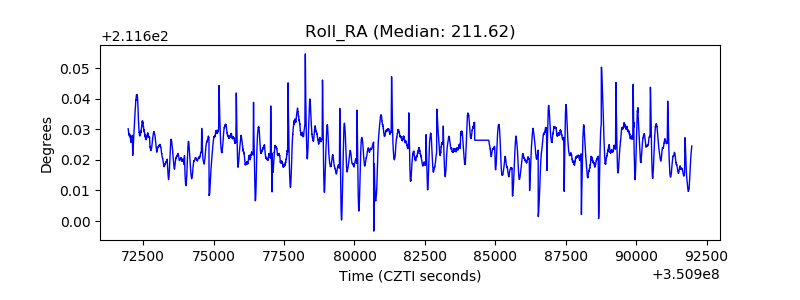 |
| Veto Counter | 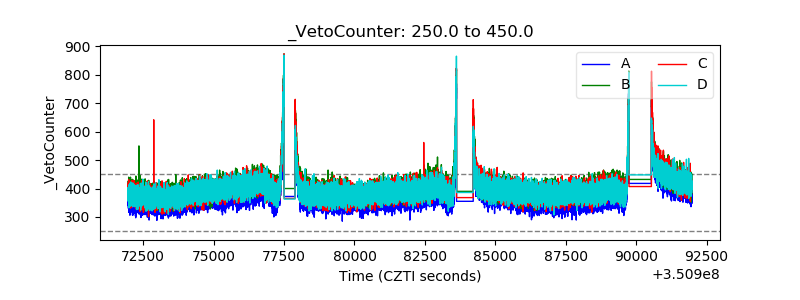 |