| Param | Original file | Final file |
|---|---|---|
| Filename | modeM0/AS1A10_063T01_9000004182_29104cztM0_level2.evt | modeM0/AS1A10_063T01_9000004182_29104cztM0_level2_quad_clean.evt |
| Size (bytes) | 516,775,680 | 74,131,200 |
| Size | 492.8 MB | 70.7 MB |
| Events in quadrant A | 3,249,669 | 451,664 |
| Events in quadrant B | 3,355,244 | 461,614 |
| Events in quadrant C | 3,696,013 | 441,446 |
| Events in quadrant D | 4,898,948 | 426,647 |
| Mode M0 | |||
|---|---|---|---|
| Quadrant | BADHDUFLAG | Total packets | Discarded packets |
| A | 0 | 13722 | 1 |
| B | 0 | 13990 | 1 |
| C | 0 | 15109 | 1 |
| D | 0 | 18971 | 2 |
| Mode M9 | |||
|---|---|---|---|
| Quadrant | BADHDUFLAG | Total packets | Discarded packets |
| A | 0 | 9 | 0 |
| B | 0 | 9 | 0 |
| C | 0 | 9 | 0 |
| D | 0 | 9 | 0 |
| Mode SS | |||
|---|---|---|---|
| Quadrant | BADHDUFLAG | Total packets | Discarded packets |
| A | 0 | 136 | 0 |
| B | 0 | 136 | 0 |
| C | 0 | 136 | 0 |
| D | 0 | 136 | 0 |
| Quadrant | Total seconds | Saturated seconds | Saturation percentage |
|---|---|---|---|
| A | 6639 | 57 | 0.858563% |
| B | 6639 | 54 | 0.813376% |
| C | 6639 | 117 | 1.762314% |
| D | 6638 | 389 | 5.860199% |
Noise dominated data is calculated using 1-second bins in cleaned event files. If a bin has >2000 counts, and if more than 50% of those come from <1% of pixels, then it is considered to be noise-dominated and hence unusable.
| Quadrant | # 1 sec bins | Bins with >0 counts | Bins with >2000 counts | High rate bins dominated by noise | Noise dominated (total time) | Noise dominated (detector-on time) | Marked lightcurve |
|---|---|---|---|---|---|---|---|
| A | 7614 | 6640 | 0 | 0 | 0.00% | 0.00% | 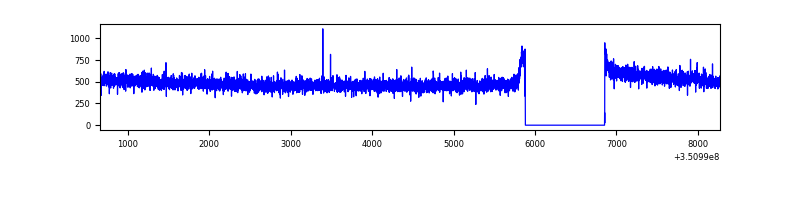 |
| B | 7614 | 6640 | 4 | 4 | 0.05% | 0.06% | 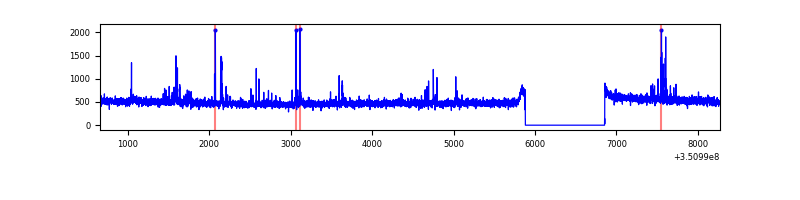 |
| C | 7614 | 6640 | 2 | 2 | 0.03% | 0.03% | 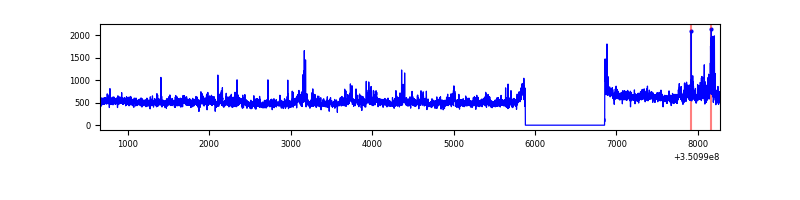 |
| D | 7613 | 6639 | 292 | 292 | 3.84% | 4.40% | 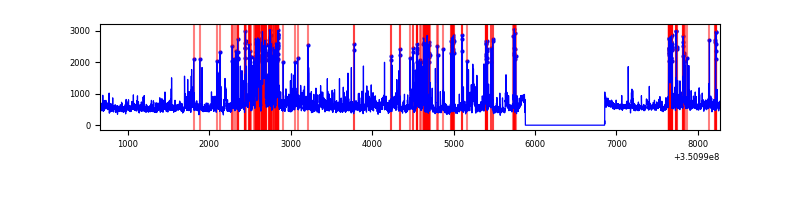 |
Top three noisy pixels from each quadrant. If the there are fewer than three noisy pixels in the level2.evt file, extra rows are filled as -1
| Pixel properties | Quadrant properties | ||||||
|---|---|---|---|---|---|---|---|
| Quadrant | DetID | PixID | Counts | Sigma | Mean | Median | Sigma |
| A | 13 | 254 | 10989 | 60.63 | 839 | 822 | 167.7 |
| A | 3 | 137 | 8163 | 43.78 | 839 | 822 | 167.7 |
| A | 13 | 6 | 7496 | 39.8 | 839 | 822 | 167.7 |
| B | 0 | 190 | 44451 | 272.25 | 828 | 806 | 160.3 |
| B | 10 | 245 | 41228 | 252.15 | 828 | 806 | 160.3 |
| B | 12 | 111 | 19768 | 118.28 | 828 | 806 | 160.3 |
| C | 3 | 233 | 421139 | 2254.93 | 799 | 807 | 186.4 |
| C | 14 | 238 | 128794 | 686.6 | 799 | 807 | 186.4 |
| C | 10 | 9 | 16289 | 83.06 | 799 | 807 | 186.4 |
| D | 1 | 52 | 1129431 | 5978.11 | 793 | 774 | 188.8 |
| D | 8 | 195 | 546374 | 2889.86 | 793 | 774 | 188.8 |
| D | 13 | 104 | 171968 | 906.76 | 793 | 774 | 188.8 |
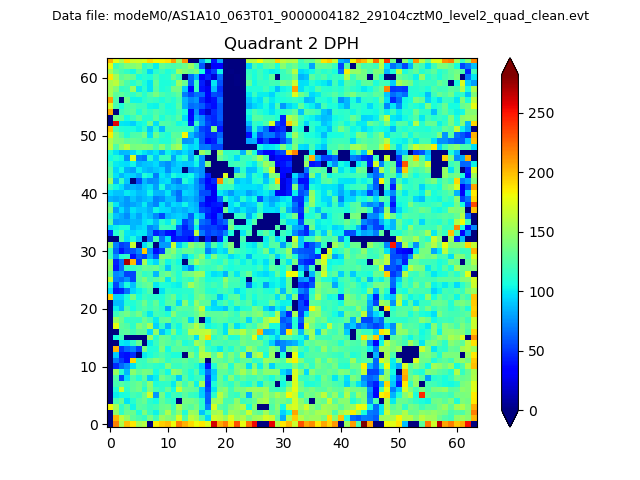
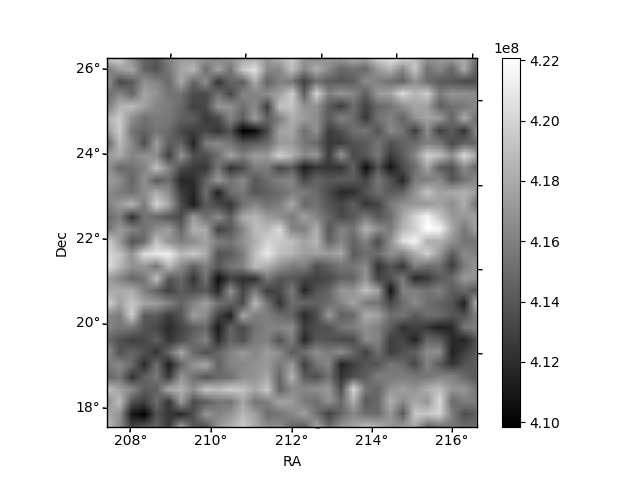
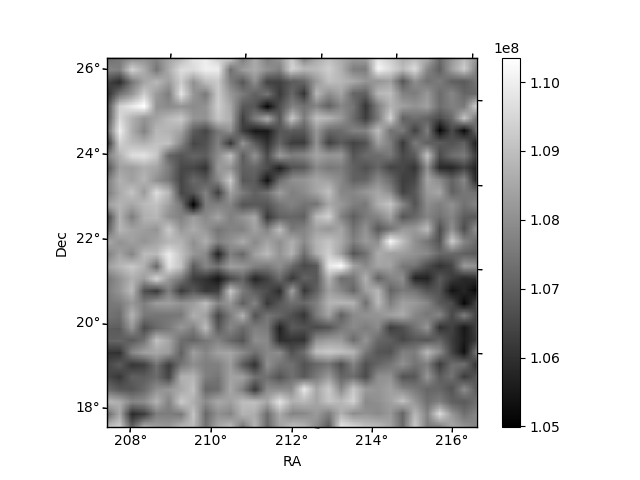
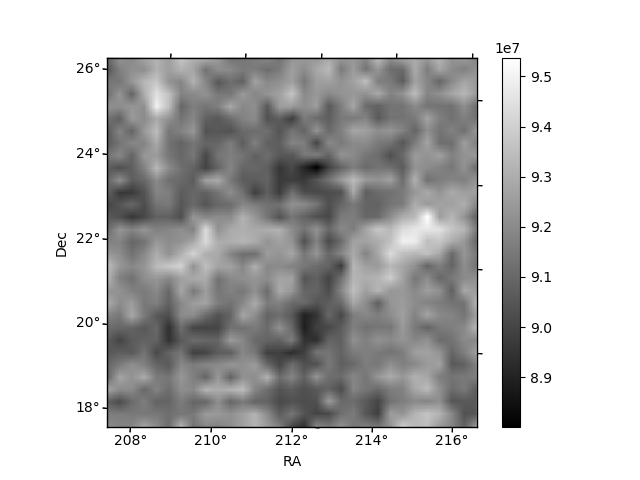
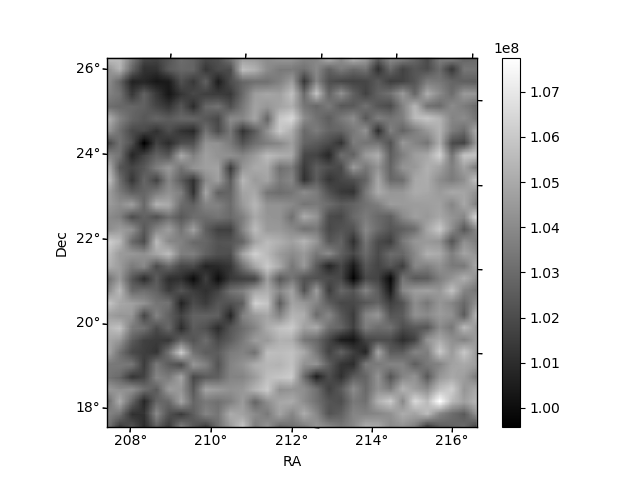
Histogram calculated using DETX and DETY for each event in the final _common_clean file
| Quadrant A | 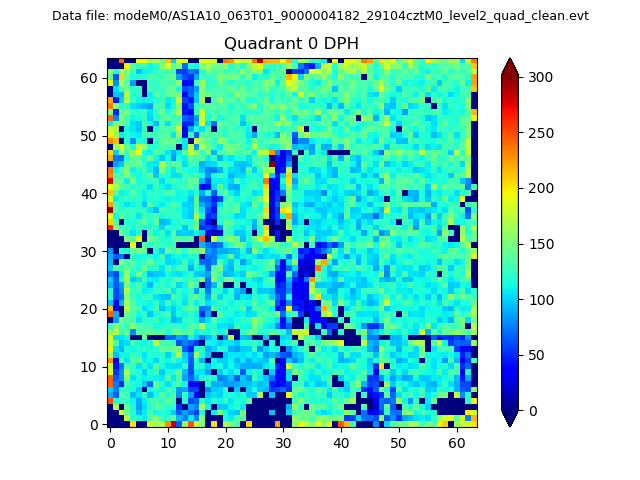 |
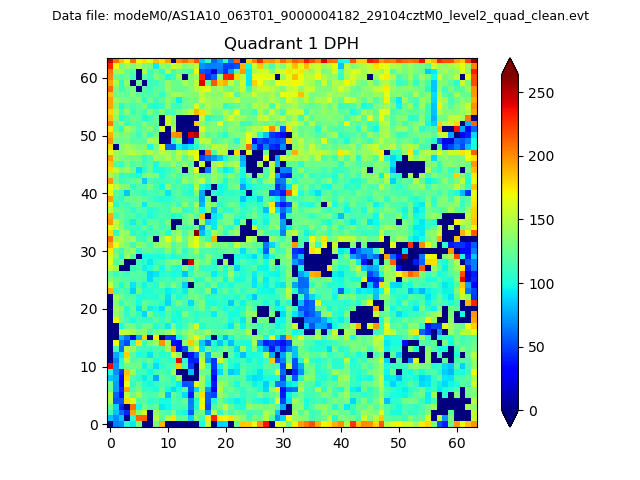 |
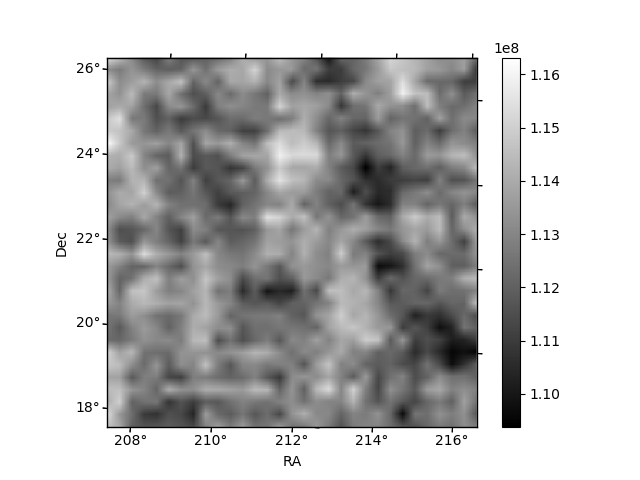
Quadrant B |
|---|---|---|---|
| Quadrant D | 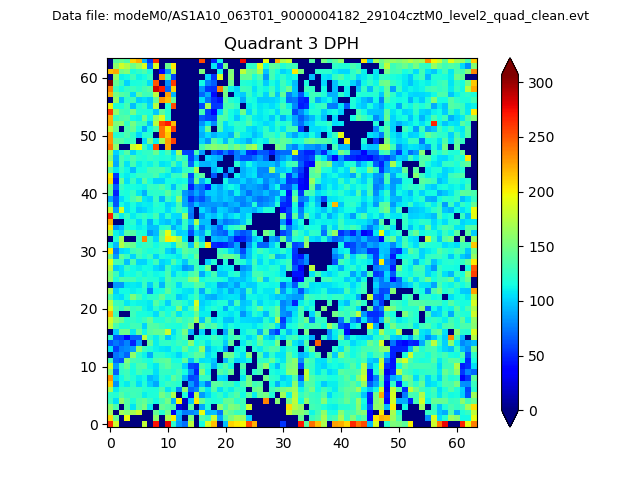 |
 |
Quadrant C |
| Plot type | Count rate plots | Images |
|---|---|---|
| Comparison with Poisson distribution Blue bars denote a histogram of data divided into 1 sec bins. Red curve is a Poisson curve with rate = median count rate of data. |
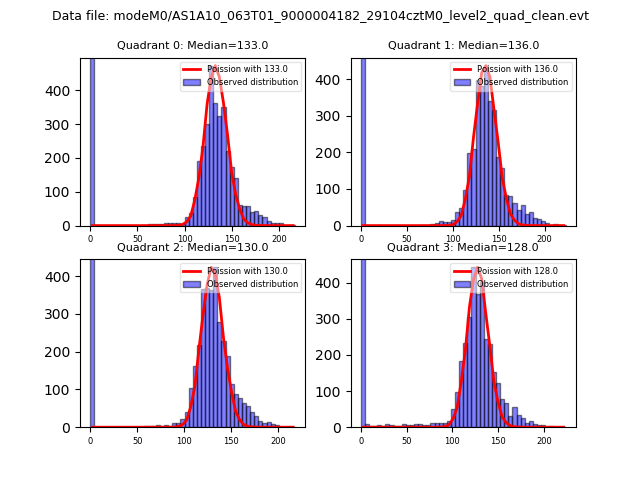 |
 |
| Quadrant-wise count rates Data is divided into 100 sec bins |
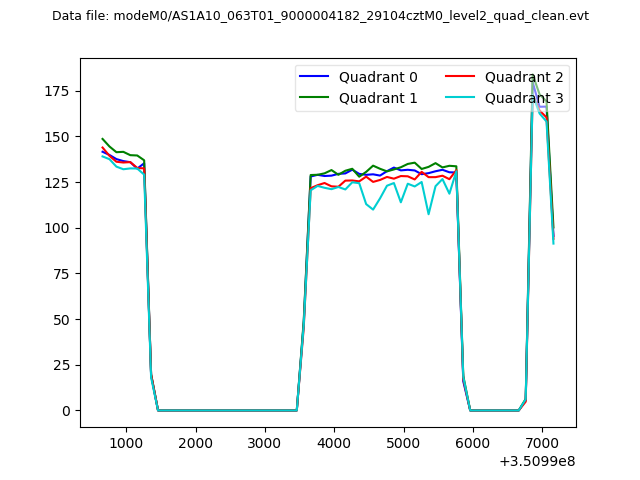 |
|
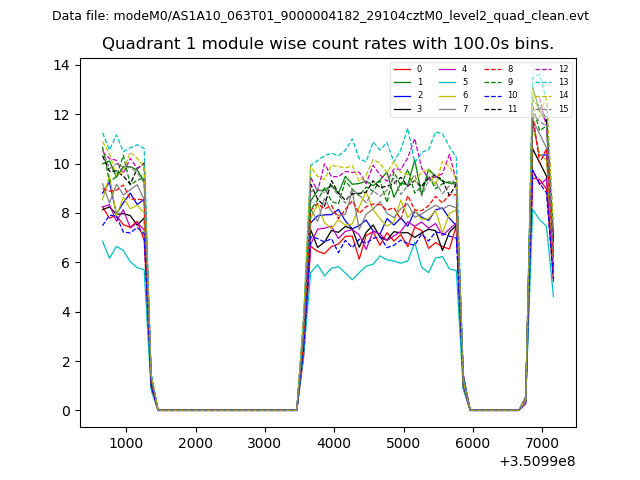
| Module-wise count rates for Quadrant A Data is divided into 100 sec bins |
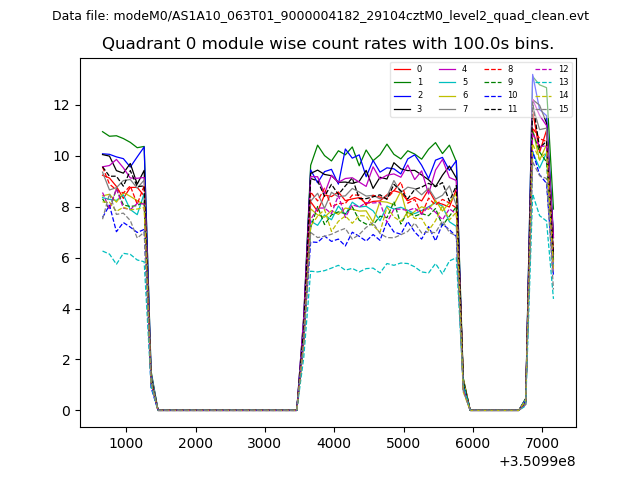 |
 |
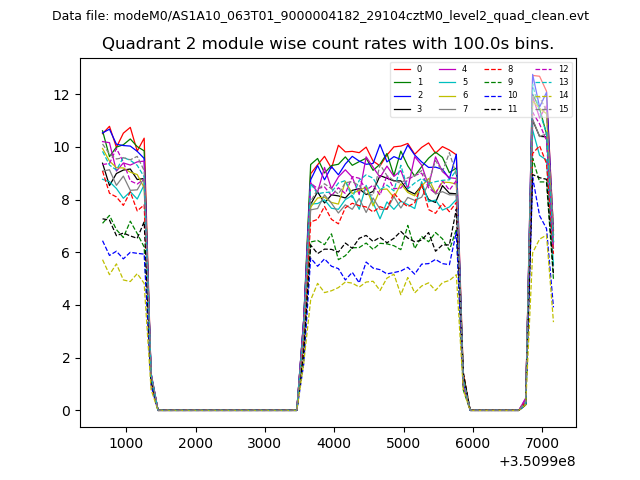
| Module-wise count rates for Quadrant B Data is divided into 100 sec bins |
 |
 |
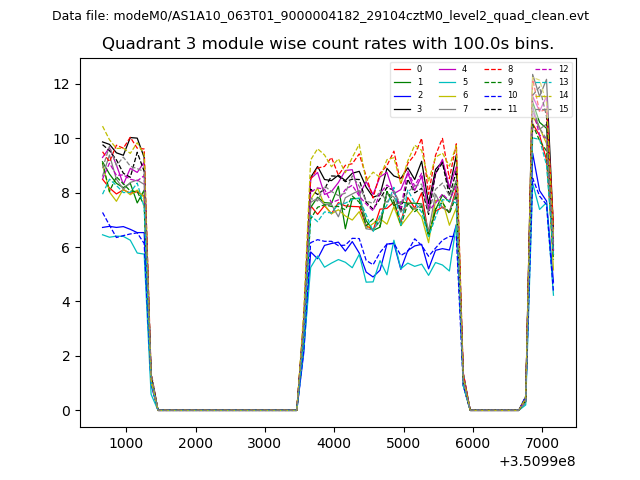
| Module-wise count rates for Quadrant C Data is divided into 100 sec bins |
 |
 |
| Module-wise count rates for Quadrant D Data is divided into 100 sec bins |
 |
 |
| Parameter | Plot |
|---|---|
| CZT HV Monitor | 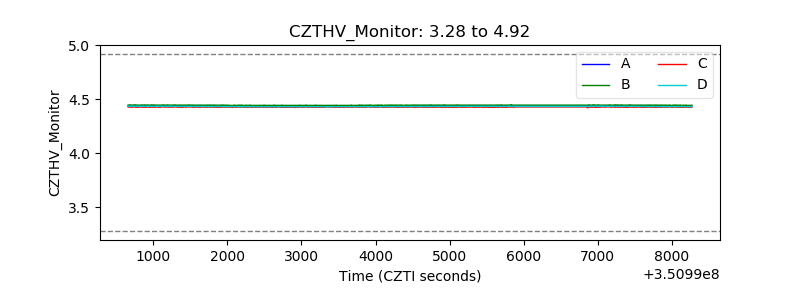 |
| D_VDD | 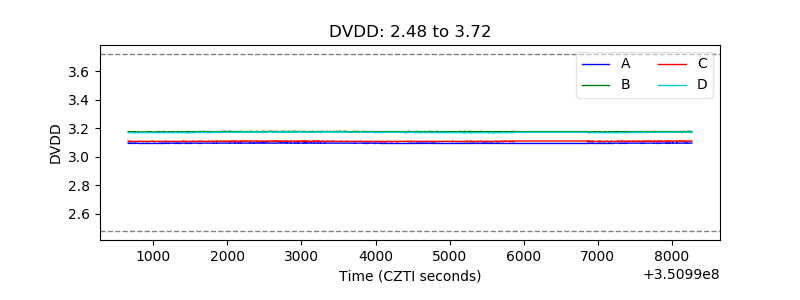 |
| Temperature 1 | 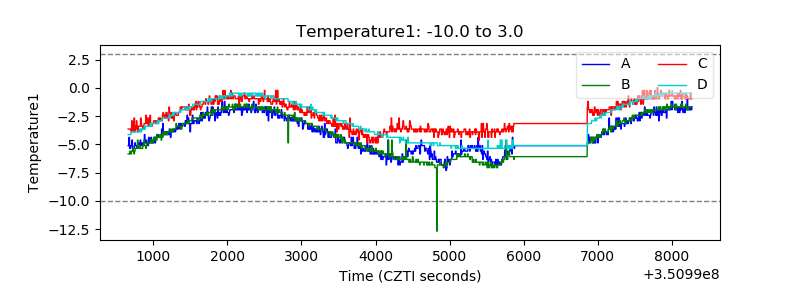 |
| Veto HV Monitor | 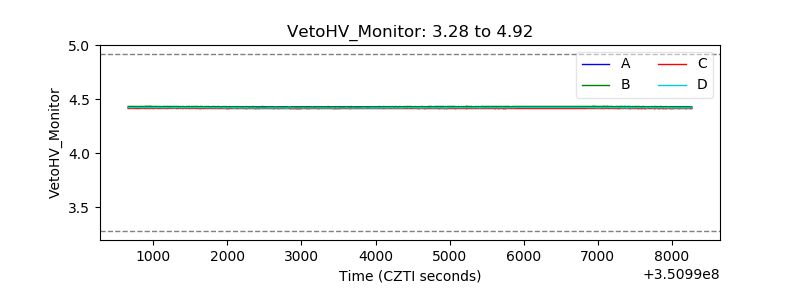 |
| Veto LLD | 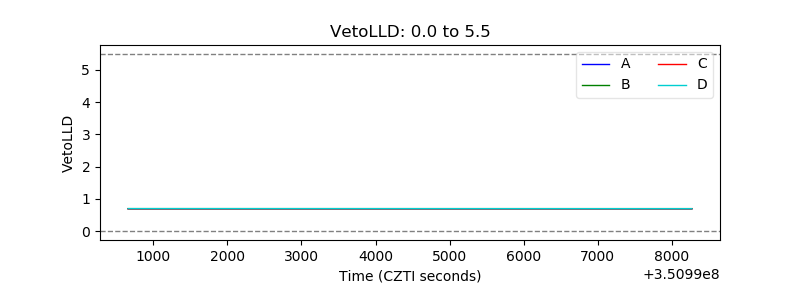 |
| Alpha Counter | 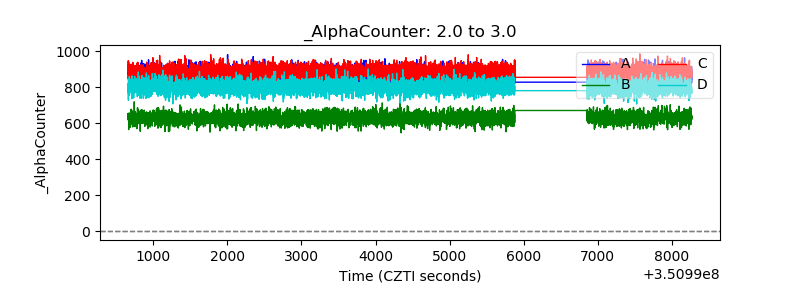 |
| _CPM_Rate | 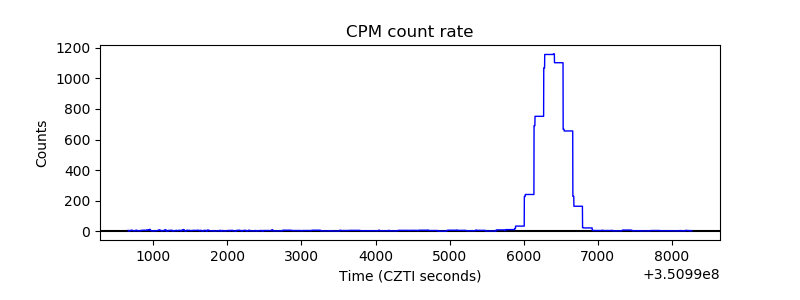 |
| CZT Counter | 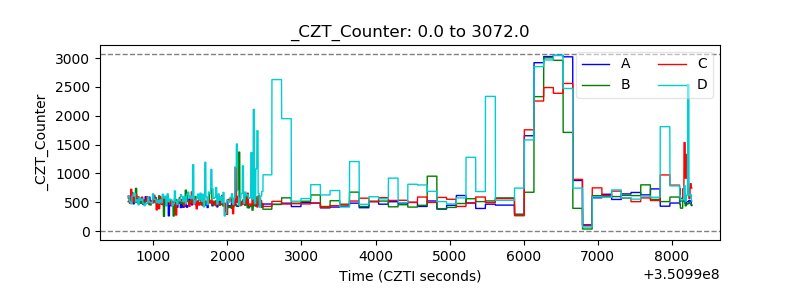 |
| +2.5 Volts monitor |  |
| +5 Volts monitor |  |
| _ROLL_ROT | 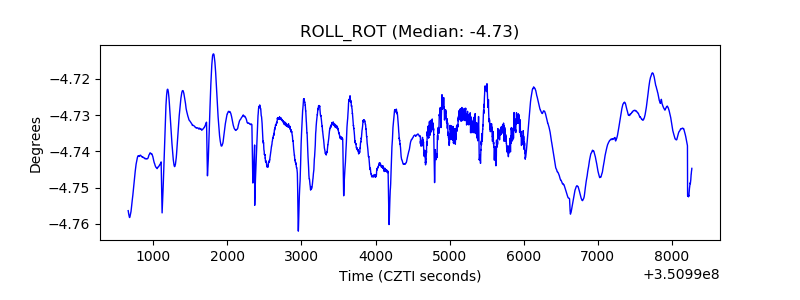 |
| _Roll_DEC | 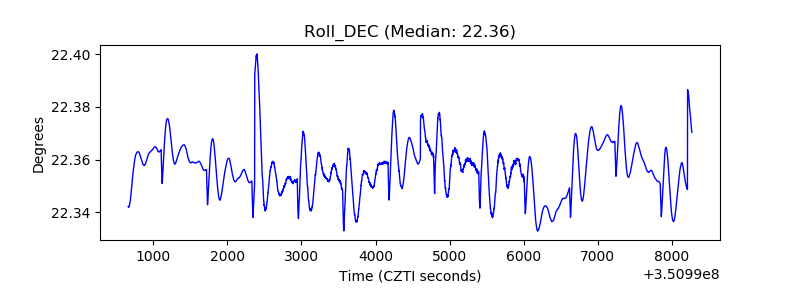 |
| _Roll_RA | 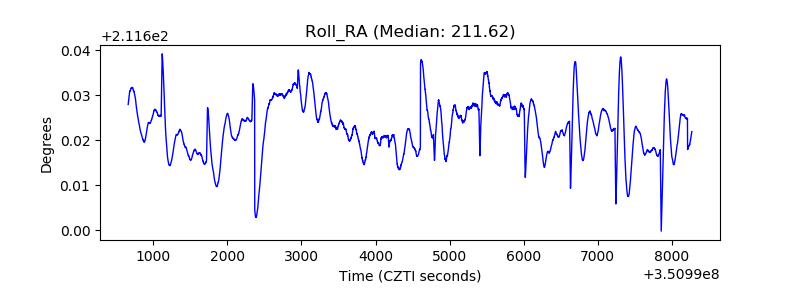 |
| Veto Counter | 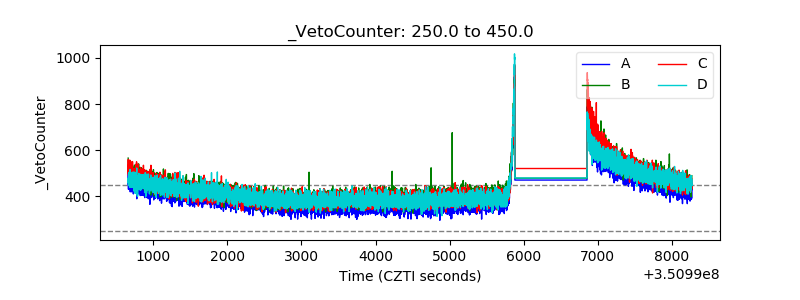 |