| Param | Original file | Final file |
|---|---|---|
| Filename | modeM0/AS1A10_063T01_9000004182_29107cztM0_level2.evt | modeM0/AS1A10_063T01_9000004182_29107cztM0_level2_quad_clean.evt |
| Size (bytes) | 579,303,360 | 66,893,760 |
| Size | 552.5 MB | 63.8 MB |
| Events in quadrant A | 3,502,772 | 400,980 |
| Events in quadrant B | 3,573,965 | 406,880 |
| Events in quadrant C | 4,759,666 | 385,937 |
| Events in quadrant D | 5,274,800 | 384,796 |
| Mode M0 | |||
|---|---|---|---|
| Quadrant | BADHDUFLAG | Total packets | Discarded packets |
| A | 0 | 14666 | 2 |
| B | 0 | 14784 | 2 |
| C | 0 | 18896 | 2 |
| D | 0 | 20214 | 2 |
| Mode M9 | |||
|---|---|---|---|
| Quadrant | BADHDUFLAG | Total packets | Discarded packets |
| A | 0 | 17 | 0 |
| B | 0 | 18 | 0 |
| C | 0 | 18 | 0 |
| D | 0 | 18 | 0 |
| Mode SS | |||
|---|---|---|---|
| Quadrant | BADHDUFLAG | Total packets | Discarded packets |
| A | 0 | 130 | 0 |
| B | 0 | 130 | 0 |
| C | 0 | 130 | 0 |
| D | 0 | 130 | 0 |
| Quadrant | Total seconds | Saturated seconds | Saturation percentage |
|---|---|---|---|
| A | 6402 | 69 | 1.077788% |
| B | 6402 | 83 | 1.296470% |
| C | 6401 | 170 | 2.655835% |
| D | 6401 | 378 | 5.905327% |
Noise dominated data is calculated using 1-second bins in cleaned event files. If a bin has >2000 counts, and if more than 50% of those come from <1% of pixels, then it is considered to be noise-dominated and hence unusable.
| Quadrant | # 1 sec bins | Bins with >0 counts | Bins with >2000 counts | High rate bins dominated by noise | Noise dominated (total time) | Noise dominated (detector-on time) | Marked lightcurve |
|---|---|---|---|---|---|---|---|
| A | 7642 | 6403 | 0 | 0 | 0.00% | 0.00% | 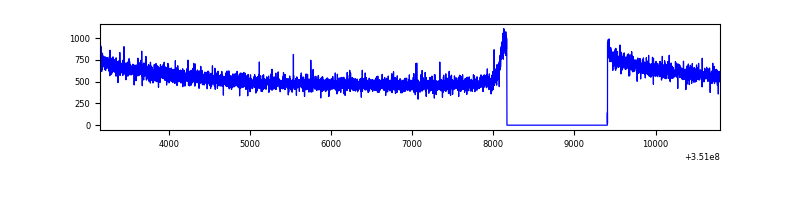 |
| B | 7642 | 6403 | 2 | 2 | 0.03% | 0.03% | 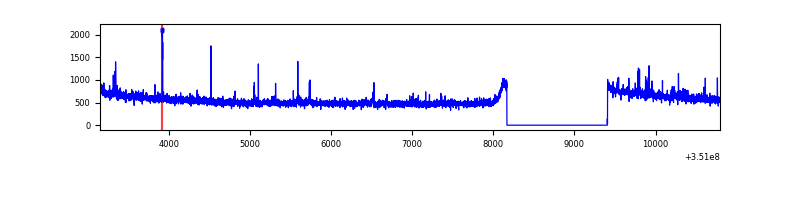 |
| C | 7641 | 6402 | 0 | 0 | 0.00% | 0.00% | 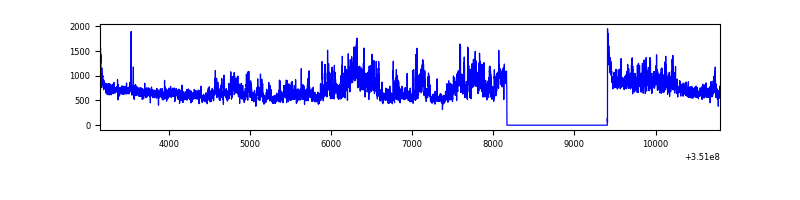 |
| D | 7641 | 6402 | 278 | 278 | 3.64% | 4.34% | 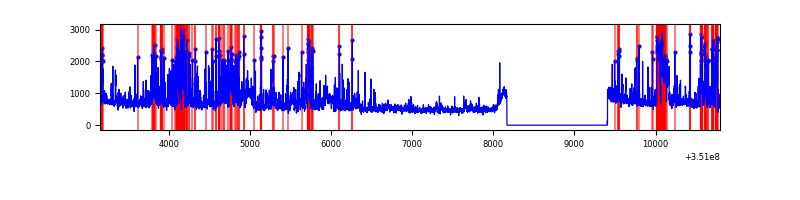 |
Top three noisy pixels from each quadrant. If the there are fewer than three noisy pixels in the level2.evt file, extra rows are filled as -1
| Pixel properties | Quadrant properties | ||||||
|---|---|---|---|---|---|---|---|
| Quadrant | DetID | PixID | Counts | Sigma | Mean | Median | Sigma |
| A | 13 | 254 | 11246 | 57.96 | 905 | 889 | 178.7 |
| A | 13 | 6 | 8482 | 42.49 | 905 | 889 | 178.7 |
| A | 3 | 137 | 8149 | 40.63 | 905 | 889 | 178.7 |
| B | 10 | 245 | 26593 | 155.13 | 892 | 872 | 165.8 |
| B | 0 | 190 | 25893 | 150.91 | 892 | 872 | 165.8 |
| B | 12 | 111 | 19703 | 113.58 | 892 | 872 | 165.8 |
| C | 3 | 233 | 1210913 | 6106.37 | 869 | 877 | 198.2 |
| C | 14 | 238 | 140617 | 705.19 | 869 | 877 | 198.2 |
| C | 2 | 114 | 15857 | 75.6 | 869 | 877 | 198.2 |
| D | 1 | 52 | 1385046 | 6852.56 | 867 | 848 | 202.0 |
| D | 8 | 195 | 485399 | 2398.8 | 867 | 848 | 202.0 |
| D | 13 | 104 | 31922 | 153.83 | 867 | 848 | 202.0 |
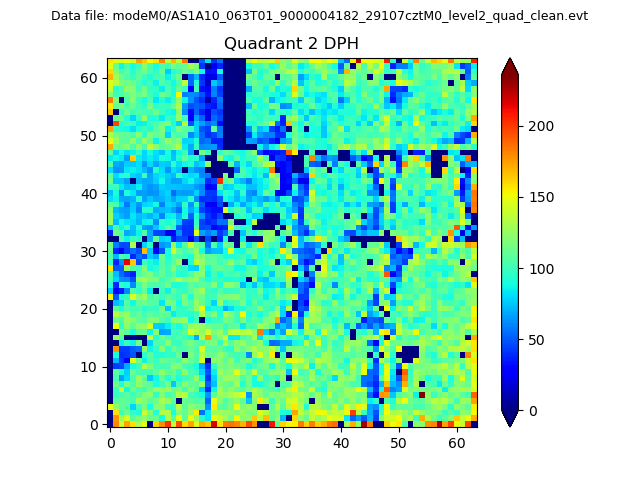
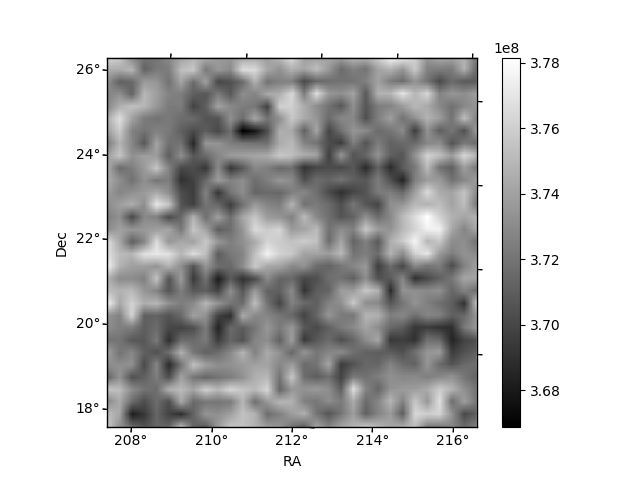
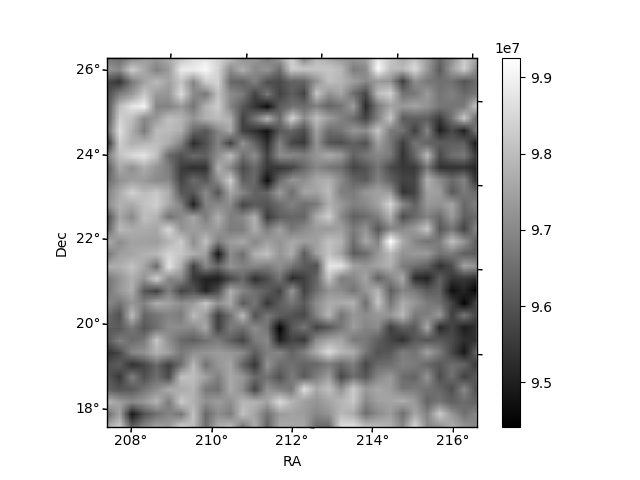
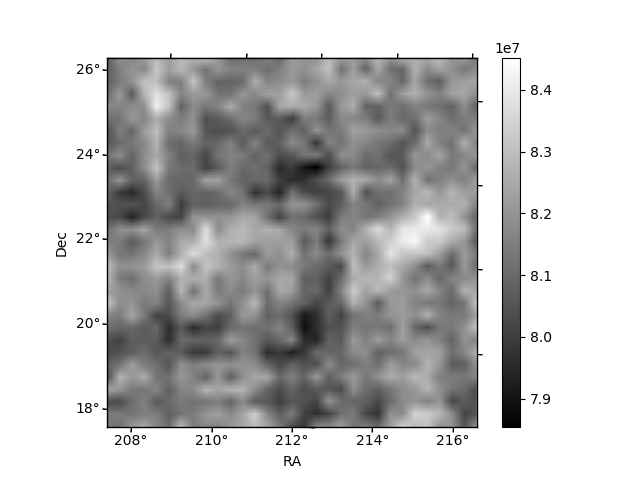
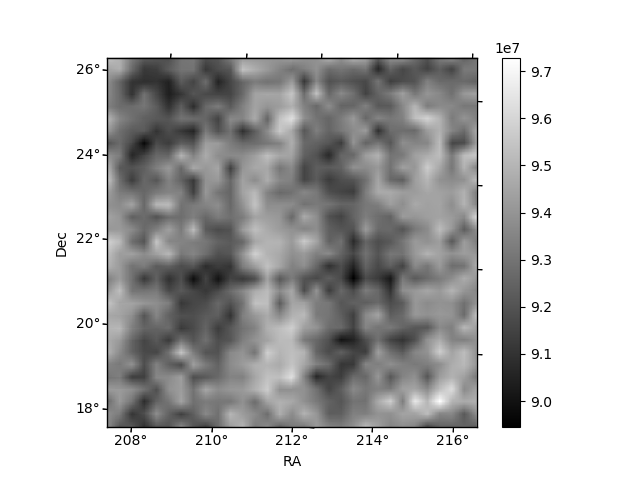
Histogram calculated using DETX and DETY for each event in the final _common_clean file
| Quadrant A | 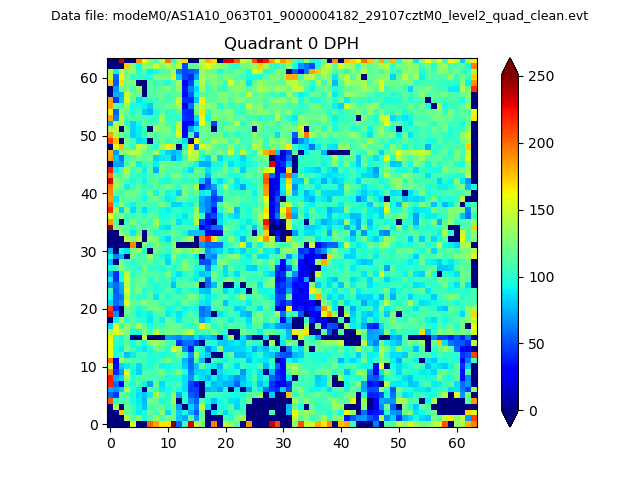 |
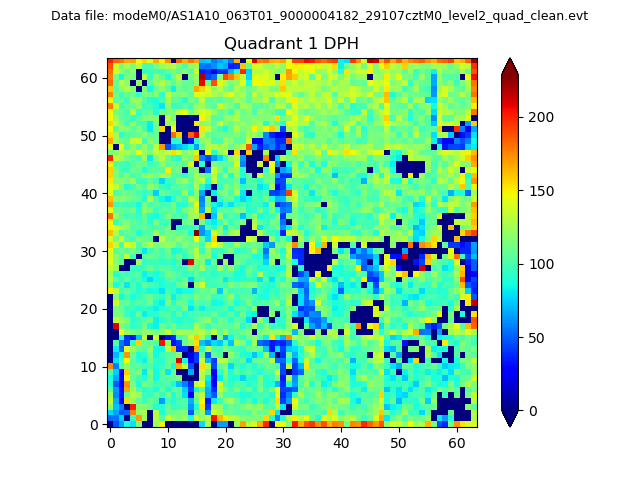 |
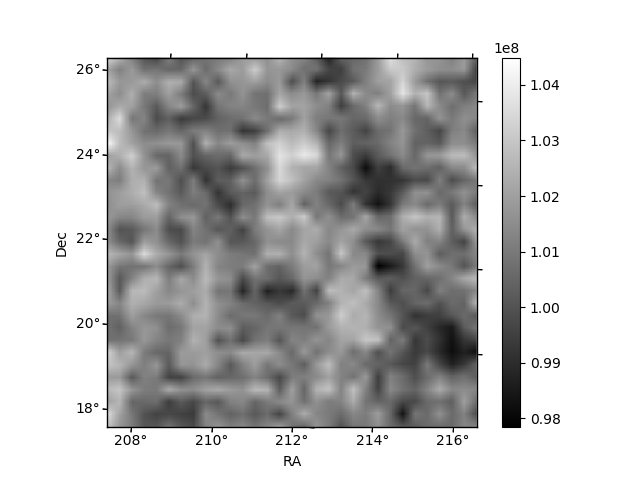
Quadrant B |
|---|---|---|---|
| Quadrant D | 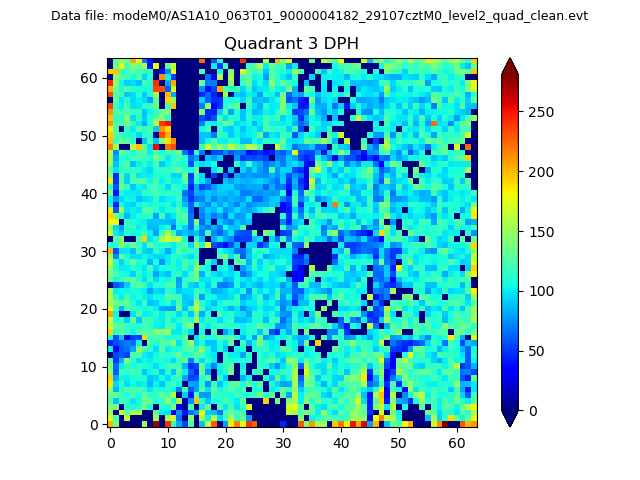 |
 |
Quadrant C |
| Plot type | Count rate plots | Images |
|---|---|---|
| Comparison with Poisson distribution Blue bars denote a histogram of data divided into 1 sec bins. Red curve is a Poisson curve with rate = median count rate of data. |
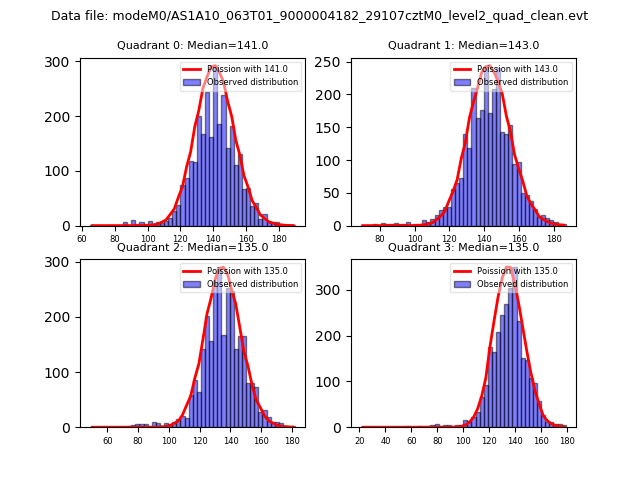 |
 |
| Quadrant-wise count rates Data is divided into 100 sec bins |
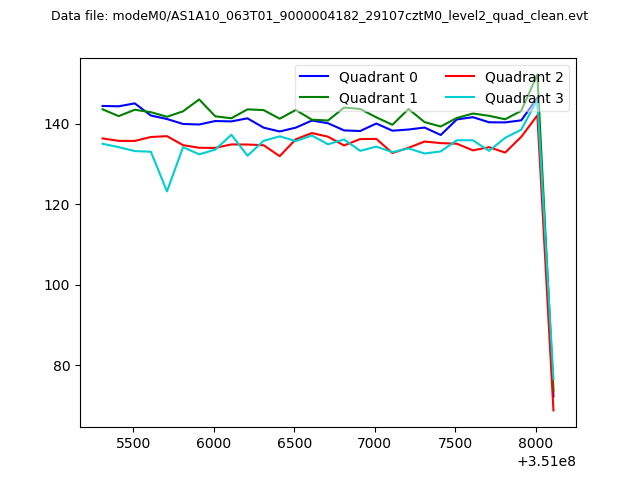 |
|
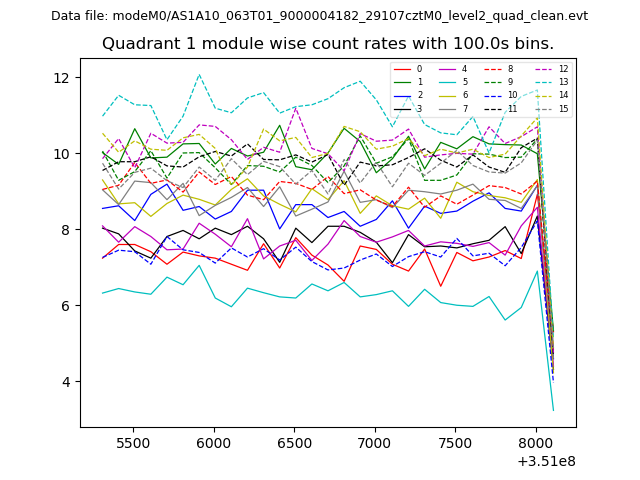
| Module-wise count rates for Quadrant A Data is divided into 100 sec bins |
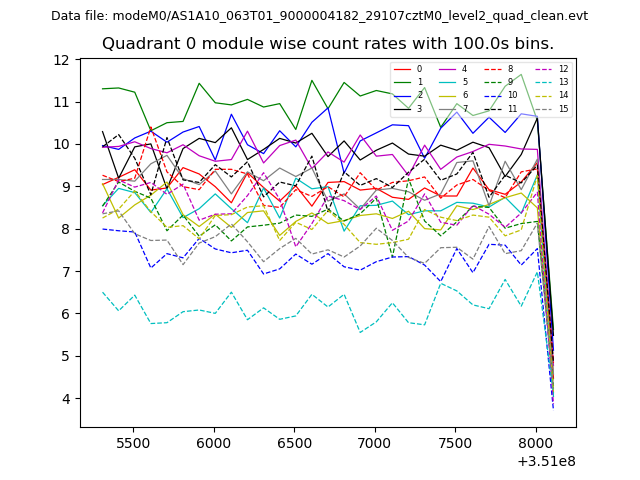 |
 |
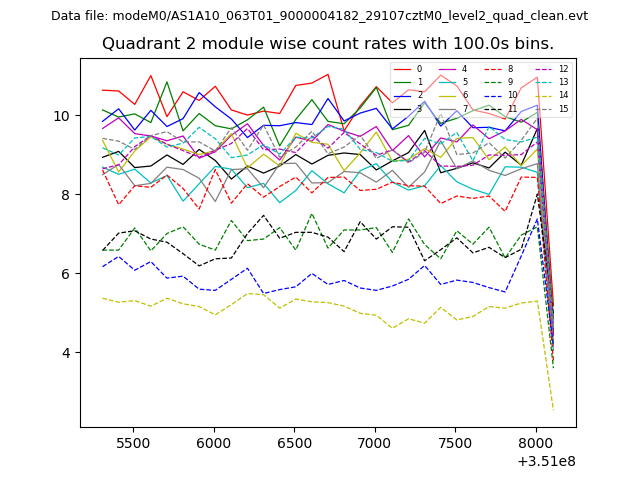
| Module-wise count rates for Quadrant B Data is divided into 100 sec bins |
 |
 |
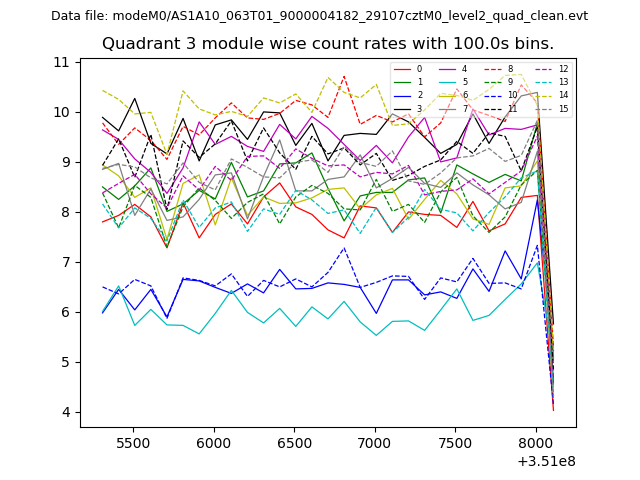
| Module-wise count rates for Quadrant C Data is divided into 100 sec bins |
 |
 |
| Module-wise count rates for Quadrant D Data is divided into 100 sec bins |
 |
 |
| Parameter | Plot |
|---|---|
| CZT HV Monitor | 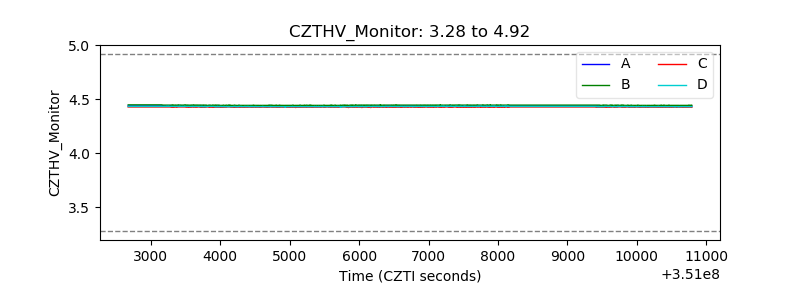 |
| D_VDD | 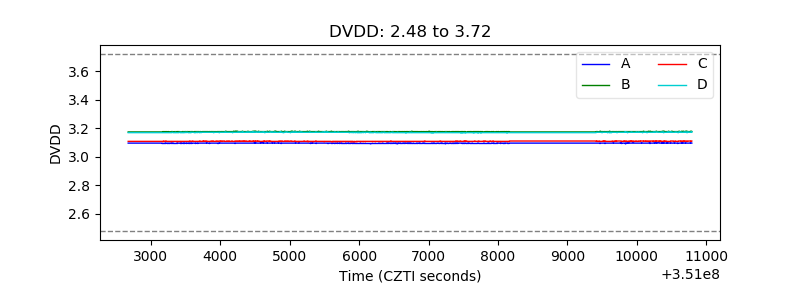 |
| Temperature 1 | 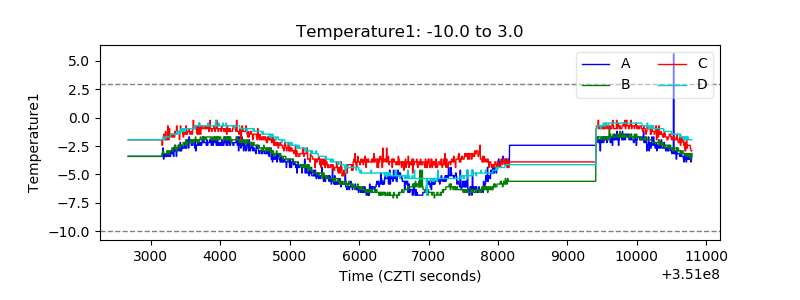 |
| Veto HV Monitor | 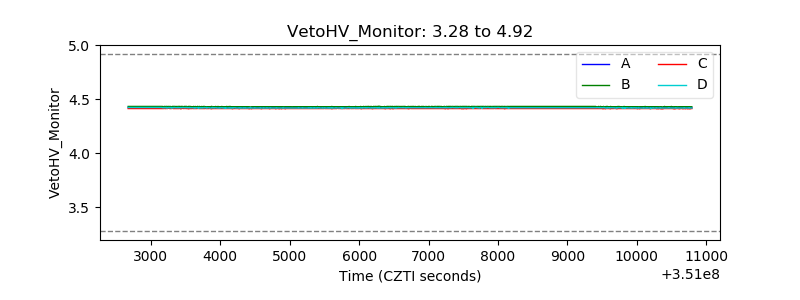 |
| Veto LLD | 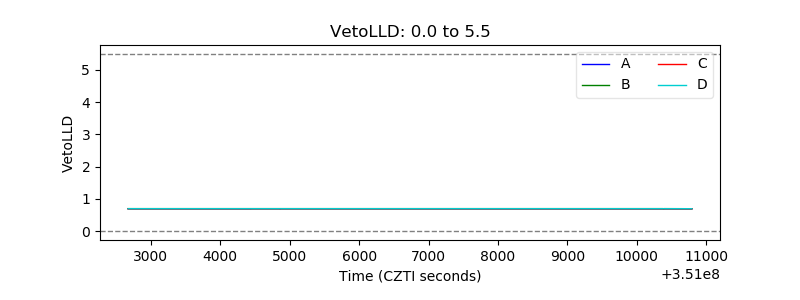 |
| Alpha Counter | 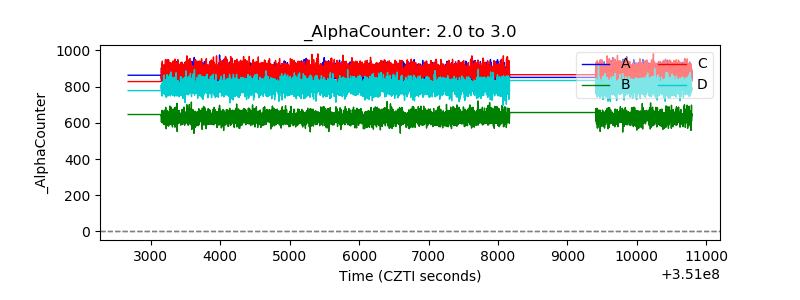 |
| _CPM_Rate | 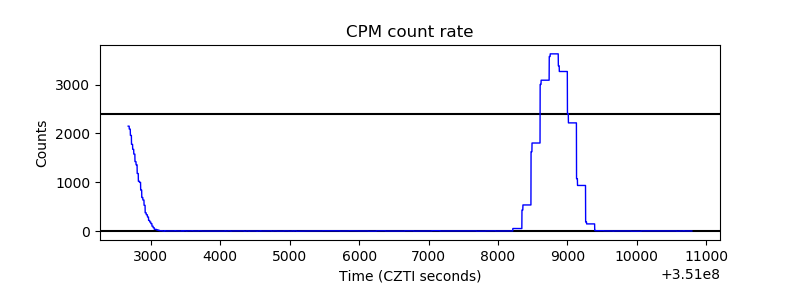 |
| CZT Counter | 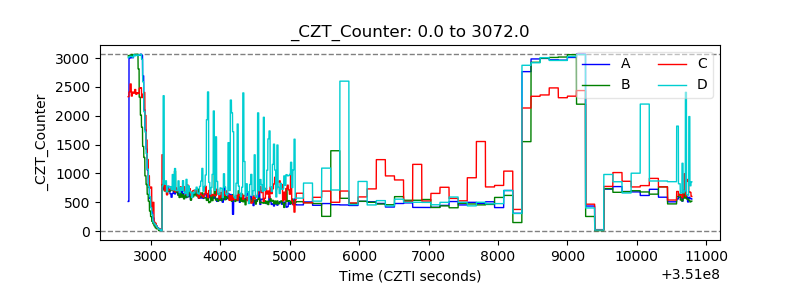 |
| +2.5 Volts monitor |  |
| +5 Volts monitor |  |
| _ROLL_ROT | 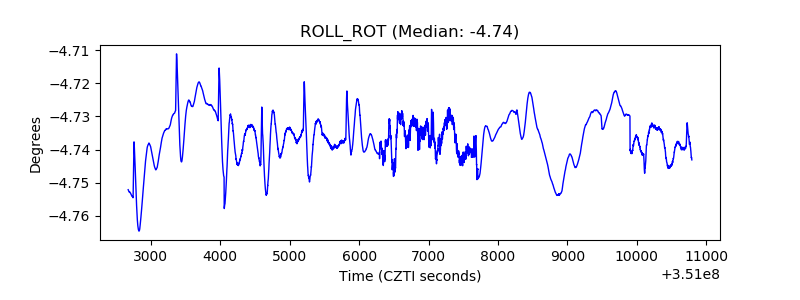 |
| _Roll_DEC | 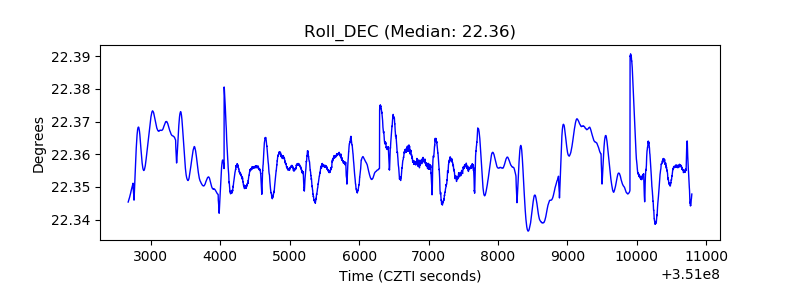 |
| _Roll_RA | 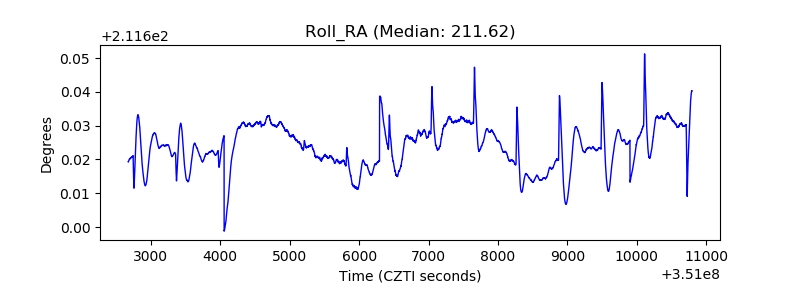 |
| Veto Counter | 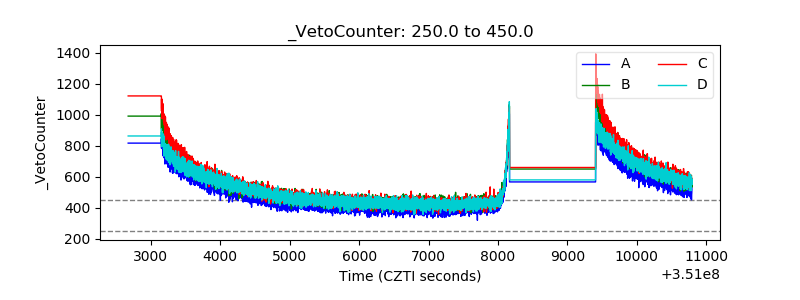 |