| Param | Original file | Final file |
|---|---|---|
| Filename | modeM0/AS1A10_063T01_9000004182_29108cztM0_level2.evt | modeM0/AS1A10_063T01_9000004182_29108cztM0_level2_quad_clean.evt |
| Size (bytes) | 590,526,720 | 75,732,480 |
| Size | 563.2 MB | 72.2 MB |
| Events in quadrant A | 3,546,043 | 471,636 |
| Events in quadrant B | 3,689,754 | 477,489 |
| Events in quadrant C | 4,573,093 | 461,493 |
| Events in quadrant D | 5,652,037 | 445,662 |
| Mode M0 | |||
|---|---|---|---|
| Quadrant | BADHDUFLAG | Total packets | Discarded packets |
| A | 0 | 14714 | 2 |
| B | 0 | 15111 | 2 |
| C | 0 | 17996 | 2 |
| D | 0 | 21139 | 2 |
| Mode M9 | |||
|---|---|---|---|
| Quadrant | BADHDUFLAG | Total packets | Discarded packets |
| A | 0 | 19 | 0 |
| B | 0 | 20 | 0 |
| C | 0 | 20 | 0 |
| D | 0 | 20 | 0 |
| Mode SS | |||
|---|---|---|---|
| Quadrant | BADHDUFLAG | Total packets | Discarded packets |
| A | 0 | 128 | 0 |
| B | 0 | 128 | 0 |
| C | 0 | 128 | 0 |
| D | 0 | 128 | 0 |
| Quadrant | Total seconds | Saturated seconds | Saturation percentage |
|---|---|---|---|
| A | 6255 | 66 | 1.055156% |
| B | 6255 | 100 | 1.598721% |
| C | 6255 | 194 | 3.101519% |
| D | 6254 | 558 | 8.922290% |
Noise dominated data is calculated using 1-second bins in cleaned event files. If a bin has >2000 counts, and if more than 50% of those come from <1% of pixels, then it is considered to be noise-dominated and hence unusable.
| Quadrant | # 1 sec bins | Bins with >0 counts | Bins with >2000 counts | High rate bins dominated by noise | Noise dominated (total time) | Noise dominated (detector-on time) | Marked lightcurve |
|---|---|---|---|---|---|---|---|
| A | 7585 | 6256 | 0 | 0 | 0.00% | 0.00% |  |
| B | 7585 | 6256 | 10 | 10 | 0.13% | 0.16% |  |
| C | 7585 | 6256 | 1 | 1 | 0.01% | 0.02% |  |
| D | 7584 | 6255 | 457 | 457 | 6.03% | 7.31% | 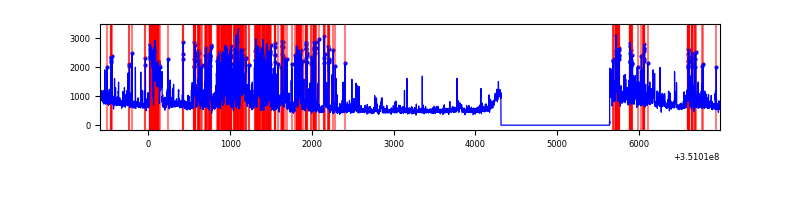 |
Top three noisy pixels from each quadrant. If the there are fewer than three noisy pixels in the level2.evt file, extra rows are filled as -1
| Pixel properties | Quadrant properties | ||||||
|---|---|---|---|---|---|---|---|
| Quadrant | DetID | PixID | Counts | Sigma | Mean | Median | Sigma |
| A | 13 | 254 | 11501 | 58.71 | 917 | 901 | 180.6 |
| A | 3 | 137 | 7862 | 38.55 | 917 | 901 | 180.6 |
| A | 0 | 226 | 7804 | 38.23 | 917 | 901 | 180.6 |
| B | 10 | 245 | 112598 | 666.36 | 908 | 891 | 167.6 |
| B | 12 | 111 | 19344 | 110.08 | 908 | 891 | 167.6 |
| B | 11 | 111 | 17551 | 99.38 | 908 | 891 | 167.6 |
| C | 3 | 233 | 931797 | 4570.15 | 891 | 901 | 203.7 |
| C | 14 | 238 | 147264 | 718.56 | 891 | 901 | 203.7 |
| C | 2 | 114 | 15953 | 73.9 | 891 | 901 | 203.7 |
| D | 1 | 52 | 1824576 | 8934.33 | 876 | 856 | 204.1 |
| D | 8 | 195 | 394276 | 1927.35 | 876 | 856 | 204.1 |
| D | 10 | 199 | 29899 | 142.28 | 876 | 856 | 204.1 |
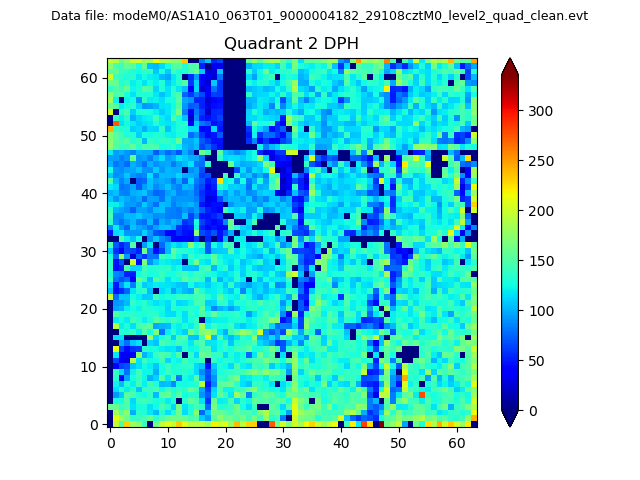
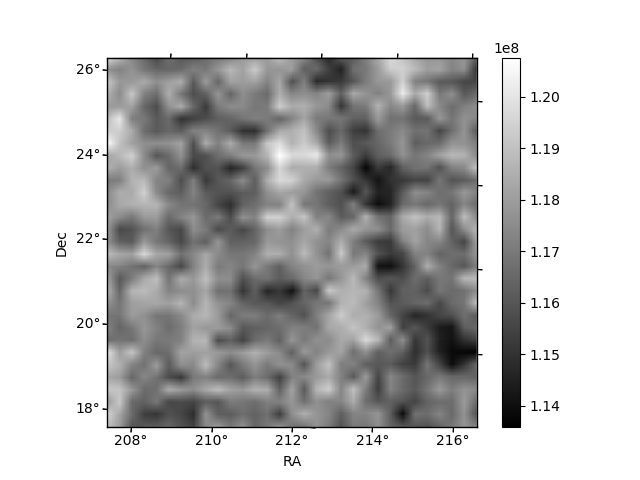
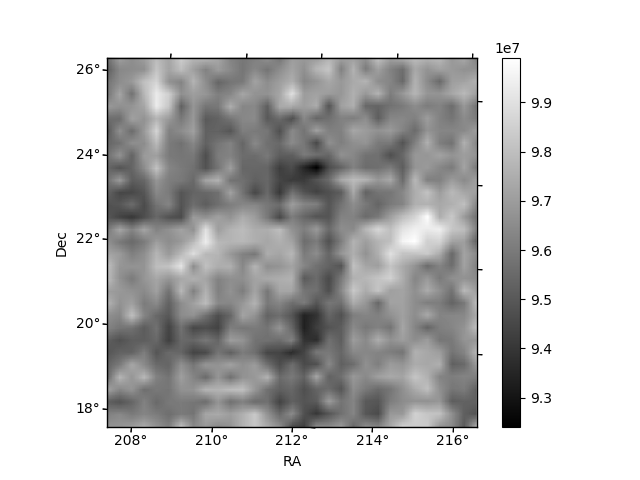
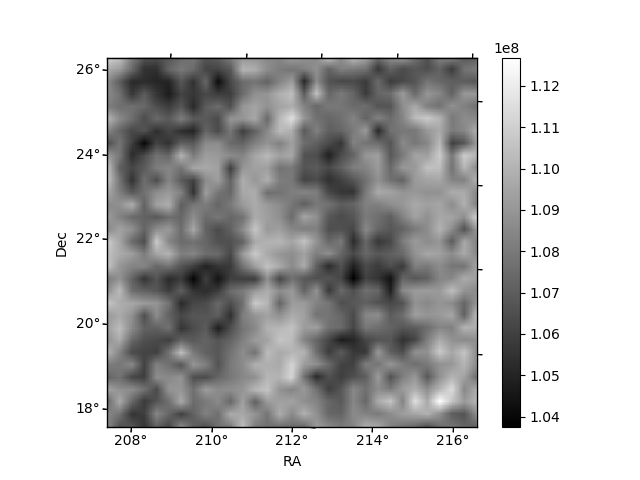
Histogram calculated using DETX and DETY for each event in the final _common_clean file
| Quadrant A | 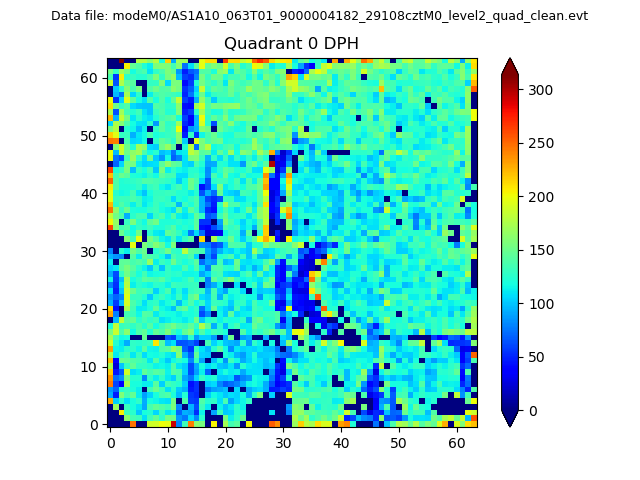 |
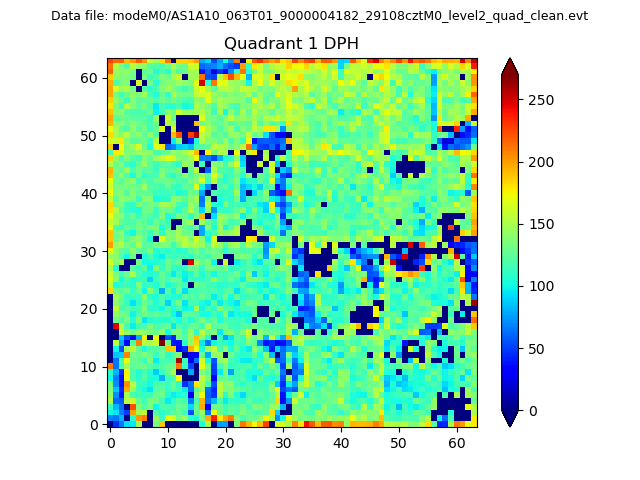 |
Quadrant B |
|---|---|---|---|
| Quadrant D | 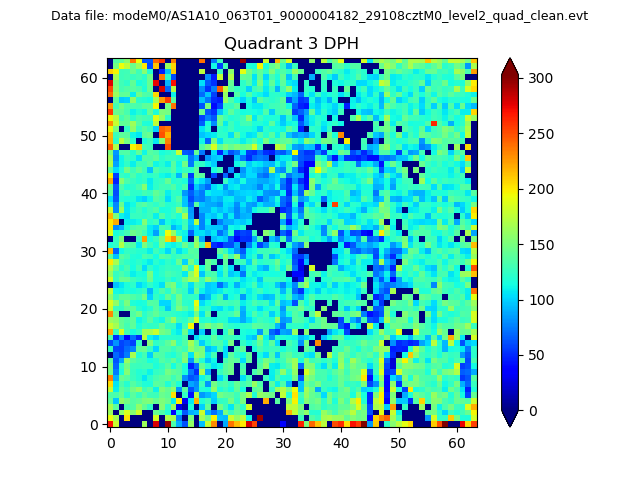 |
 |
Quadrant C |
| Plot type | Count rate plots | Images |
|---|---|---|
| Comparison with Poisson distribution Blue bars denote a histogram of data divided into 1 sec bins. Red curve is a Poisson curve with rate = median count rate of data. |
 |
 |
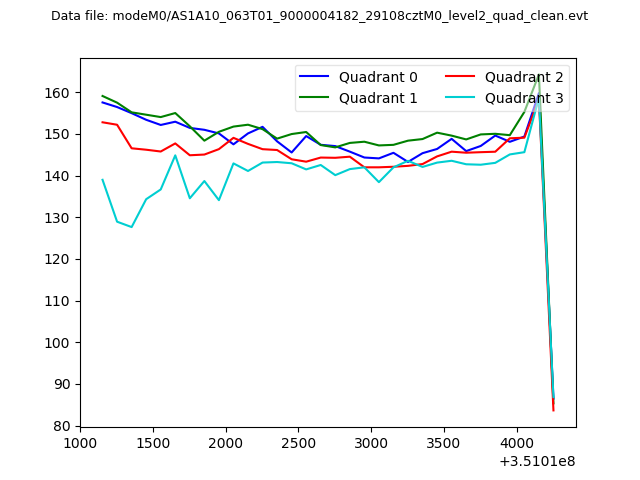
| Quadrant-wise count rates Data is divided into 100 sec bins |
 |
|
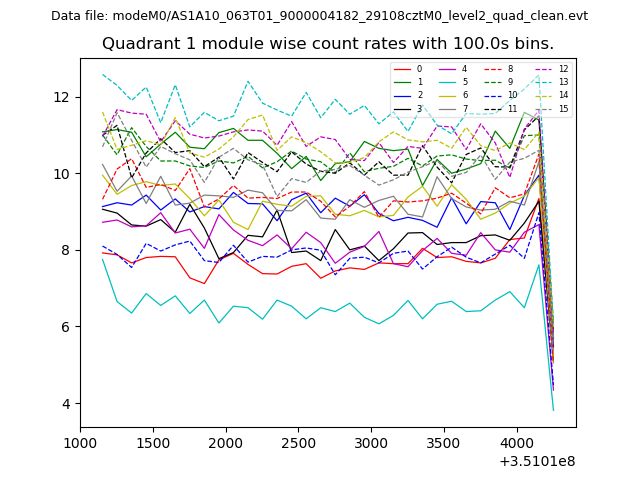
| Module-wise count rates for Quadrant A Data is divided into 100 sec bins |
 |
 |
| Module-wise count rates for Quadrant B Data is divided into 100 sec bins |
 |
 |
| Module-wise count rates for Quadrant C Data is divided into 100 sec bins |
 |
 |
| Module-wise count rates for Quadrant D Data is divided into 100 sec bins |
 |
 |
| Parameter | Plot |
|---|---|
| CZT HV Monitor |  |
| D_VDD | 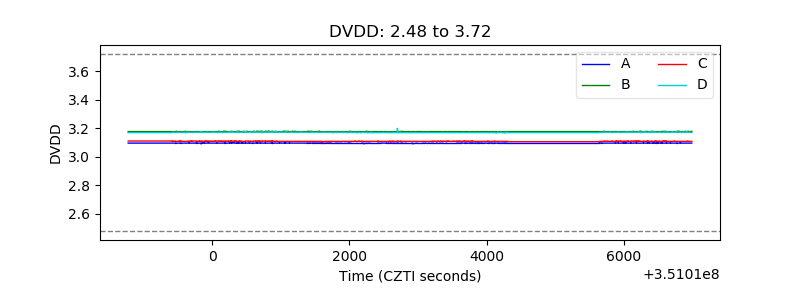 |
| Temperature 1 | 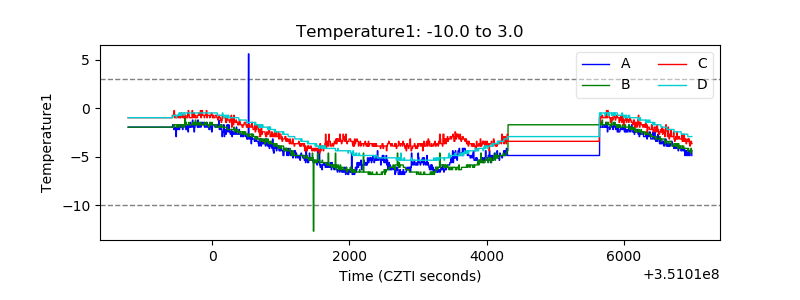 |
| Veto HV Monitor | 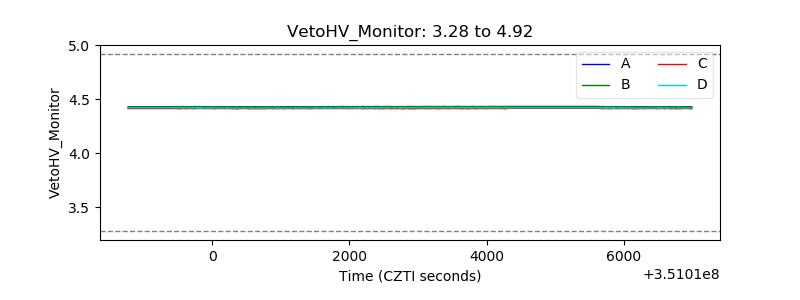 |
| Veto LLD | 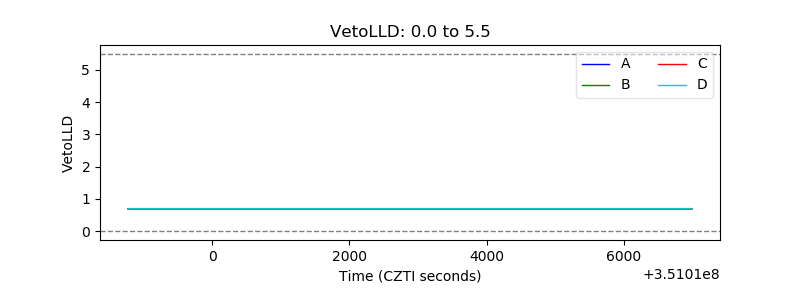 |
| Alpha Counter | 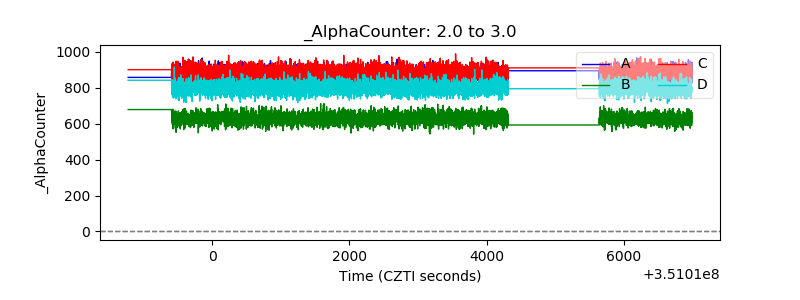 |
| _CPM_Rate | 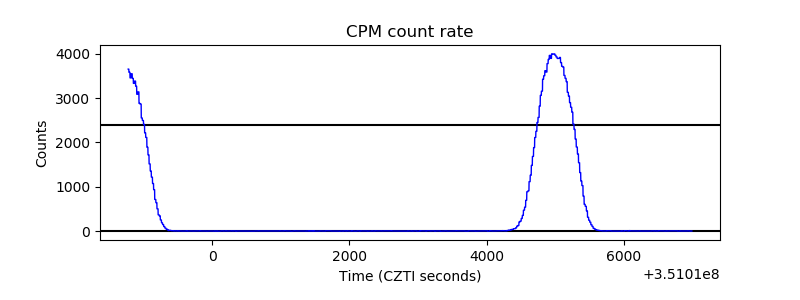 |
| CZT Counter | 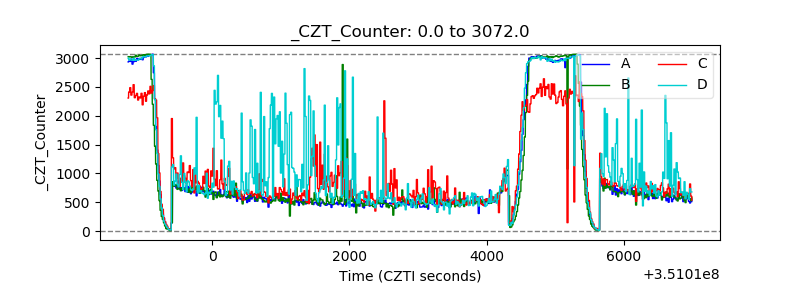 |
| +2.5 Volts monitor |  |
| +5 Volts monitor |  |
| _ROLL_ROT |  |
| _Roll_DEC | 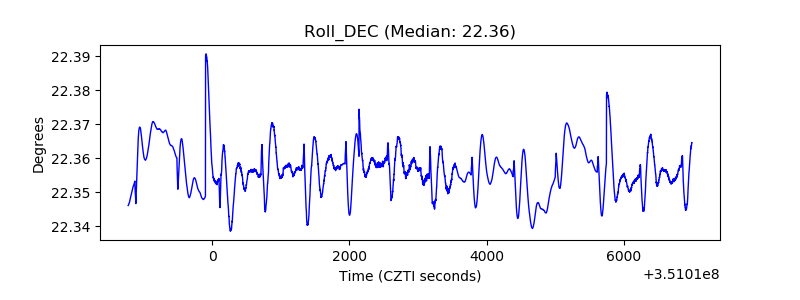 |
| _Roll_RA | 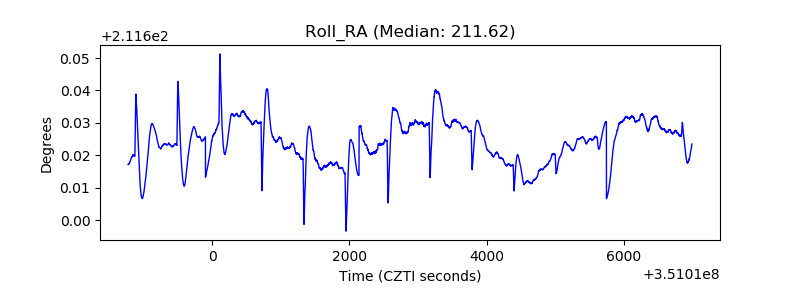 |
| Veto Counter | 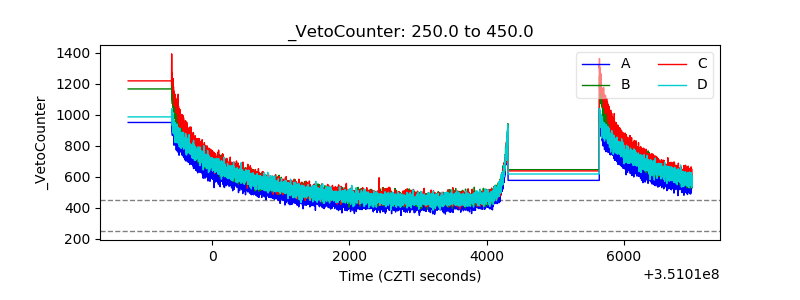 |