| Param | Original file | Final file |
|---|---|---|
| Filename | modeM0/AS1A10_063T01_9000004182_29110cztM0_level2.evt | modeM0/AS1A10_063T01_9000004182_29110cztM0_level2_quad_clean.evt |
| Size (bytes) | 564,949,440 | 100,080,000 |
| Size | 538.8 MB | 95.4 MB |
| Events in quadrant A | 3,329,442 | 658,392 |
| Events in quadrant B | 3,966,648 | 670,853 |
| Events in quadrant C | 4,211,227 | 654,338 |
| Events in quadrant D | 5,181,116 | 613,174 |
| Mode M0 | |||
|---|---|---|---|
| Quadrant | BADHDUFLAG | Total packets | Discarded packets |
| A | 0 | 13837 | 2 |
| B | 0 | 15919 | 2 |
| C | 0 | 17010 | 2 |
| D | 0 | 19632 | 2 |
| Mode M9 | |||
|---|---|---|---|
| Quadrant | BADHDUFLAG | Total packets | Discarded packets |
| A | 0 | 13 | 0 |
| B | 0 | 13 | 0 |
| C | 0 | 13 | 0 |
| D | 0 | 13 | 0 |
| Mode SS | |||
|---|---|---|---|
| Quadrant | BADHDUFLAG | Total packets | Discarded packets |
| A | 0 | 126 | 0 |
| B | 0 | 126 | 0 |
| C | 0 | 126 | 0 |
| D | 0 | 126 | 0 |
| Quadrant | Total seconds | Saturated seconds | Saturation percentage |
|---|---|---|---|
| A | 6221 | 76 | 1.221669% |
| B | 6222 | 188 | 3.021536% |
| C | 6222 | 196 | 3.150113% |
| D | 6222 | 555 | 8.919961% |
Noise dominated data is calculated using 1-second bins in cleaned event files. If a bin has >2000 counts, and if more than 50% of those come from <1% of pixels, then it is considered to be noise-dominated and hence unusable.
| Quadrant | # 1 sec bins | Bins with >0 counts | Bins with >2000 counts | High rate bins dominated by noise | Noise dominated (total time) | Noise dominated (detector-on time) | Marked lightcurve |
|---|---|---|---|---|---|---|---|
| A | 7551 | 6222 | 0 | 0 | 0.00% | 0.00% | 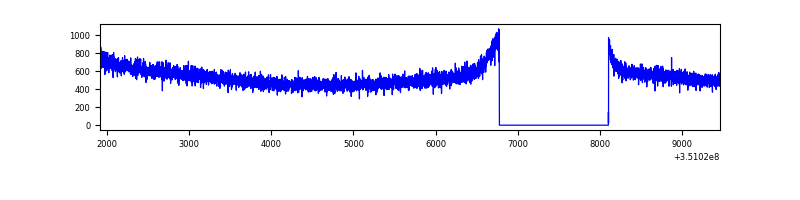 |
| B | 7552 | 6223 | 62 | 62 | 0.82% | 1.00% |  |
| C | 7552 | 6223 | 1 | 1 | 0.01% | 0.02% | 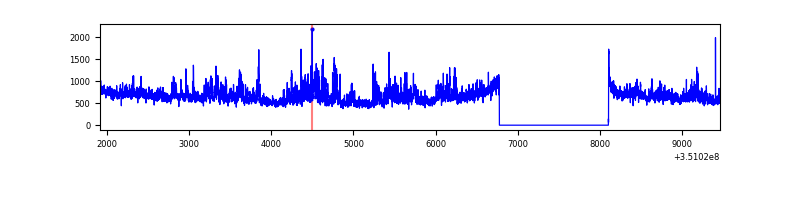 |
| D | 7552 | 6223 | 357 | 357 | 4.73% | 5.74% | 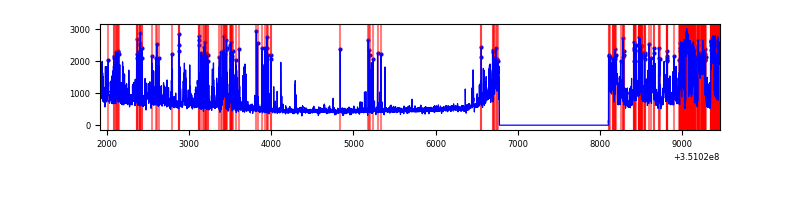 |
Top three noisy pixels from each quadrant. If the there are fewer than three noisy pixels in the level2.evt file, extra rows are filled as -1
| Pixel properties | Quadrant properties | ||||||
|---|---|---|---|---|---|---|---|
| Quadrant | DetID | PixID | Counts | Sigma | Mean | Median | Sigma |
| A | 13 | 254 | 10894 | 58.37 | 861 | 847 | 172.1 |
| A | 3 | 137 | 7940 | 41.21 | 861 | 847 | 172.1 |
| A | 0 | 226 | 7347 | 37.76 | 861 | 847 | 172.1 |
| B | 10 | 245 | 533763 | 3315.38 | 859 | 842 | 160.7 |
| B | 0 | 190 | 25521 | 153.53 | 859 | 842 | 160.7 |
| B | 5 | 255 | 22820 | 136.73 | 859 | 842 | 160.7 |
| C | 3 | 233 | 754912 | 3888.94 | 846 | 854 | 193.9 |
| C | 14 | 238 | 138298 | 708.85 | 846 | 854 | 193.9 |
| C | 2 | 114 | 15300 | 74.5 | 846 | 854 | 193.9 |
| D | 1 | 52 | 1579911 | 8197.31 | 816 | 798 | 192.6 |
| D | 8 | 195 | 356140 | 1844.61 | 816 | 798 | 192.6 |
| D | 12 | 233 | 114636 | 590.94 | 816 | 798 | 192.6 |
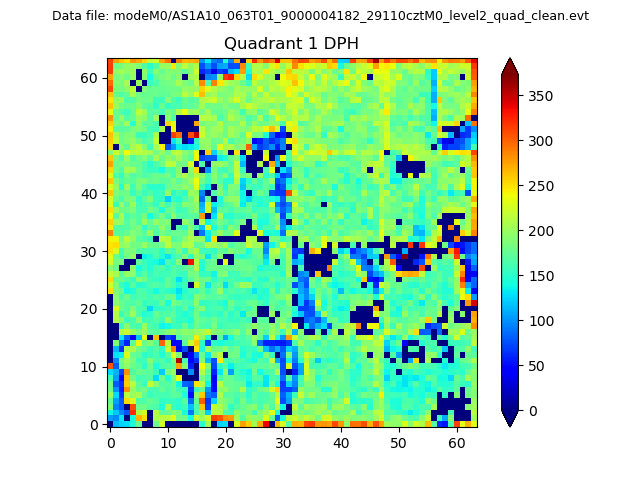
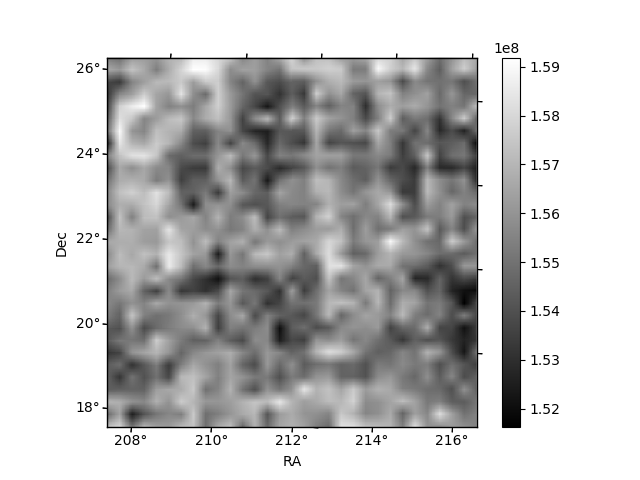
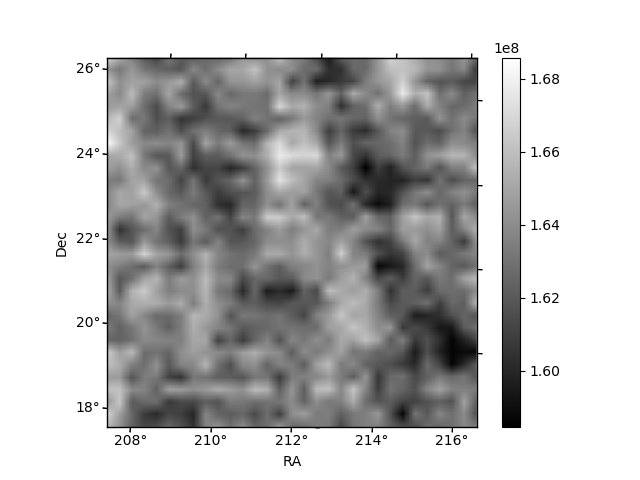
Histogram calculated using DETX and DETY for each event in the final _common_clean file
| Quadrant A | 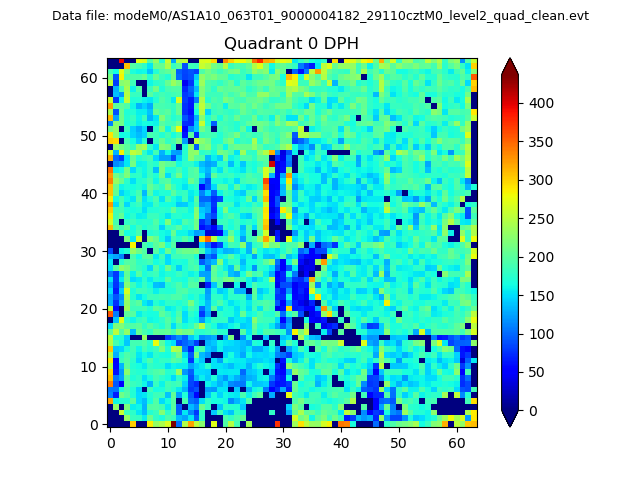 |
 |
Quadrant B |
|---|---|---|---|
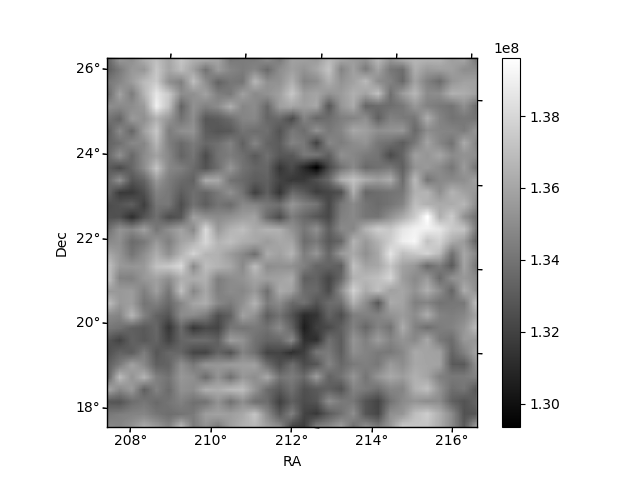
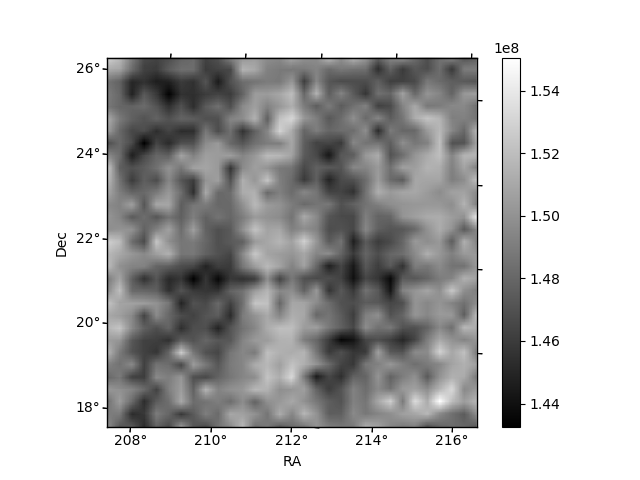
| Quadrant D | 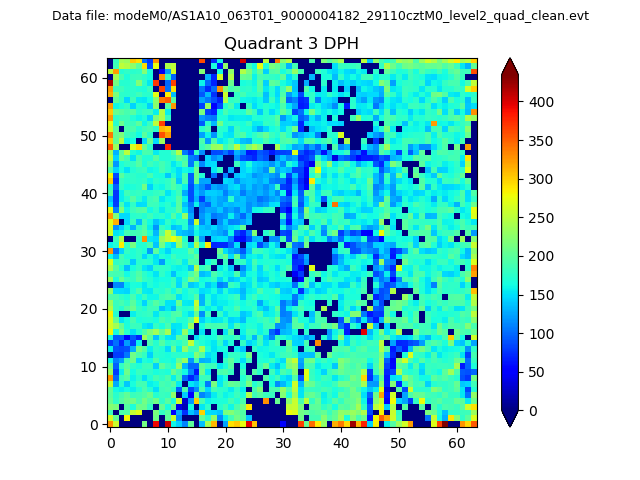 |
 |
Quadrant C |
| Plot type | Count rate plots | Images |
|---|---|---|
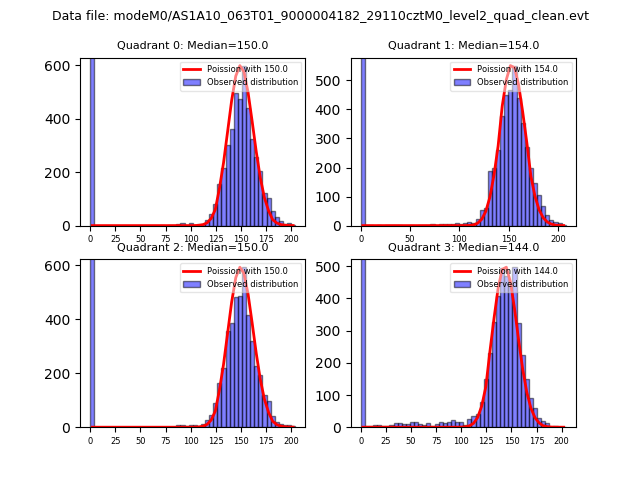
| Comparison with Poisson distribution Blue bars denote a histogram of data divided into 1 sec bins. Red curve is a Poisson curve with rate = median count rate of data. |
 |
 |
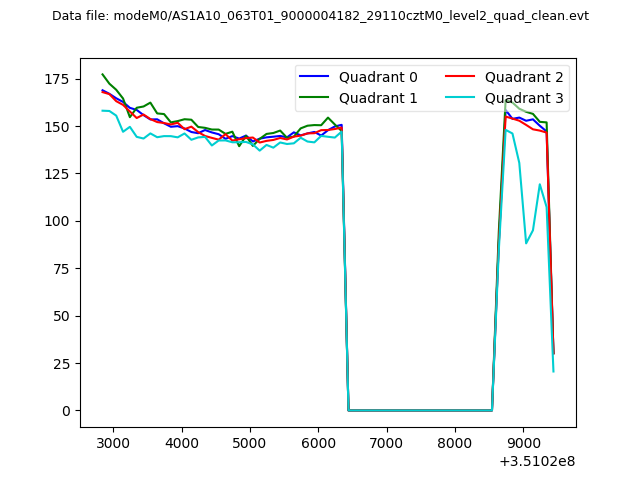
| Quadrant-wise count rates Data is divided into 100 sec bins |
 |
|
| Module-wise count rates for Quadrant A Data is divided into 100 sec bins |
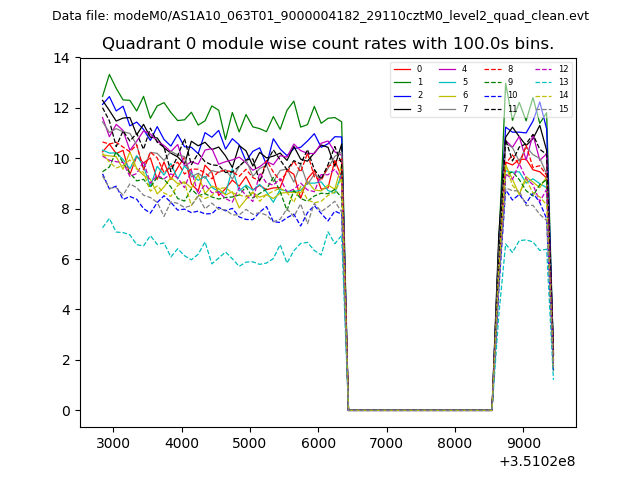 |
 |
| Module-wise count rates for Quadrant B Data is divided into 100 sec bins |
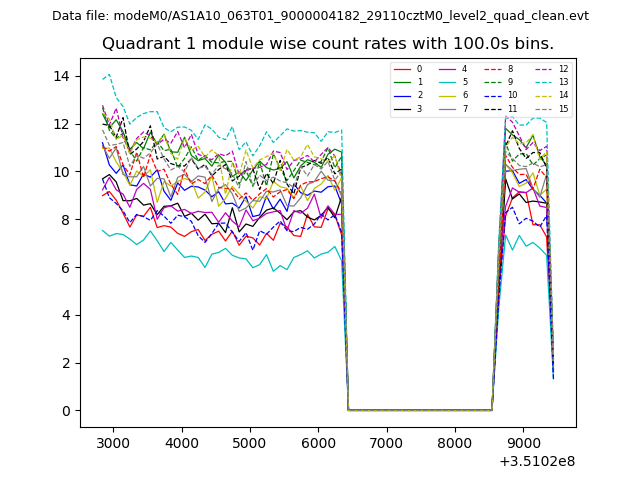 |
 |
| Module-wise count rates for Quadrant C Data is divided into 100 sec bins |
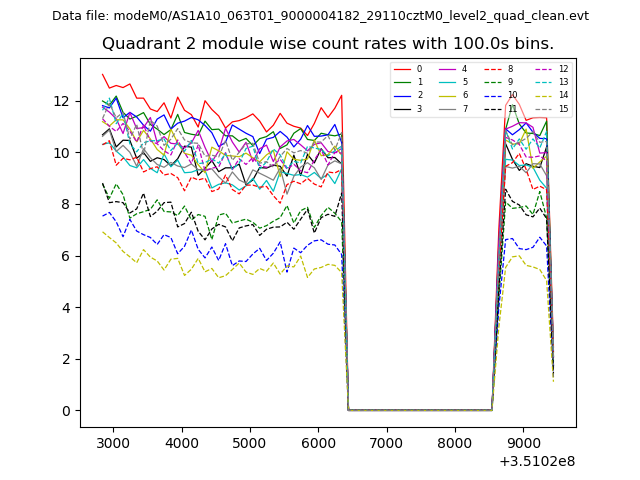 |
 |
| Module-wise count rates for Quadrant D Data is divided into 100 sec bins |
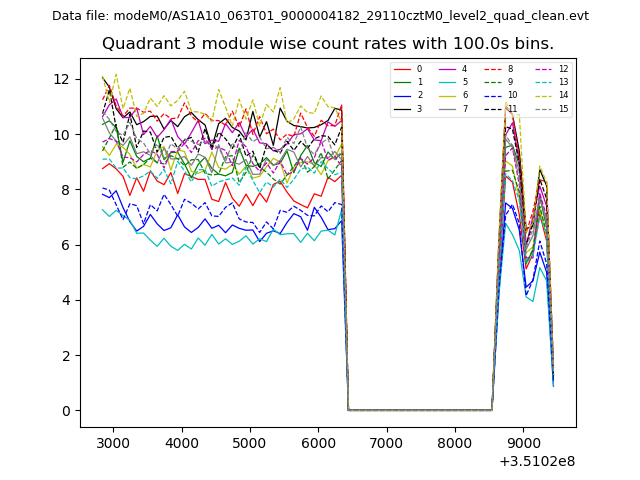 |
 |
| Parameter | Plot |
|---|---|
| CZT HV Monitor | 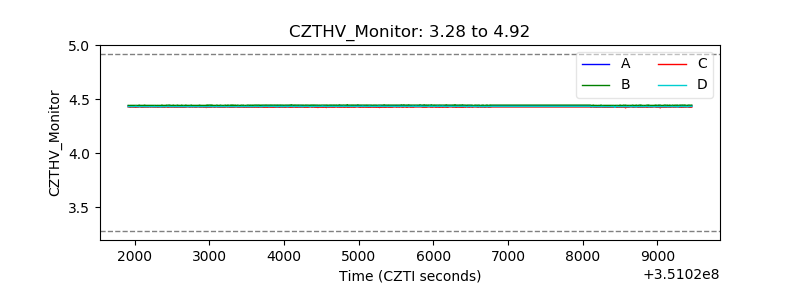 |
| D_VDD | 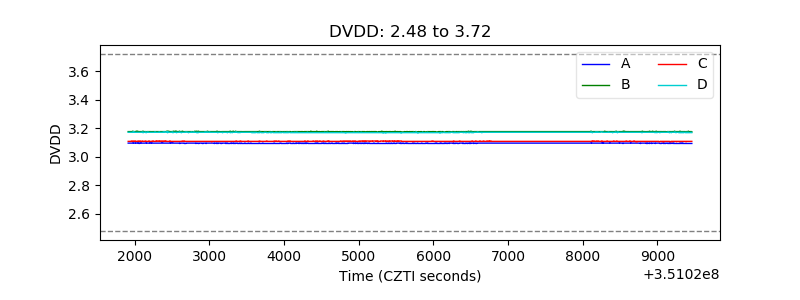 |
| Temperature 1 |  |
| Veto HV Monitor | 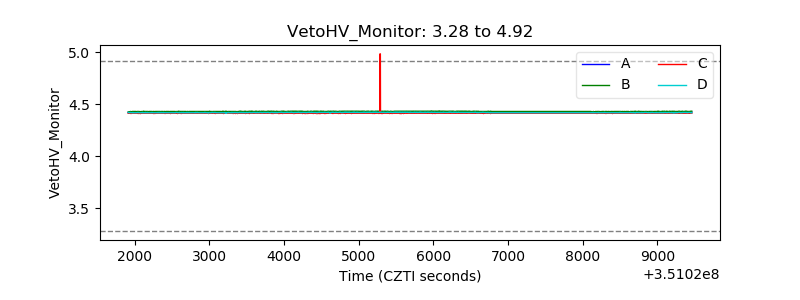 |
| Veto LLD | 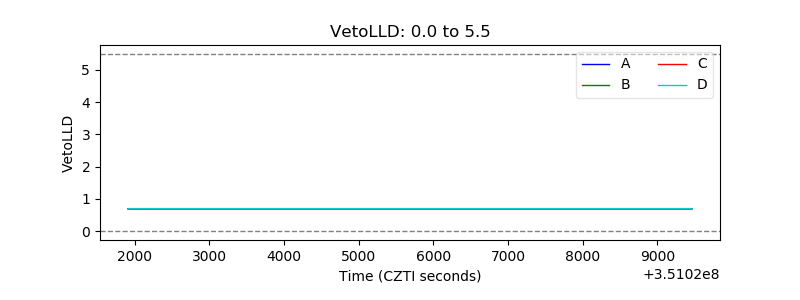 |
| Alpha Counter | 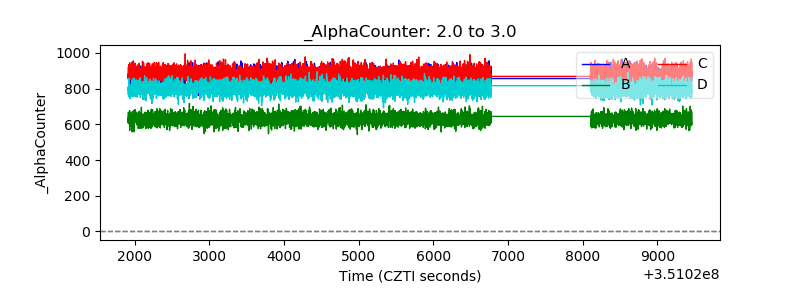 |
| _CPM_Rate | 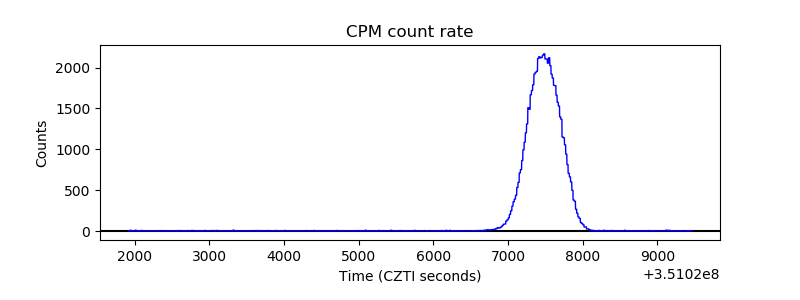 |
| CZT Counter |  |
| +2.5 Volts monitor |  |
| +5 Volts monitor |  |
| _ROLL_ROT | 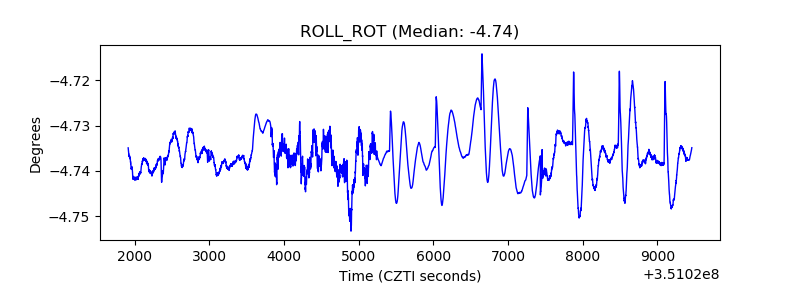 |
| _Roll_DEC | 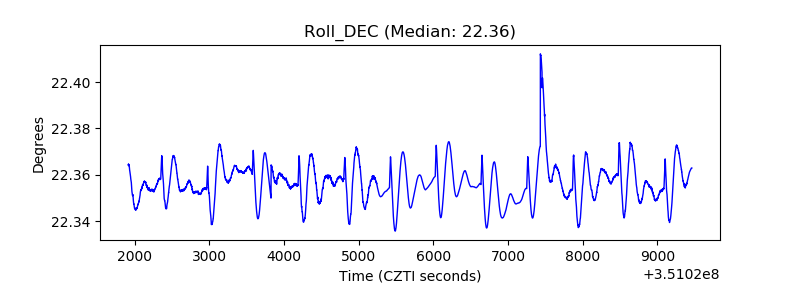 |
| _Roll_RA |  |
| Veto Counter | 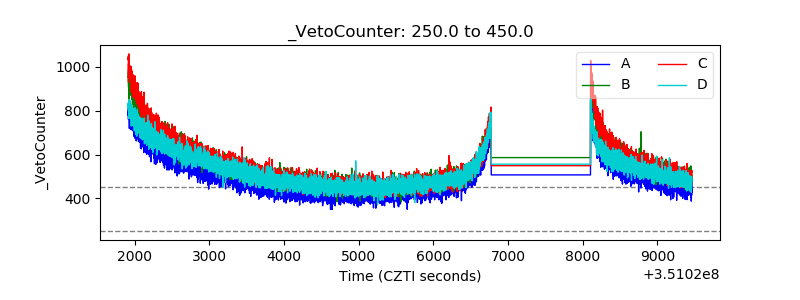 |