| Param | Original file | Final file |
|---|---|---|
| Filename | modeM0/AS1A10_063T01_9000004182_29111cztM0_level2.evt | modeM0/AS1A10_063T01_9000004182_29111cztM0_level2_quad_clean.evt |
| Size (bytes) | 625,561,920 | 101,966,400 |
| Size | 596.6 MB | 97.2 MB |
| Events in quadrant A | 3,222,993 | 676,046 |
| Events in quadrant B | 3,979,609 | 688,605 |
| Events in quadrant C | 4,255,945 | 668,809 |
| Events in quadrant D | 7,051,726 | 605,838 |
| Mode M0 | |||
|---|---|---|---|
| Quadrant | BADHDUFLAG | Total packets | Discarded packets |
| A | 0 | 13657 | 2 |
| B | 0 | 15961 | 2 |
| C | 0 | 17137 | 2 |
| D | 0 | 25449 | 2 |
| Mode M9 | |||
|---|---|---|---|
| Quadrant | BADHDUFLAG | Total packets | Discarded packets |
| A | 0 | 11 | 0 |
| B | 0 | 12 | 0 |
| C | 0 | 12 | 0 |
| D | 0 | 12 | 0 |
| Mode SS | |||
|---|---|---|---|
| Quadrant | BADHDUFLAG | Total packets | Discarded packets |
| A | 0 | 132 | 0 |
| B | 0 | 132 | 0 |
| C | 0 | 132 | 0 |
| D | 0 | 132 | 0 |
| Quadrant | Total seconds | Saturated seconds | Saturation percentage |
|---|---|---|---|
| A | 6425 | 26 | 0.404669% |
| B | 6424 | 188 | 2.926526% |
| C | 6424 | 157 | 2.443960% |
| D | 6424 | 916 | 14.259029% |
Noise dominated data is calculated using 1-second bins in cleaned event files. If a bin has >2000 counts, and if more than 50% of those come from <1% of pixels, then it is considered to be noise-dominated and hence unusable.
| Quadrant | # 1 sec bins | Bins with >0 counts | Bins with >2000 counts | High rate bins dominated by noise | Noise dominated (total time) | Noise dominated (detector-on time) | Marked lightcurve |
|---|---|---|---|---|---|---|---|
| A | 7605 | 6426 | 0 | 0 | 0.00% | 0.00% | 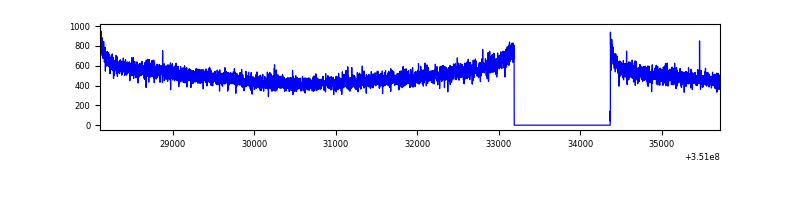 |
| B | 7604 | 6425 | 109 | 109 | 1.43% | 1.70% | 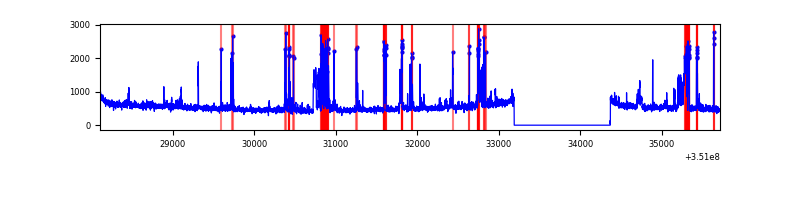 |
| C | 7604 | 6425 | 2 | 2 | 0.03% | 0.03% | 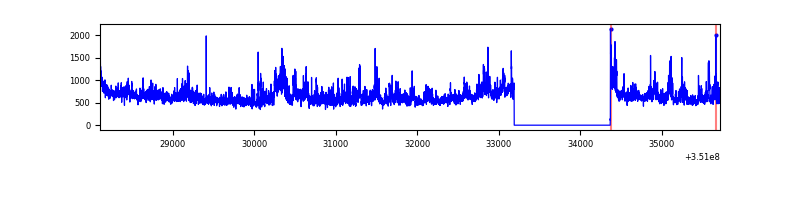 |
| D | 7604 | 6425 | 798 | 798 | 10.49% | 12.42% | 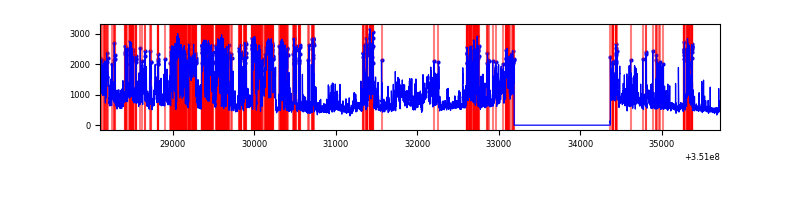 |
Top three noisy pixels from each quadrant. If the there are fewer than three noisy pixels in the level2.evt file, extra rows are filled as -1
| Pixel properties | Quadrant properties | ||||||
|---|---|---|---|---|---|---|---|
| Quadrant | DetID | PixID | Counts | Sigma | Mean | Median | Sigma |
| A | 13 | 254 | 11411 | 63.84 | 835 | 820 | 165.9 |
| A | 3 | 137 | 7696 | 41.45 | 835 | 820 | 165.9 |
| A | 0 | 226 | 7007 | 37.29 | 835 | 820 | 165.9 |
| B | 10 | 245 | 604110 | 3851.82 | 833 | 815 | 156.6 |
| B | 15 | 222 | 45453 | 285.0 | 833 | 815 | 156.6 |
| B | 0 | 190 | 19691 | 120.52 | 833 | 815 | 156.6 |
| C | 3 | 233 | 928571 | 4907.69 | 814 | 821 | 189.0 |
| C | 14 | 238 | 131953 | 693.67 | 814 | 821 | 189.0 |
| C | 2 | 114 | 15194 | 76.03 | 814 | 821 | 189.0 |
| D | 1 | 52 | 3531862 | 19140.39 | 773 | 755 | 184.5 |
| D | 8 | 195 | 482458 | 2611.07 | 773 | 755 | 184.5 |
| D | 12 | 233 | 68684 | 368.21 | 773 | 755 | 184.5 |
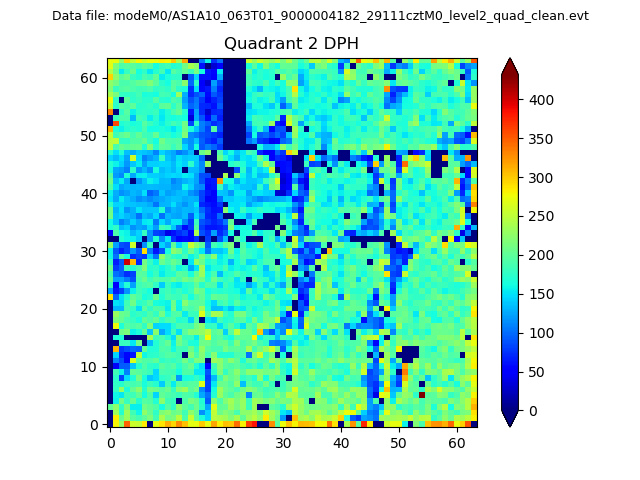
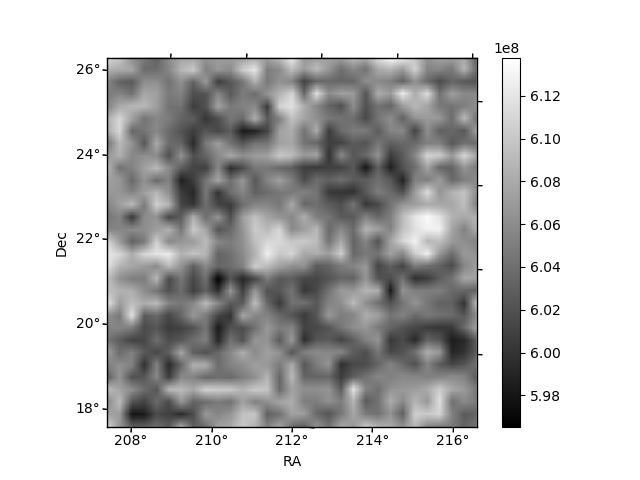
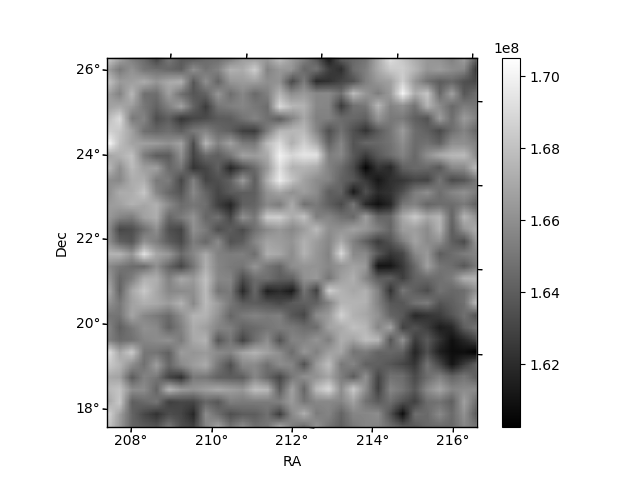
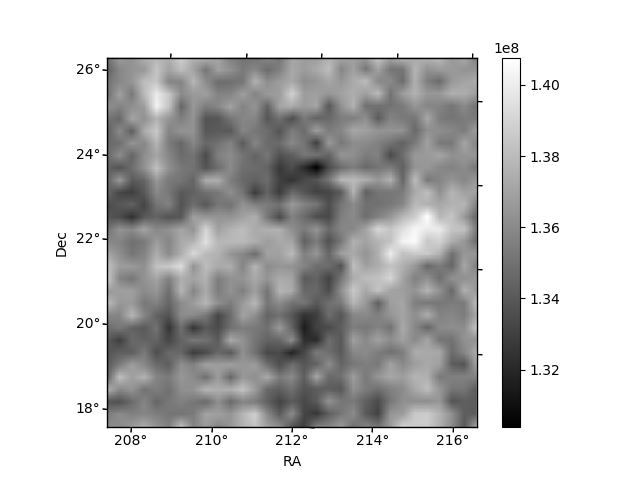
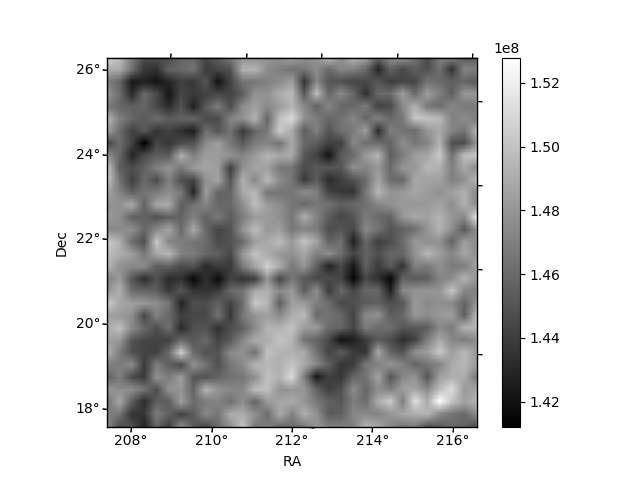
Histogram calculated using DETX and DETY for each event in the final _common_clean file
| Quadrant A | 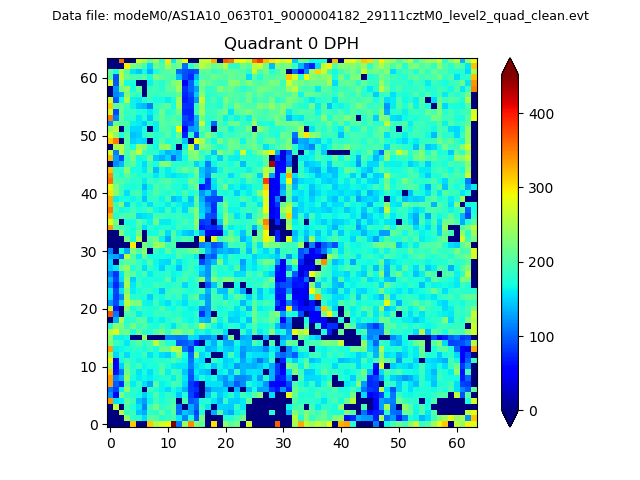 |
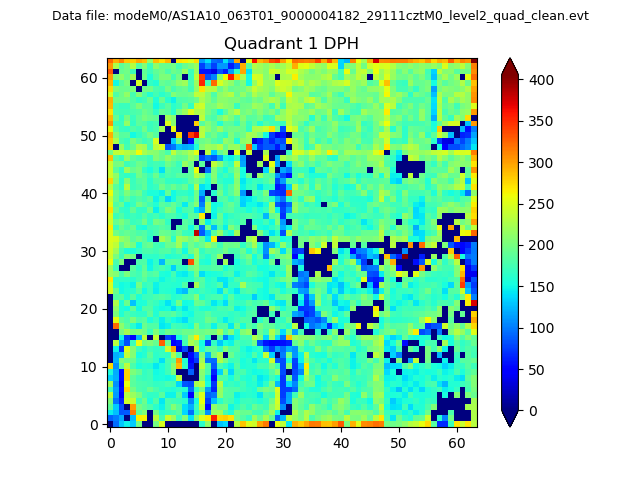 |
Quadrant B |
|---|---|---|---|
| Quadrant D | 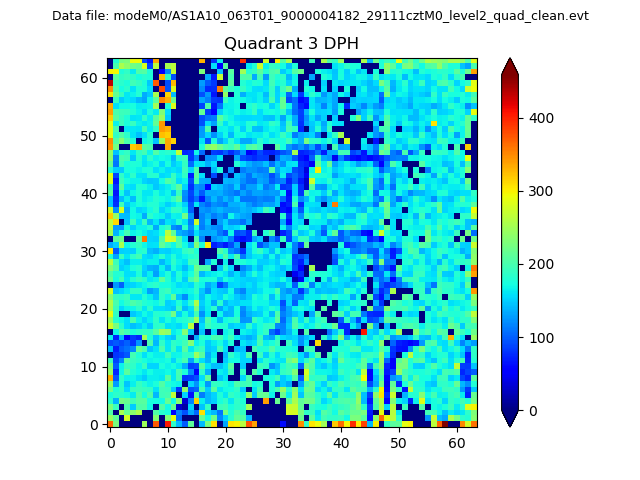 |
 |
Quadrant C |
| Plot type | Count rate plots | Images |
|---|---|---|
| Comparison with Poisson distribution Blue bars denote a histogram of data divided into 1 sec bins. Red curve is a Poisson curve with rate = median count rate of data. |
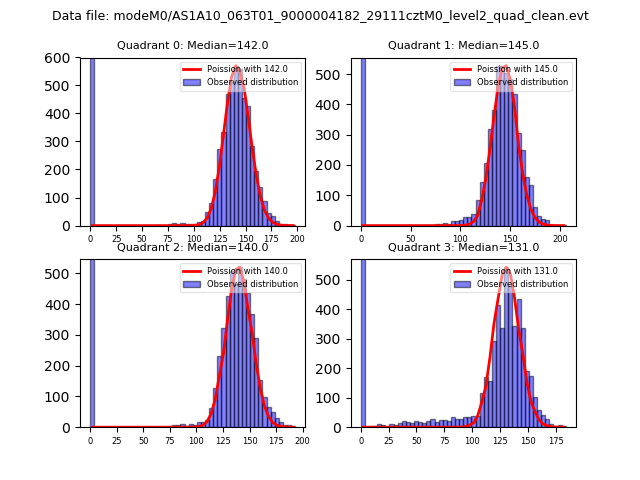 |
 |
| Quadrant-wise count rates Data is divided into 100 sec bins |
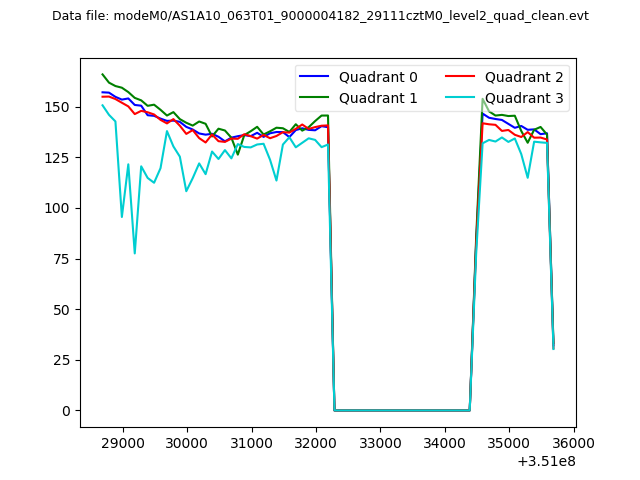 |
|
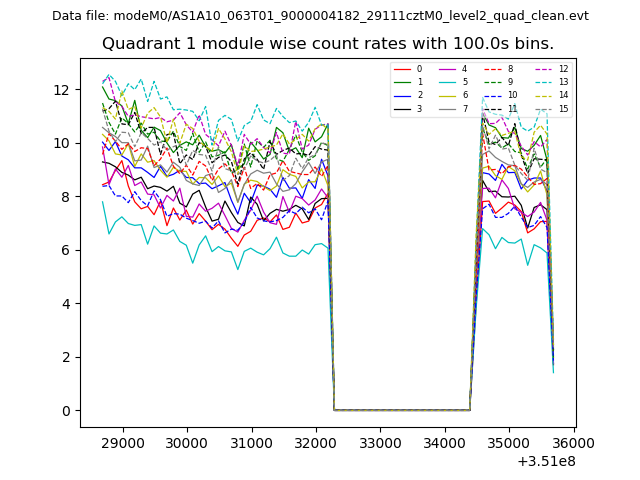
| Module-wise count rates for Quadrant A Data is divided into 100 sec bins |
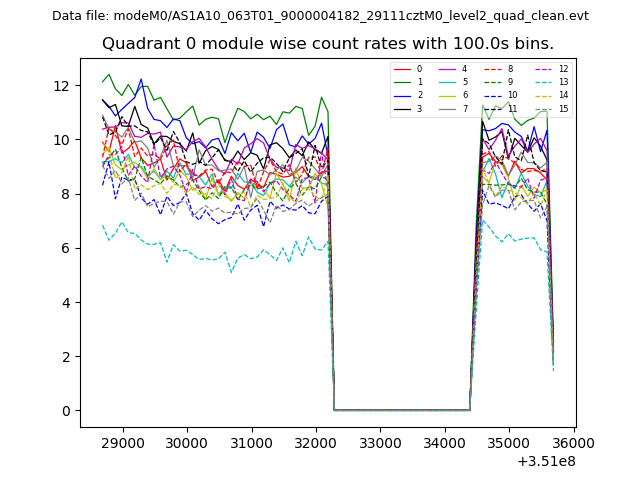 |
 |
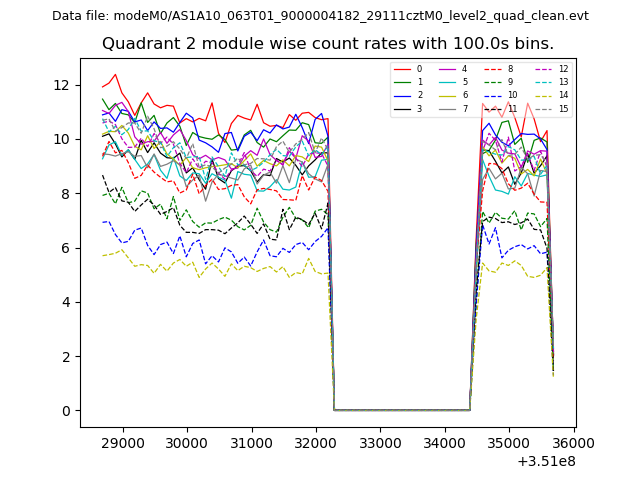
| Module-wise count rates for Quadrant B Data is divided into 100 sec bins |
 |
 |
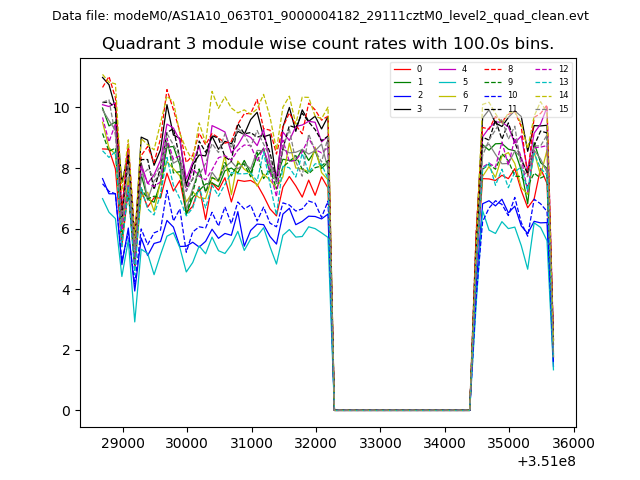
| Module-wise count rates for Quadrant C Data is divided into 100 sec bins |
 |
 |
| Module-wise count rates for Quadrant D Data is divided into 100 sec bins |
 |
 |
| Parameter | Plot |
|---|---|
| CZT HV Monitor | 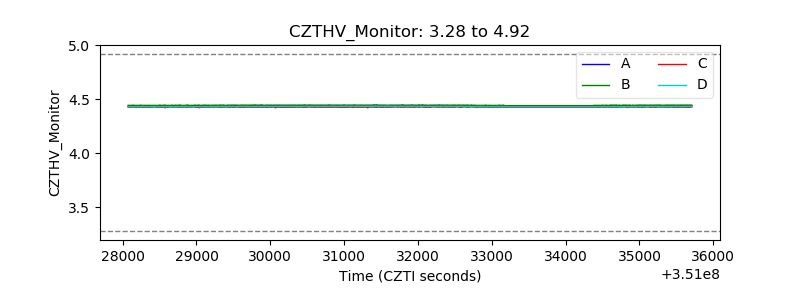 |
| D_VDD | 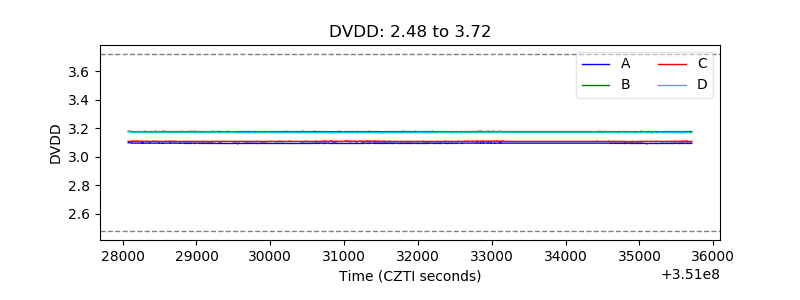 |
| Temperature 1 | 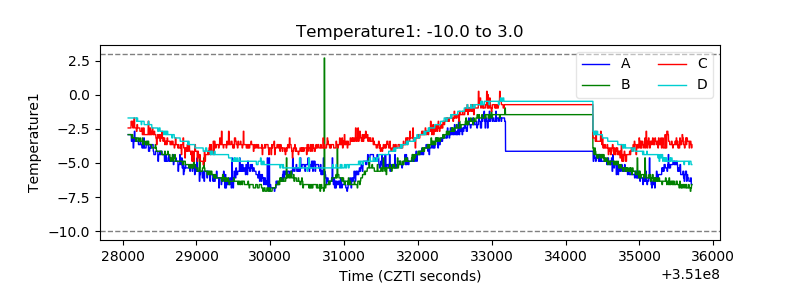 |
| Veto HV Monitor | 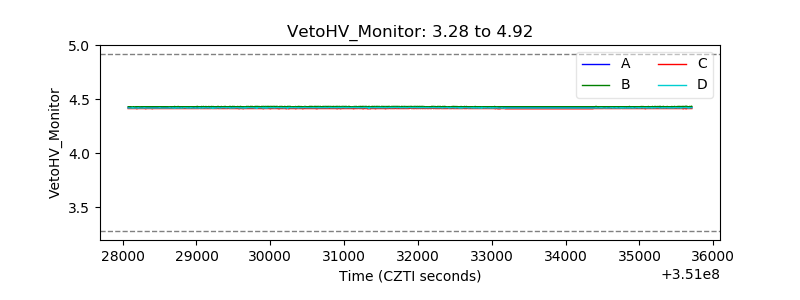 |
| Veto LLD | 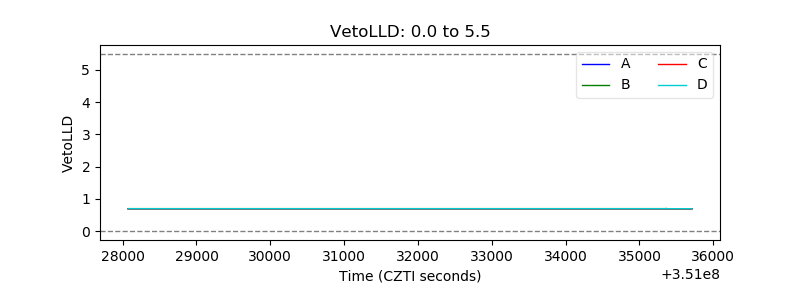 |
| Alpha Counter | 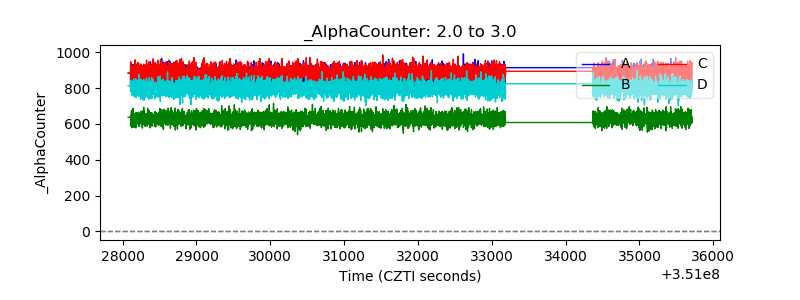 |
| _CPM_Rate | 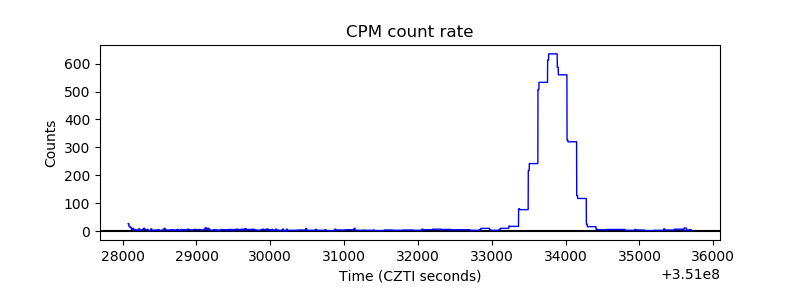 |
| CZT Counter | 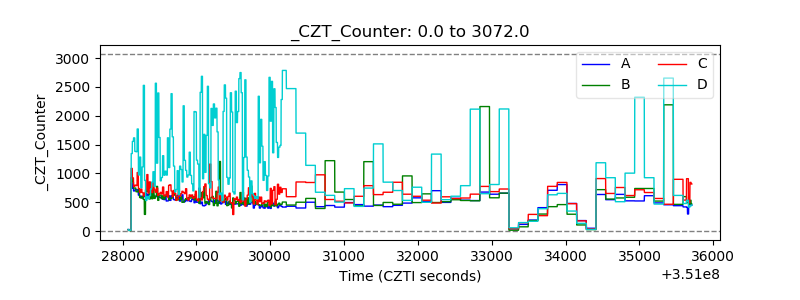 |
| +2.5 Volts monitor |  |
| +5 Volts monitor |  |
| _ROLL_ROT | 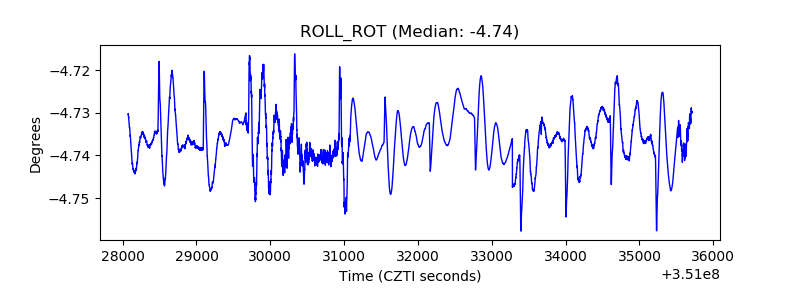 |
| _Roll_DEC | 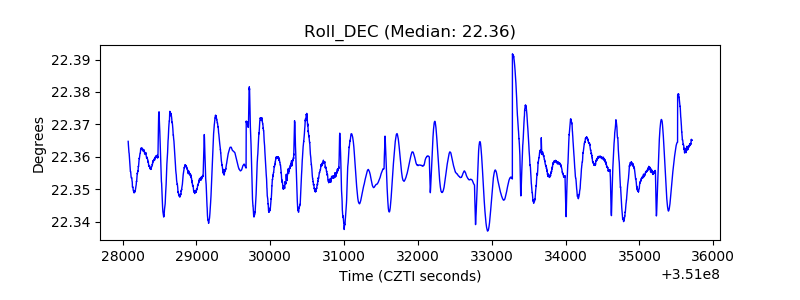 |
| _Roll_RA | 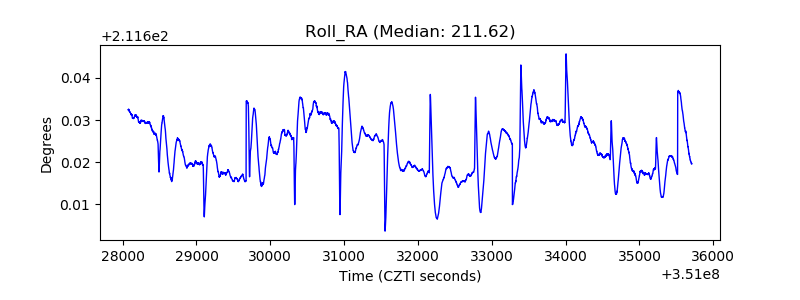 |
| Veto Counter | 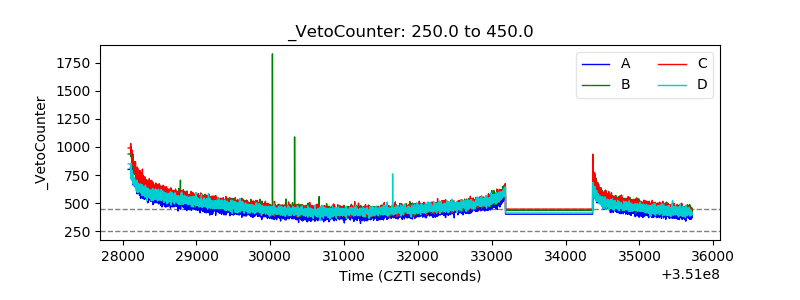 |