| Param | Original file | Final file |
|---|---|---|
| Filename | modeM0/AS1A10_063T01_9000004182_29112cztM0_level2.evt | modeM0/AS1A10_063T01_9000004182_29112cztM0_level2_quad_clean.evt |
| Size (bytes) | 542,753,280 | 104,063,040 |
| Size | 517.6 MB | 99.2 MB |
| Events in quadrant A | 3,368,385 | 673,500 |
| Events in quadrant B | 3,640,419 | 688,491 |
| Events in quadrant C | 4,562,316 | 663,678 |
| Events in quadrant D | 4,398,173 | 645,109 |
| Mode M0 | |||
|---|---|---|---|
| Quadrant | BADHDUFLAG | Total packets | Discarded packets |
| A | 0 | 14476 | 2 |
| B | 0 | 15209 | 2 |
| C | 0 | 18366 | 2 |
| D | 0 | 17626 | 2 |
| Mode M9 | |||
|---|---|---|---|
| Quadrant | BADHDUFLAG | Total packets | Discarded packets |
| A | 0 | 15 | 0 |
| B | 0 | 16 | 0 |
| C | 0 | 16 | 0 |
| D | 0 | 16 | 0 |
| Mode SS | |||
|---|---|---|---|
| Quadrant | BADHDUFLAG | Total packets | Discarded packets |
| A | 0 | 142 | 0 |
| B | 0 | 142 | 0 |
| C | 0 | 142 | 0 |
| D | 0 | 142 | 0 |
| Quadrant | Total seconds | Saturated seconds | Saturation percentage |
|---|---|---|---|
| A | 6896 | 44 | 0.638051% |
| B | 6896 | 119 | 1.725638% |
| C | 6896 | 169 | 2.450696% |
| D | 6896 | 164 | 2.378190% |
Noise dominated data is calculated using 1-second bins in cleaned event files. If a bin has >2000 counts, and if more than 50% of those come from <1% of pixels, then it is considered to be noise-dominated and hence unusable.
| Quadrant | # 1 sec bins | Bins with >0 counts | Bins with >2000 counts | High rate bins dominated by noise | Noise dominated (total time) | Noise dominated (detector-on time) | Marked lightcurve |
|---|---|---|---|---|---|---|---|
| A | 7621 | 6897 | 0 | 0 | 0.00% | 0.00% | 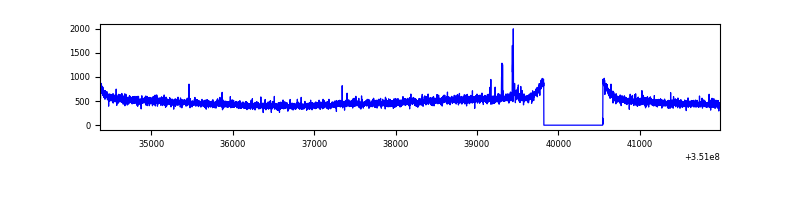 |
| B | 7621 | 6897 | 27 | 27 | 0.35% | 0.39% | 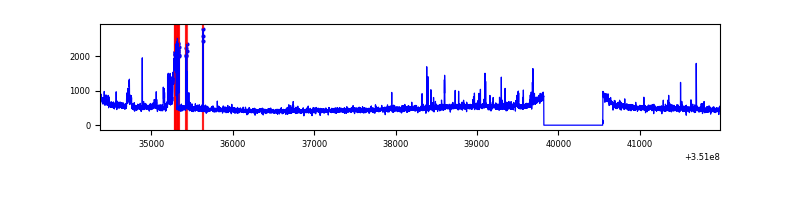 |
| C | 7621 | 6897 | 2 | 2 | 0.03% | 0.03% | 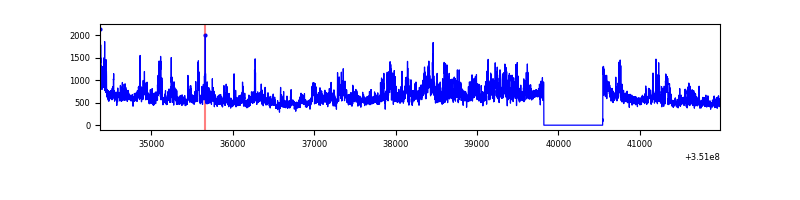 |
| D | 7621 | 6897 | 115 | 115 | 1.51% | 1.67% | 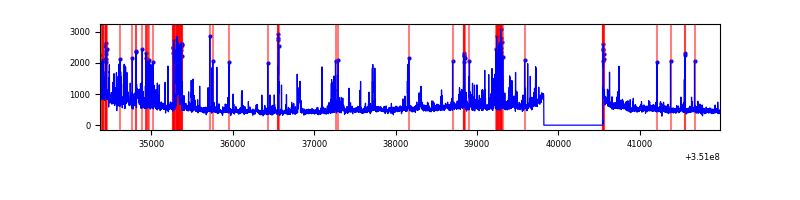 |
Top three noisy pixels from each quadrant. If the there are fewer than three noisy pixels in the level2.evt file, extra rows are filled as -1
| Pixel properties | Quadrant properties | ||||||
|---|---|---|---|---|---|---|---|
| Quadrant | DetID | PixID | Counts | Sigma | Mean | Median | Sigma |
| A | 15 | 174 | 30896 | 173.59 | 863 | 845 | 173.1 |
| A | 13 | 254 | 12490 | 67.27 | 863 | 845 | 173.1 |
| A | 3 | 137 | 8367 | 43.45 | 863 | 845 | 173.1 |
| B | 10 | 245 | 221640 | 1332.77 | 862 | 841 | 165.7 |
| B | 12 | 111 | 20257 | 117.2 | 862 | 841 | 165.7 |
| B | 5 | 255 | 18907 | 109.05 | 862 | 841 | 165.7 |
| C | 3 | 233 | 1154420 | 5889.53 | 836 | 843 | 195.9 |
| C | 14 | 238 | 134222 | 680.96 | 836 | 843 | 195.9 |
| C | 2 | 114 | 16524 | 80.06 | 836 | 843 | 195.9 |
| D | 1 | 52 | 806402 | 4021.47 | 832 | 809 | 200.3 |
| D | 8 | 195 | 323143 | 1609.07 | 832 | 809 | 200.3 |
| D | 12 | 233 | 57599 | 283.49 | 832 | 809 | 200.3 |
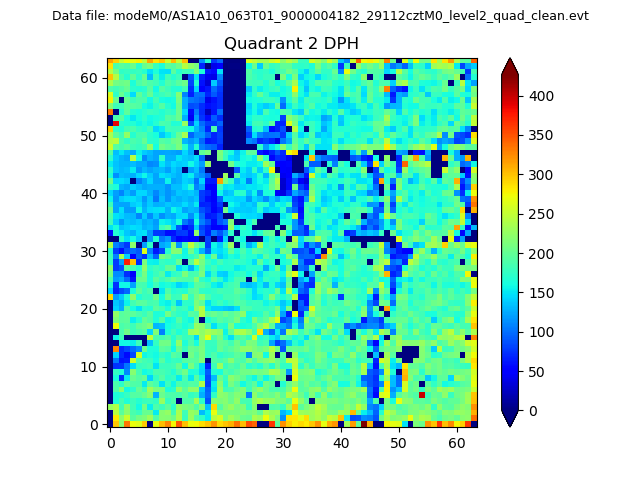
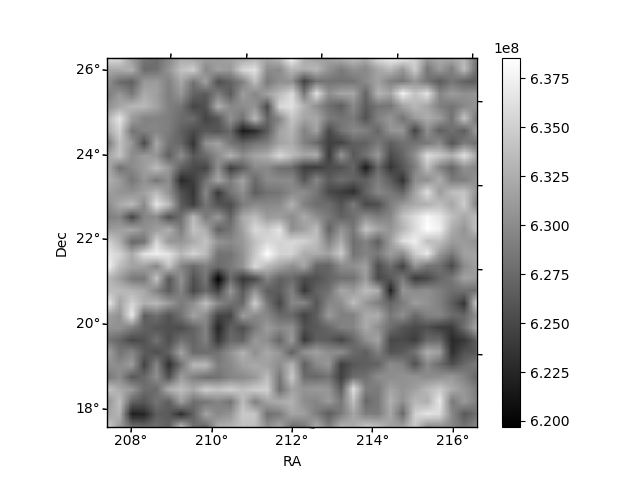
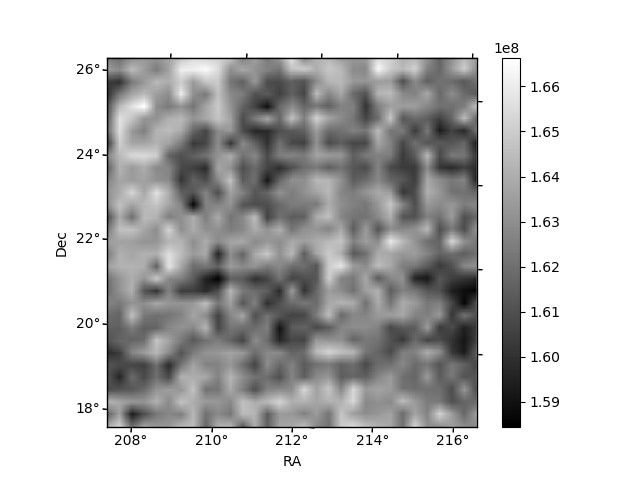
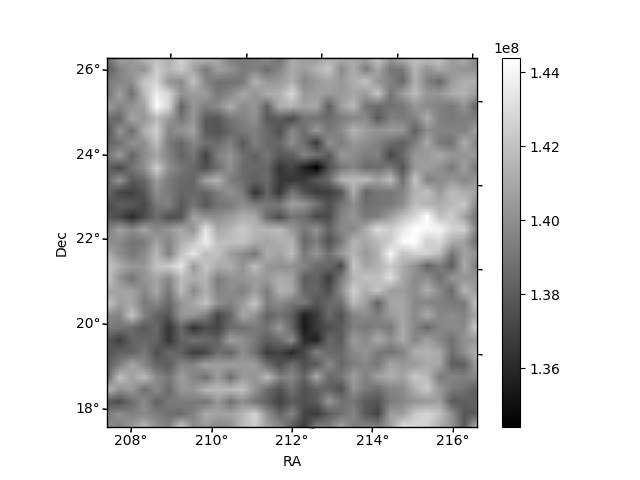
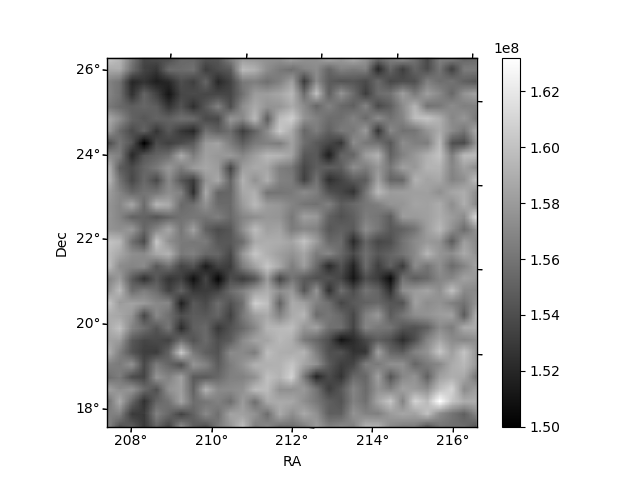
Histogram calculated using DETX and DETY for each event in the final _common_clean file
| Quadrant A | 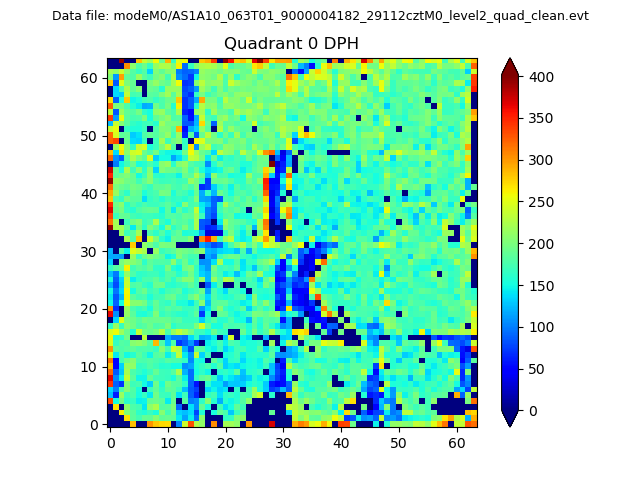 |
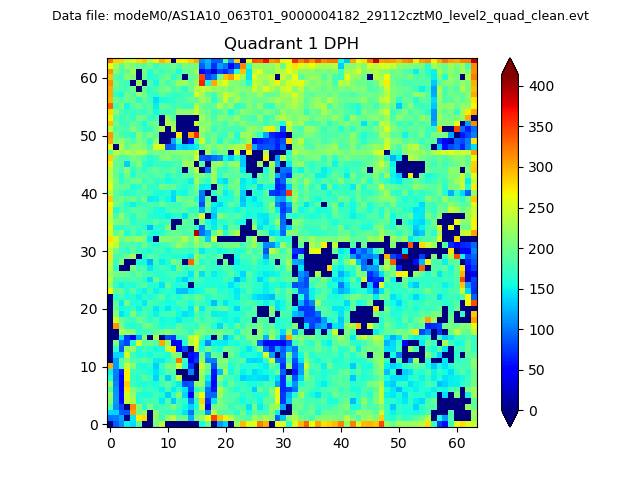 |
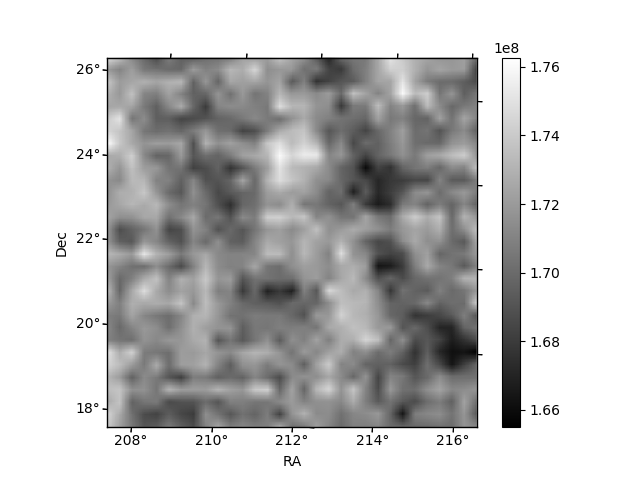
Quadrant B |
|---|---|---|---|
| Quadrant D | 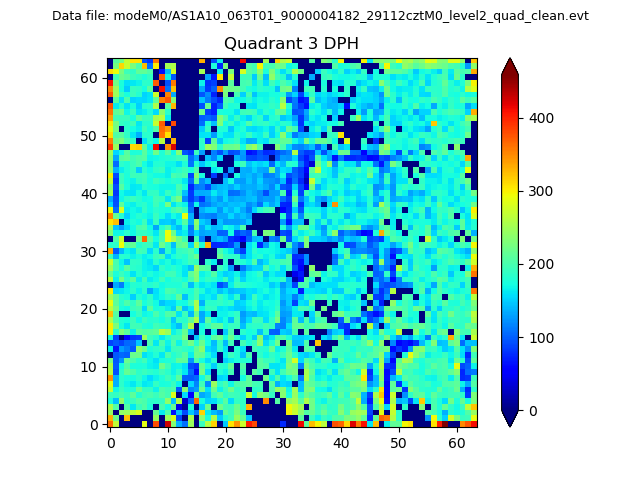 |
 |
Quadrant C |
| Plot type | Count rate plots | Images |
|---|---|---|
| Comparison with Poisson distribution Blue bars denote a histogram of data divided into 1 sec bins. Red curve is a Poisson curve with rate = median count rate of data. |
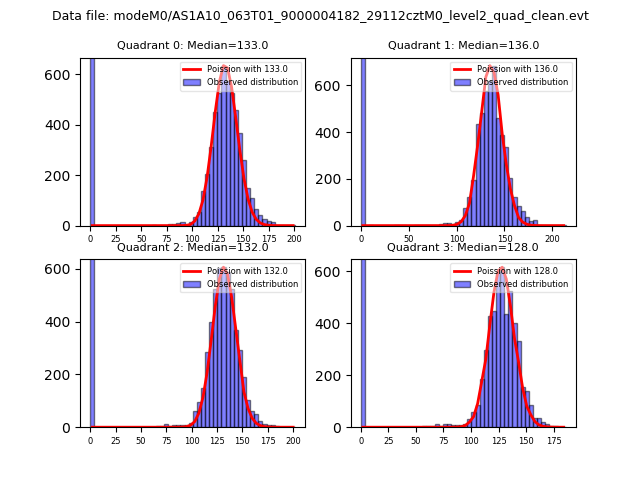 |
 |
| Quadrant-wise count rates Data is divided into 100 sec bins |
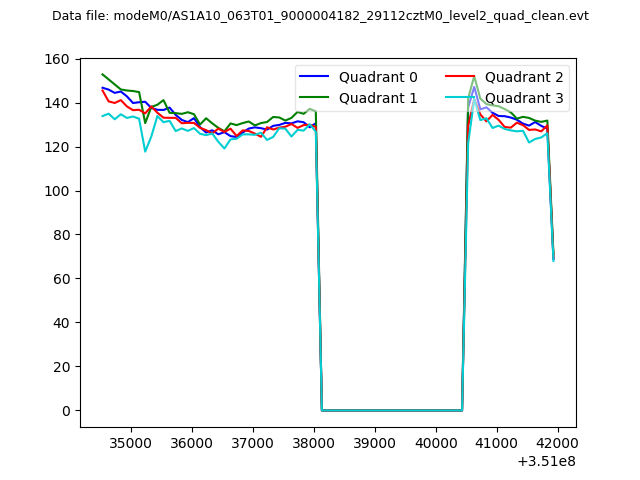 |
|
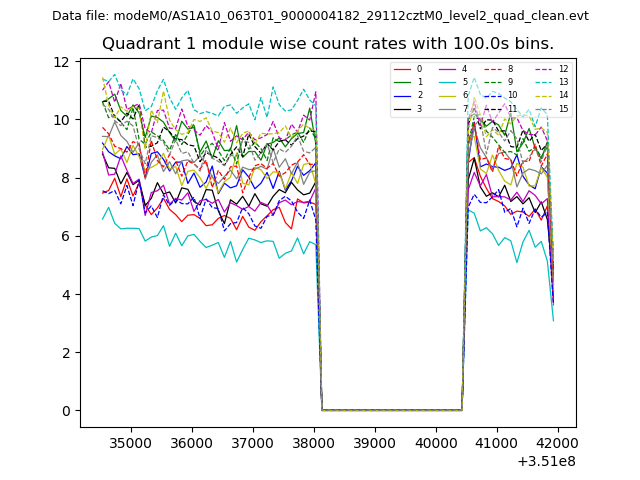
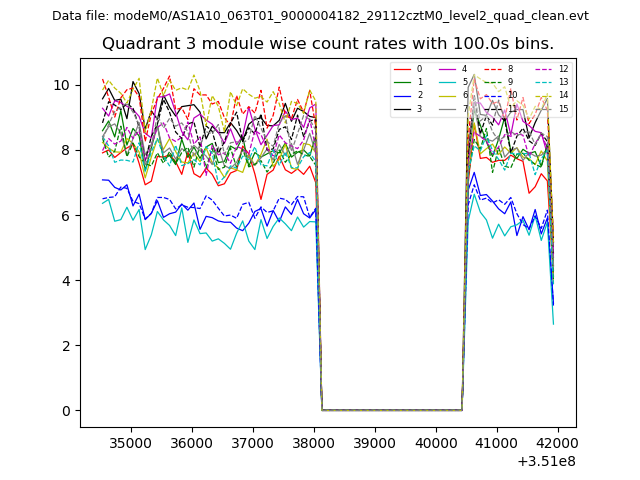
| Module-wise count rates for Quadrant A Data is divided into 100 sec bins |
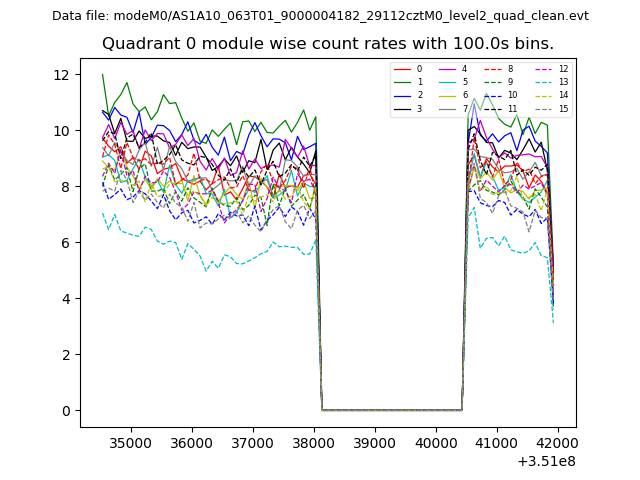 |
 |
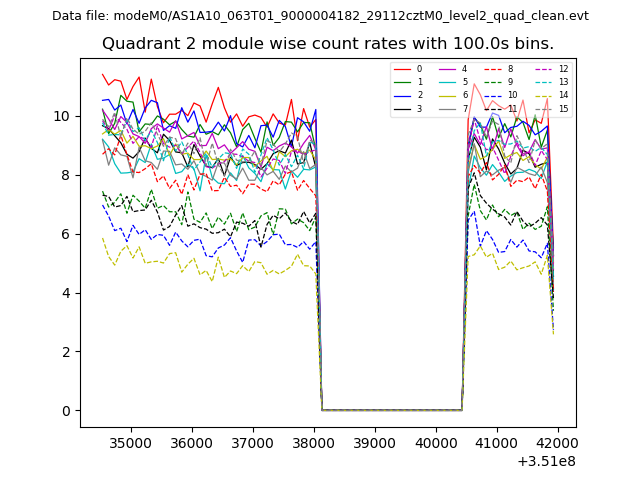
| Module-wise count rates for Quadrant B Data is divided into 100 sec bins |
 |
 |
| Module-wise count rates for Quadrant C Data is divided into 100 sec bins |
 |
 |
| Module-wise count rates for Quadrant D Data is divided into 100 sec bins |
 |
 |
| Parameter | Plot |
|---|---|
| CZT HV Monitor | 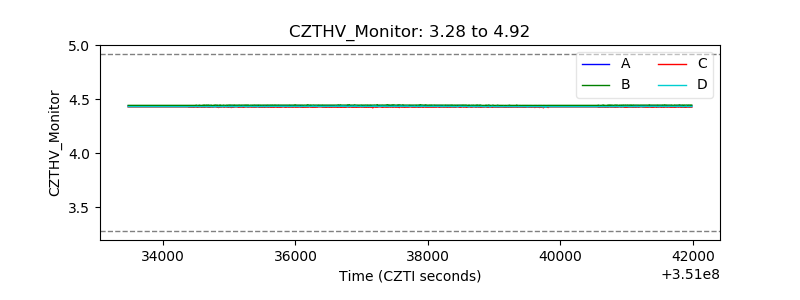 |
| D_VDD | 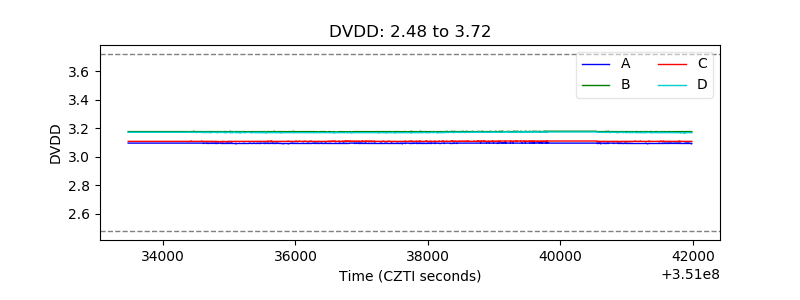 |
| Temperature 1 | 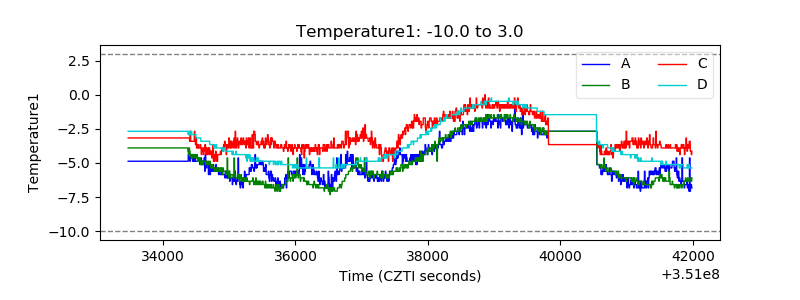 |
| Veto HV Monitor | 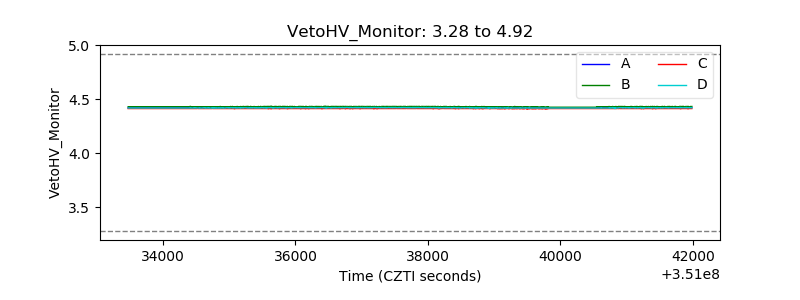 |
| Veto LLD | 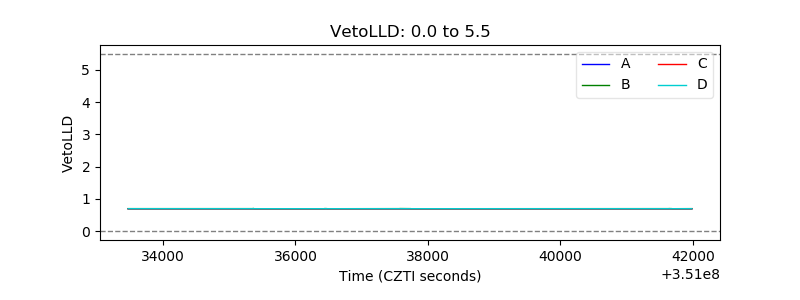 |
| Alpha Counter | 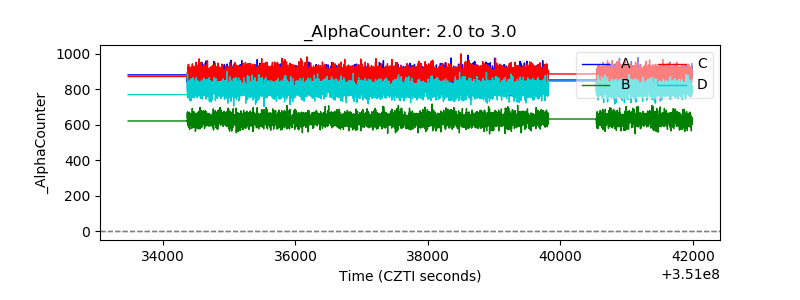 |
| _CPM_Rate | 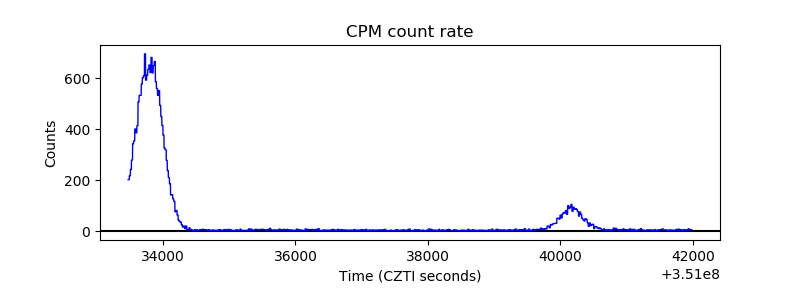 |
| CZT Counter | 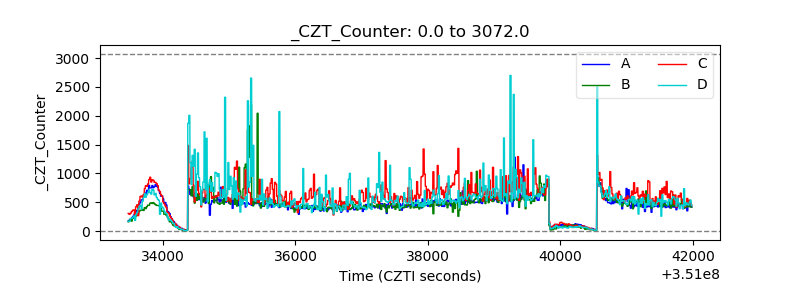 |
| +2.5 Volts monitor |  |
| +5 Volts monitor | 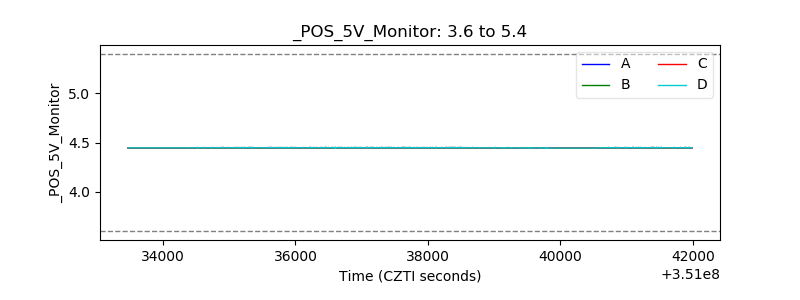 |
| _ROLL_ROT | 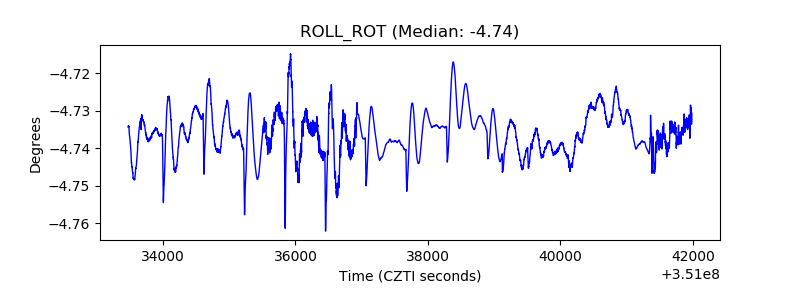 |
| _Roll_DEC | 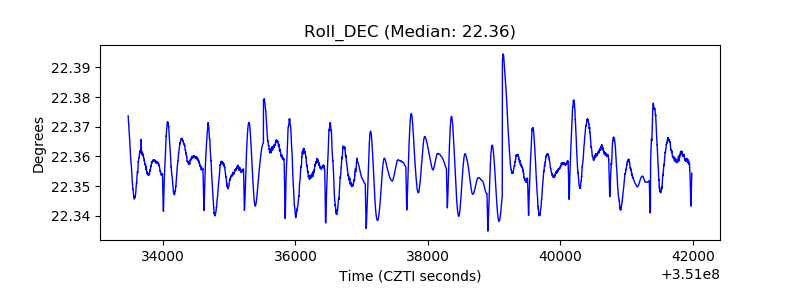 |
| _Roll_RA | 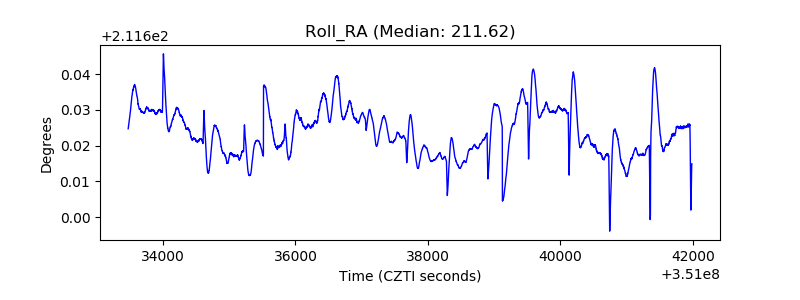 |
| Veto Counter | 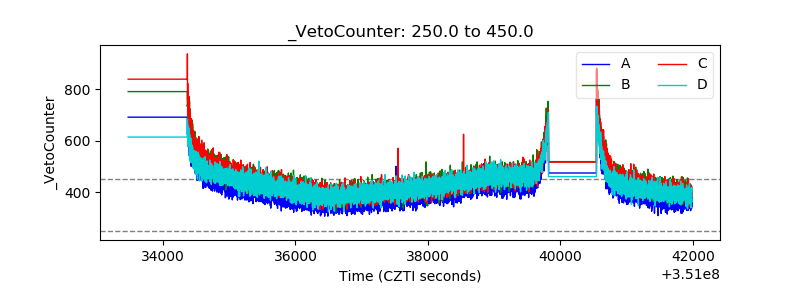 |