| Param | Original file | Final file |
|---|---|---|
| Filename | modeM0/AS1A10_063T01_9000004182_29114cztM0_level2.evt | modeM0/AS1A10_063T01_9000004182_29114cztM0_level2_quad_clean.evt |
| Size (bytes) | 645,998,400 | 119,459,520 |
| Size | 616.1 MB | 113.9 MB |
| Events in quadrant A | 4,069,832 | 771,788 |
| Events in quadrant B | 4,779,463 | 778,554 |
| Events in quadrant C | 4,827,243 | 755,349 |
| Events in quadrant D | 5,331,837 | 741,883 |
| Mode M0 | |||
|---|---|---|---|
| Quadrant | BADHDUFLAG | Total packets | Discarded packets |
| A | 0 | 17654 | 2 |
| B | 0 | 19561 | 6 |
| C | 0 | 19700 | 2 |
| D | 0 | 21689 | 4 |
| Mode SS | |||
|---|---|---|---|
| Quadrant | BADHDUFLAG | Total packets | Discarded packets |
| A | 0 | 164 | 0 |
| B | 0 | 164 | 0 |
| C | 0 | 164 | 0 |
| D | 0 | 164 | 0 |
| Quadrant | Total seconds | Saturated seconds | Saturation percentage |
|---|---|---|---|
| A | 8201 | 276 | 3.365443% |
| B | 8201 | 532 | 6.487014% |
| C | 8202 | 416 | 5.071934% |
| D | 8201 | 275 | 3.353250% |
Noise dominated data is calculated using 1-second bins in cleaned event files. If a bin has >2000 counts, and if more than 50% of those come from <1% of pixels, then it is considered to be noise-dominated and hence unusable.
| Quadrant | # 1 sec bins | Bins with >0 counts | Bins with >2000 counts | High rate bins dominated by noise | Noise dominated (total time) | Noise dominated (detector-on time) | Marked lightcurve |
|---|---|---|---|---|---|---|---|
| A | 8241 | 8203 | 0 | 0 | 0.00% | 0.00% | 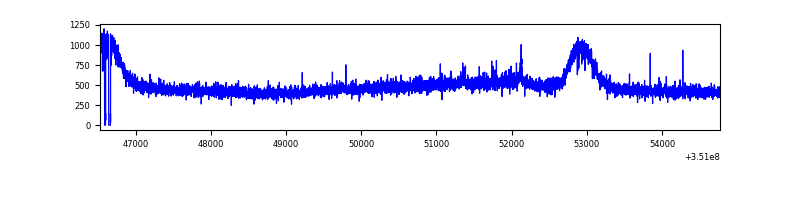 |
| B | 8242 | 8204 | 137 | 137 | 1.66% | 1.67% | 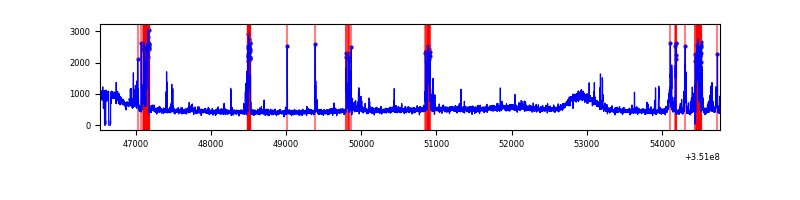 |
| C | 8242 | 8204 | 0 | 0 | 0.00% | 0.00% | 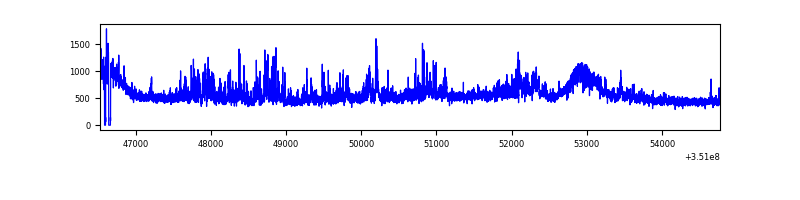 |
| D | 8242 | 8204 | 105 | 105 | 1.27% | 1.28% | 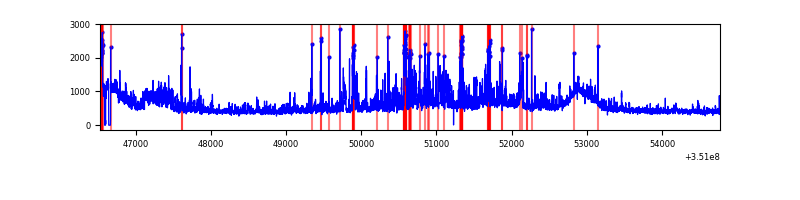 |
Top three noisy pixels from each quadrant. If the there are fewer than three noisy pixels in the level2.evt file, extra rows are filled as -1
| Pixel properties | Quadrant properties | ||||||
|---|---|---|---|---|---|---|---|
| Quadrant | DetID | PixID | Counts | Sigma | Mean | Median | Sigma |
| A | 15 | 174 | 19271 | 84.63 | 1049 | 1024 | 215.6 |
| A | 13 | 254 | 13259 | 56.75 | 1049 | 1024 | 215.6 |
| A | 3 | 137 | 11024 | 46.38 | 1049 | 1024 | 215.6 |
| B | 10 | 245 | 600060 | 2945.94 | 1033 | 1005 | 203.3 |
| B | 0 | 190 | 87443 | 425.07 | 1033 | 1005 | 203.3 |
| B | 12 | 111 | 25935 | 122.6 | 1033 | 1005 | 203.3 |
| C | 3 | 233 | 734171 | 3050.97 | 1004 | 1011 | 240.3 |
| C | 14 | 238 | 157997 | 653.28 | 1004 | 1011 | 240.3 |
| C | 2 | 114 | 19647 | 77.55 | 1004 | 1011 | 240.3 |
| D | 1 | 52 | 846828 | 3483.95 | 1009 | 982 | 242.8 |
| D | 8 | 195 | 579883 | 2384.43 | 1009 | 982 | 242.8 |
| D | 13 | 104 | 71638 | 291.02 | 1009 | 982 | 242.8 |
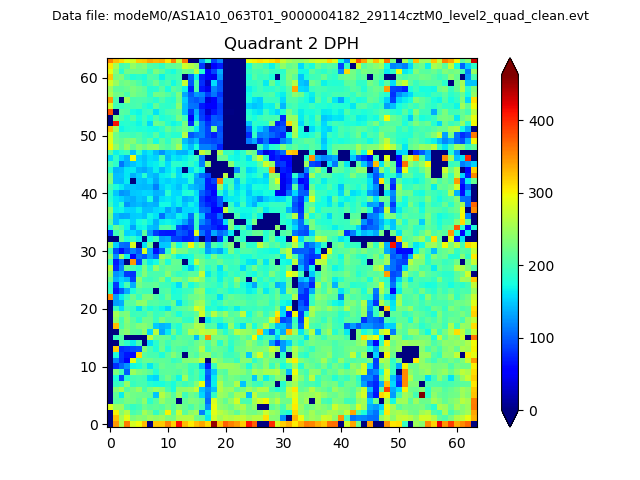
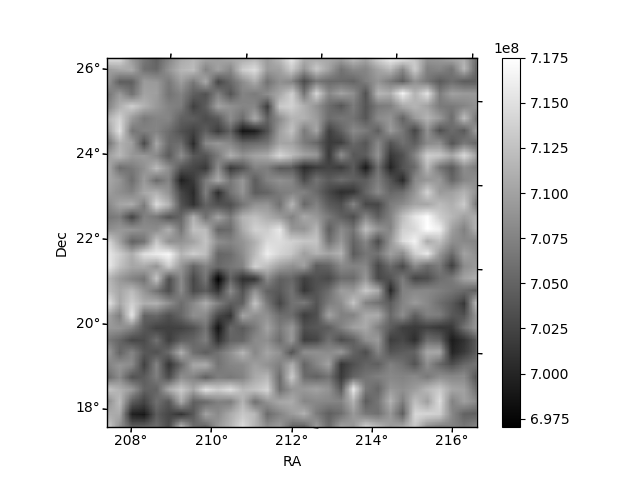
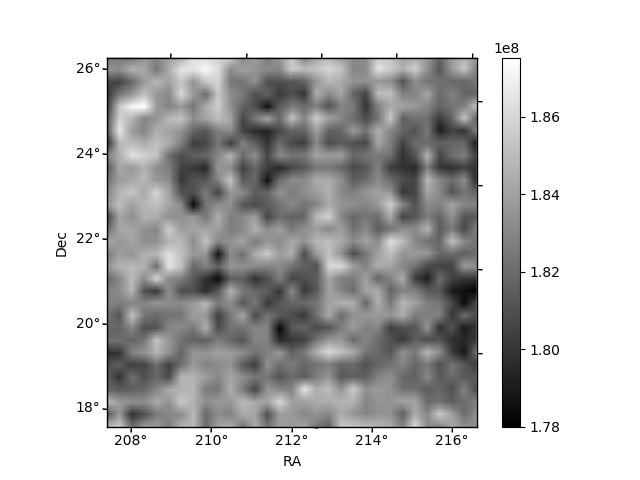
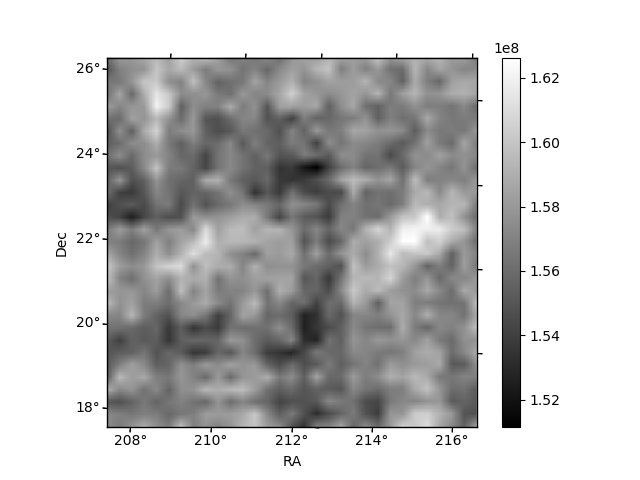
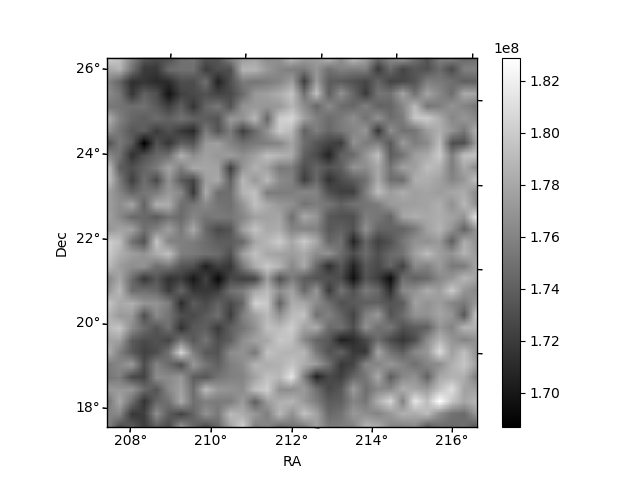
Histogram calculated using DETX and DETY for each event in the final _common_clean file
| Quadrant A | 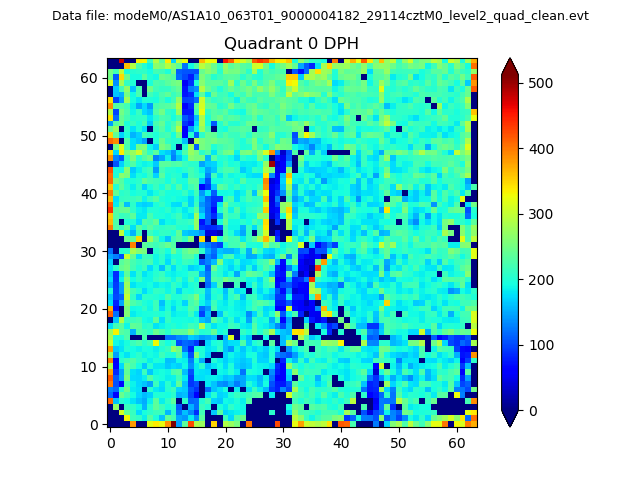 |
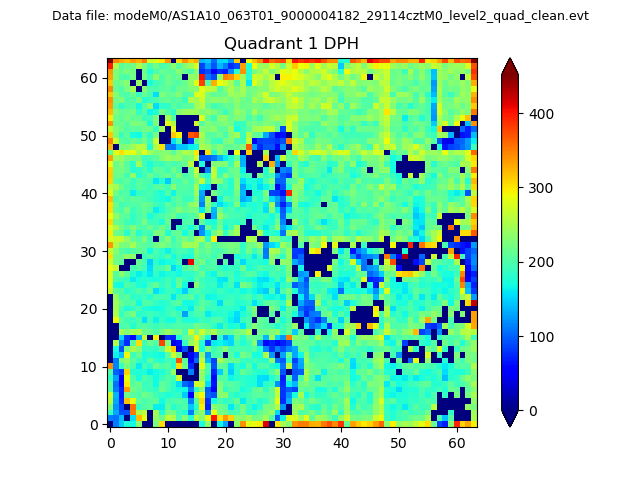 |
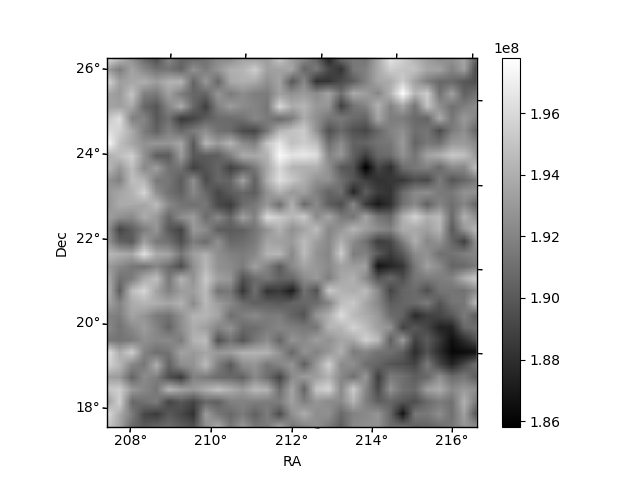
Quadrant B |
|---|---|---|---|
| Quadrant D | 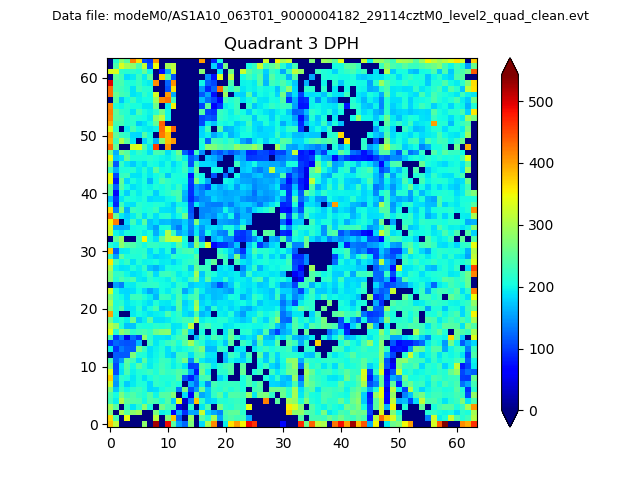 |
 |
Quadrant C |
| Plot type | Count rate plots | Images |
|---|---|---|
| Comparison with Poisson distribution Blue bars denote a histogram of data divided into 1 sec bins. Red curve is a Poisson curve with rate = median count rate of data. |
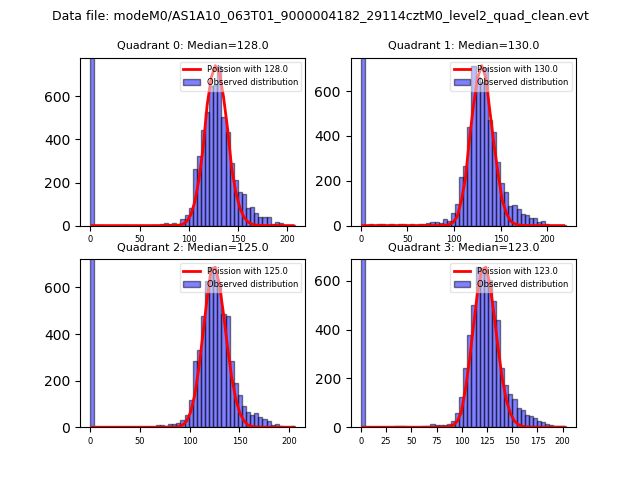 |
 |
| Quadrant-wise count rates Data is divided into 100 sec bins |
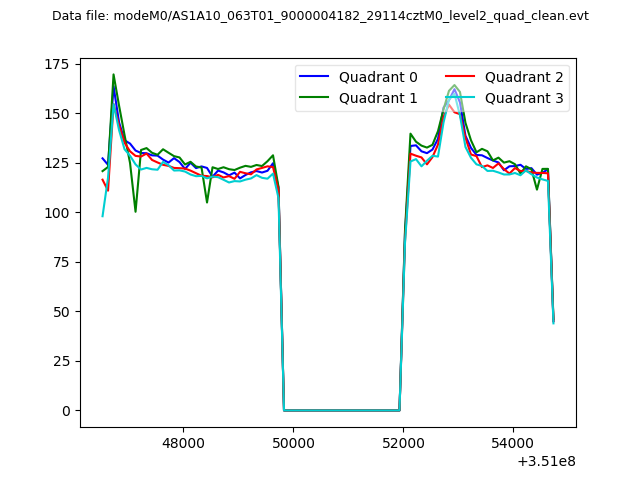 |
|
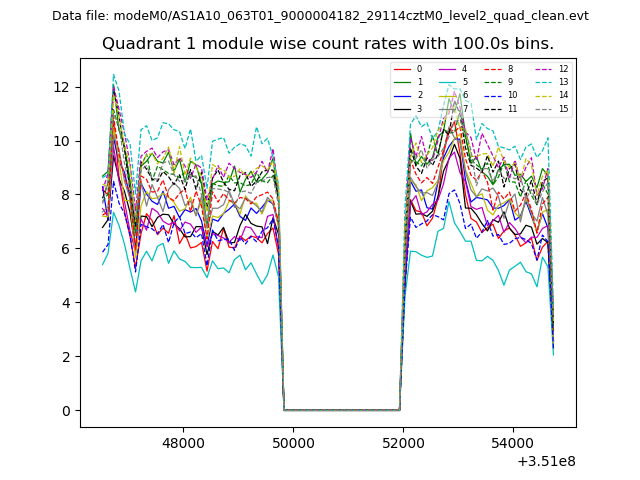
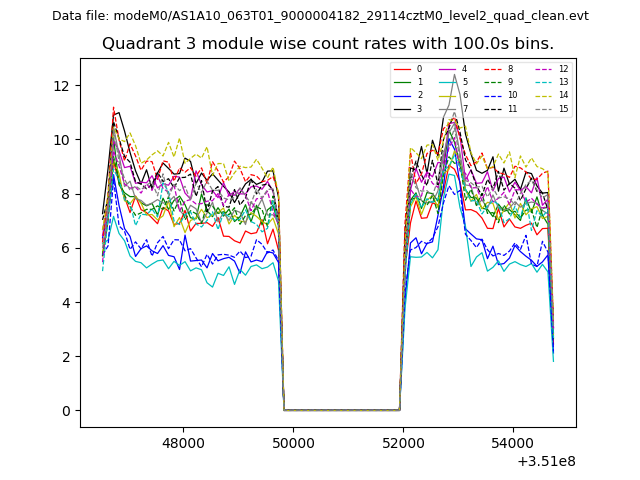
| Module-wise count rates for Quadrant A Data is divided into 100 sec bins |
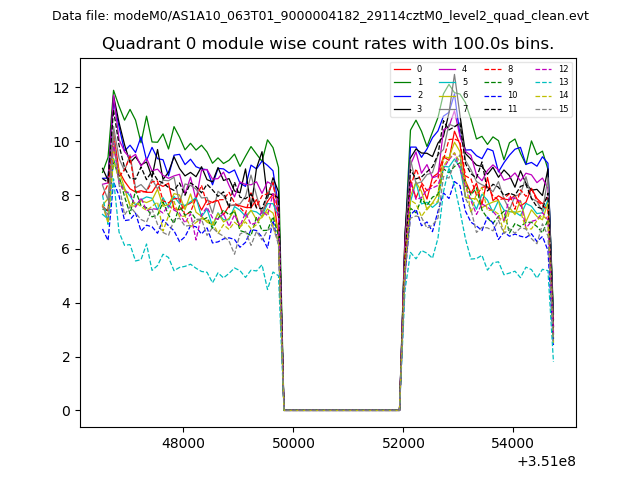 |
 |
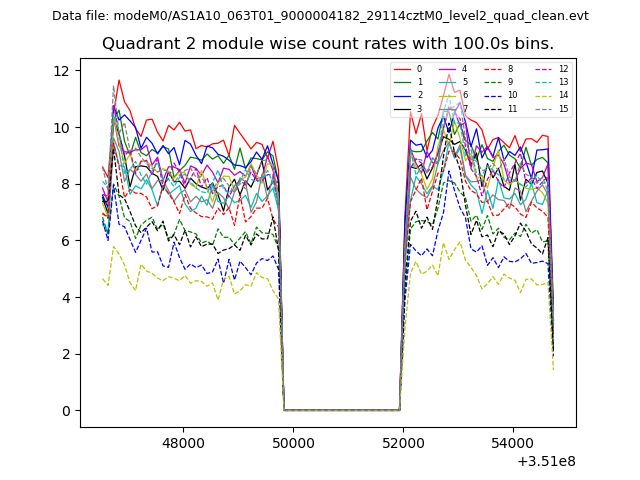
| Module-wise count rates for Quadrant B Data is divided into 100 sec bins |
 |
 |
| Module-wise count rates for Quadrant C Data is divided into 100 sec bins |
 |
 |
| Module-wise count rates for Quadrant D Data is divided into 100 sec bins |
 |
 |
| Parameter | Plot |
|---|---|
| CZT HV Monitor | 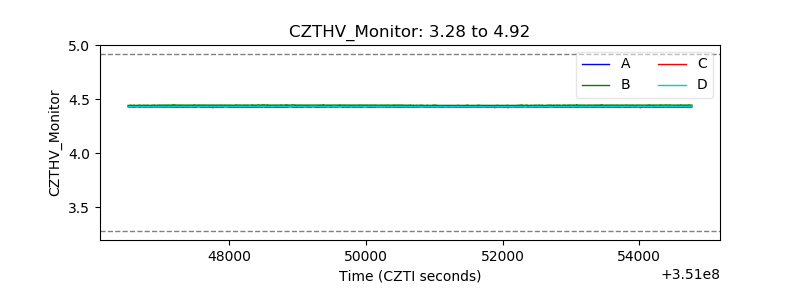 |
| D_VDD | 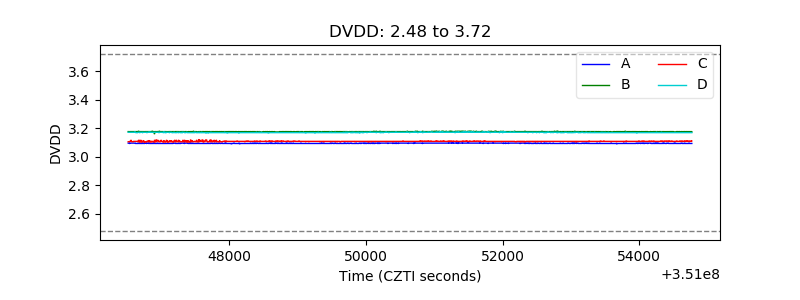 |
| Temperature 1 | 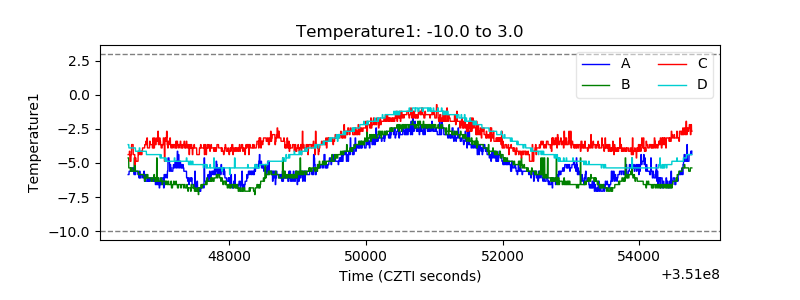 |
| Veto HV Monitor | 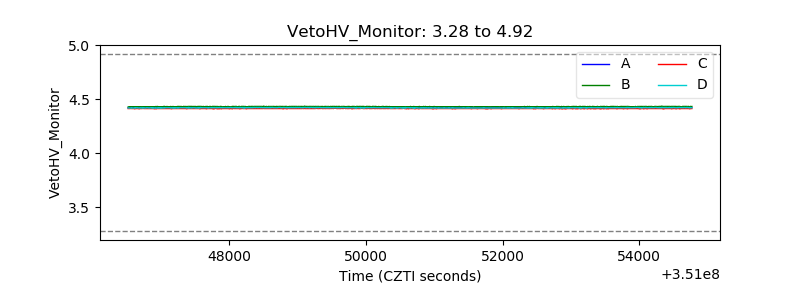 |
| Veto LLD | 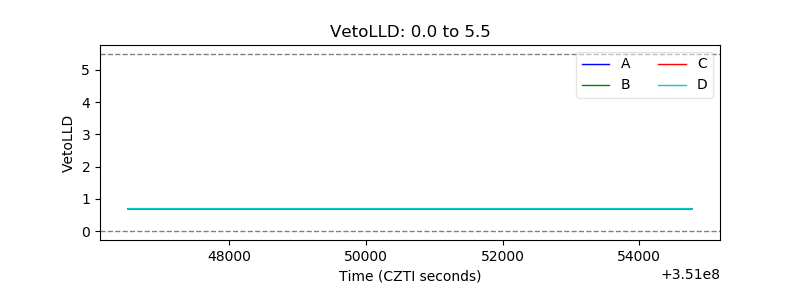 |
| Alpha Counter | 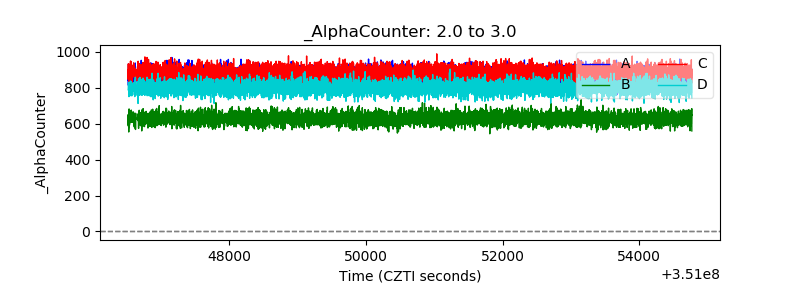 |
| _CPM_Rate | 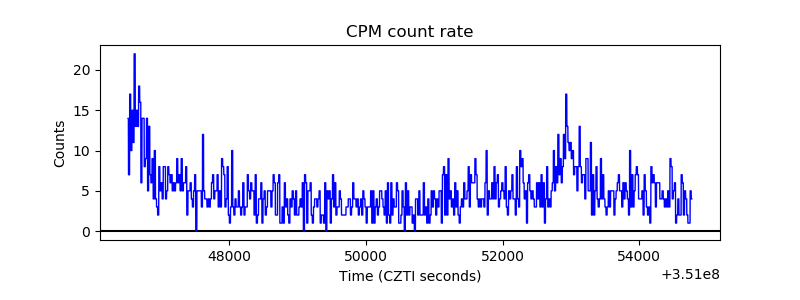 |
| CZT Counter | 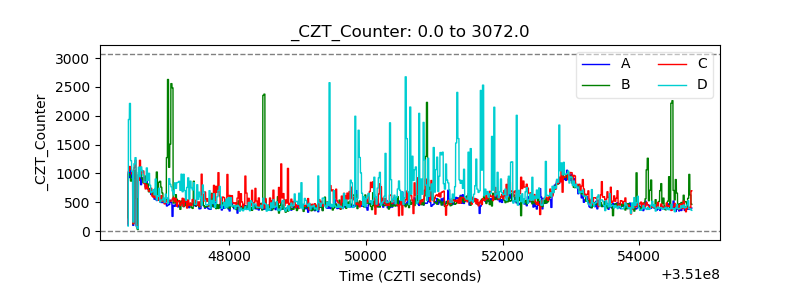 |
| +2.5 Volts monitor |  |
| +5 Volts monitor |  |
| _ROLL_ROT | 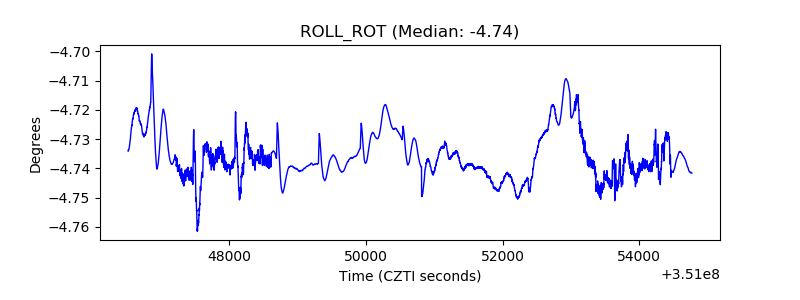 |
| _Roll_DEC | 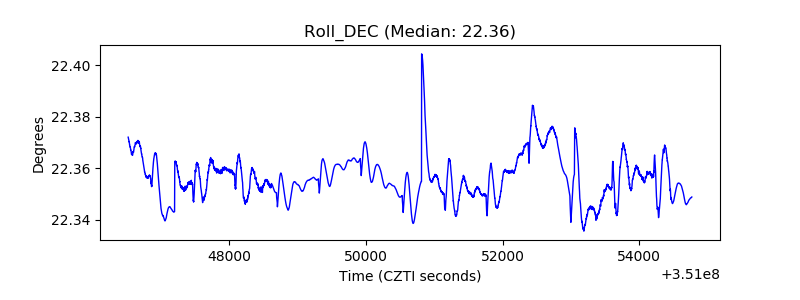 |
| _Roll_RA | 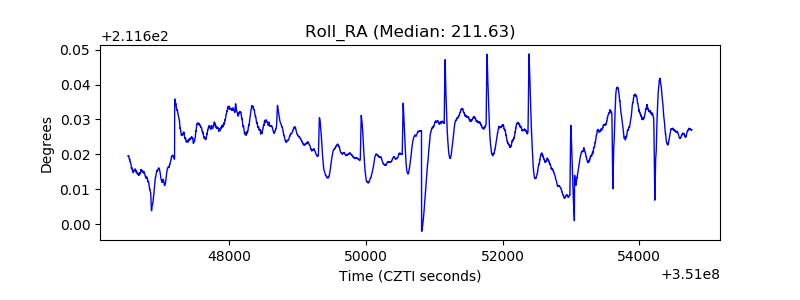 |
| Veto Counter | 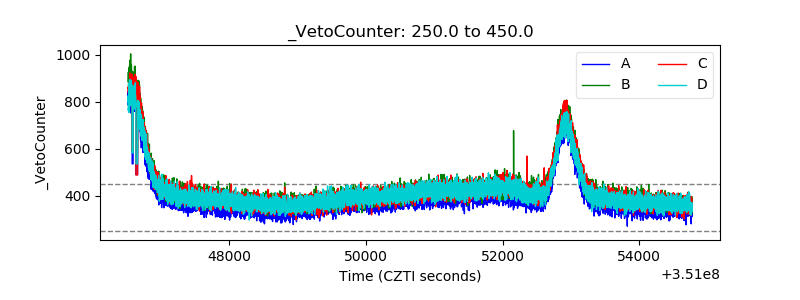 |