| Param | Original file | Final file |
|---|---|---|
| Filename | modeM0/AS1A10_063T01_9000004182_29117cztM0_level2.evt | modeM0/AS1A10_063T01_9000004182_29117cztM0_level2_quad_clean.evt |
| Size (bytes) | 1,357,024,320 | 231,926,400 |
| Size | 1.3 GB | 221.2 MB |
| Events in quadrant A | 9,235,492 | 1,446,194 |
| Events in quadrant B | 9,892,971 | 1,471,228 |
| Events in quadrant C | 9,230,937 | 1,431,830 |
| Events in quadrant D | 11,487,213 | 1,399,163 |
| Mode M0 | |||
|---|---|---|---|
| Quadrant | BADHDUFLAG | Total packets | Discarded packets |
| A | 0 | 39410 | 4 |
| B | 0 | 40896 | 3 |
| C | 0 | 38583 | 3 |
| D | 0 | 46519 | 3 |
| Mode M9 | |||
|---|---|---|---|
| Quadrant | BADHDUFLAG | Total packets | Discarded packets |
| A | 0 | 15 | 0 |
| B | 0 | 15 | 0 |
| C | 0 | 15 | 0 |
| D | 0 | 15 | 0 |
| Mode SS | |||
|---|---|---|---|
| Quadrant | BADHDUFLAG | Total packets | Discarded packets |
| A | 0 | 378 | 0 |
| B | 0 | 378 | 0 |
| C | 0 | 378 | 0 |
| D | 0 | 378 | 0 |
| Quadrant | Total seconds | Saturated seconds | Saturation percentage |
|---|---|---|---|
| A | 18510 | 431 | 2.328471% |
| B | 18511 | 328 | 1.771919% |
| C | 18511 | 228 | 1.231700% |
| D | 18511 | 487 | 2.630868% |
Noise dominated data is calculated using 1-second bins in cleaned event files. If a bin has >2000 counts, and if more than 50% of those come from <1% of pixels, then it is considered to be noise-dominated and hence unusable.
| Quadrant | # 1 sec bins | Bins with >0 counts | Bins with >2000 counts | High rate bins dominated by noise | Noise dominated (total time) | Noise dominated (detector-on time) | Marked lightcurve |
|---|---|---|---|---|---|---|---|
| A | 20055 | 18513 | 272 | 272 | 1.36% | 1.47% | 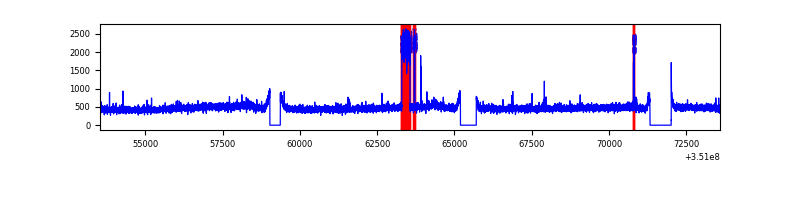 |
| B | 20056 | 18514 | 147 | 147 | 0.73% | 0.79% | 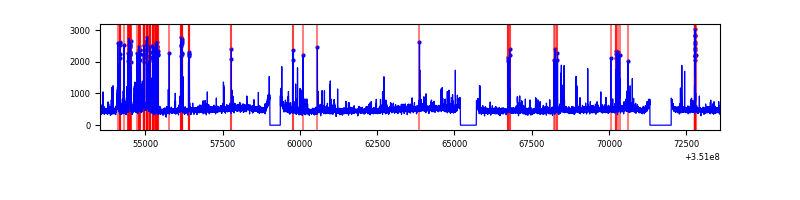 |
| C | 20056 | 18514 | 1 | 1 | 0.00% | 0.01% | 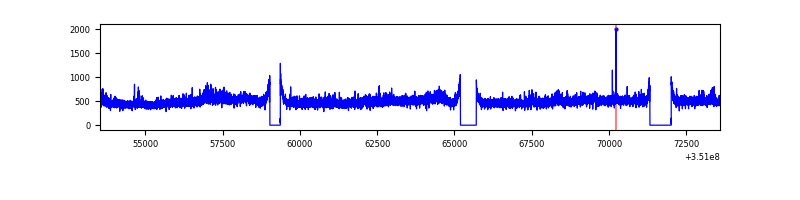 |
| D | 20056 | 18514 | 334 | 334 | 1.67% | 1.80% | 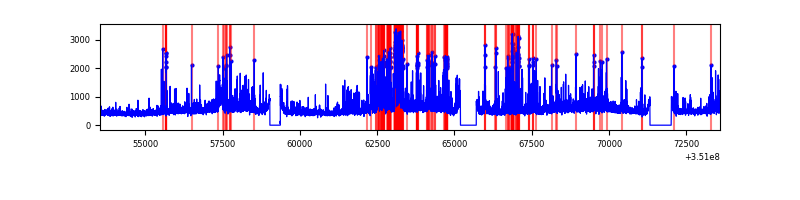 |
Top three noisy pixels from each quadrant. If the there are fewer than three noisy pixels in the level2.evt file, extra rows are filled as -1
| Pixel properties | Quadrant properties | ||||||
|---|---|---|---|---|---|---|---|
| Quadrant | DetID | PixID | Counts | Sigma | Mean | Median | Sigma |
| A | 11 | 29 | 547232 | 1217.03 | 2224 | 2181 | 447.9 |
| A | 15 | 174 | 78130 | 169.58 | 2224 | 2181 | 447.9 |
| A | 13 | 254 | 31962 | 66.5 | 2224 | 2181 | 447.9 |
| B | 10 | 245 | 806320 | 1910.16 | 2211 | 2152 | 421.0 |
| B | 10 | 246 | 301070 | 710.03 | 2211 | 2152 | 421.0 |
| B | 12 | 111 | 53646 | 122.31 | 2211 | 2152 | 421.0 |
| C | 3 | 233 | 469156 | 928.67 | 2143 | 2154 | 502.9 |
| C | 14 | 238 | 343519 | 678.83 | 2143 | 2154 | 502.9 |
| C | 2 | 114 | 43753 | 82.72 | 2143 | 2154 | 502.9 |
| D | 1 | 52 | 2306936 | 4519.63 | 2141 | 2082 | 510.0 |
| D | 8 | 195 | 901540 | 1763.76 | 2141 | 2082 | 510.0 |
| D | 2 | 234 | 78632 | 150.11 | 2141 | 2082 | 510.0 |
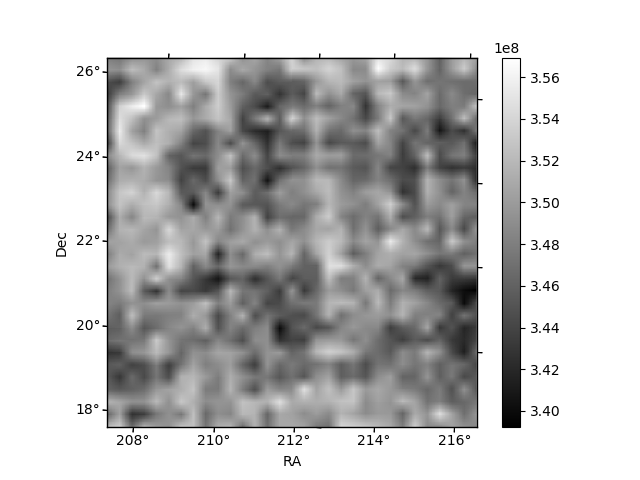
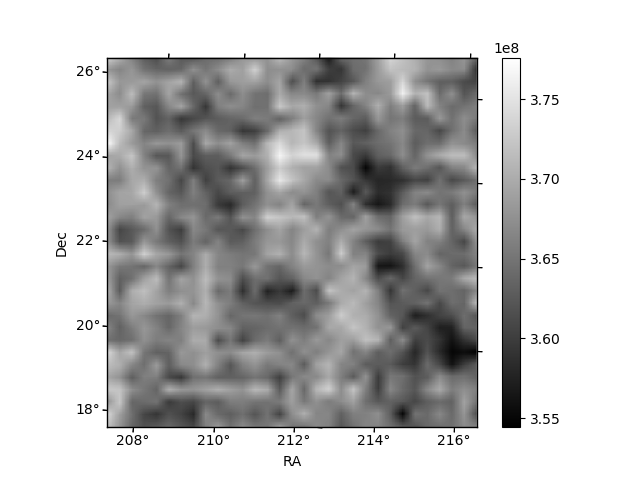
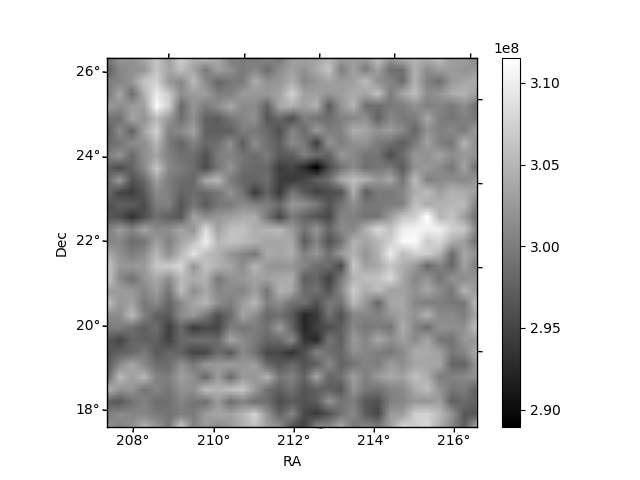
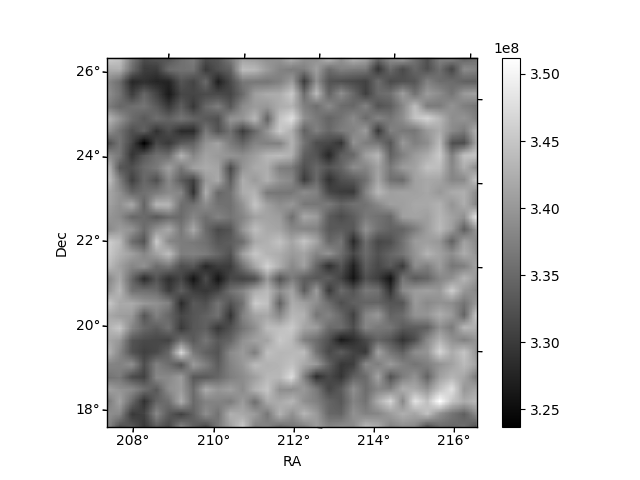
Histogram calculated using DETX and DETY for each event in the final _common_clean file
| Quadrant A | 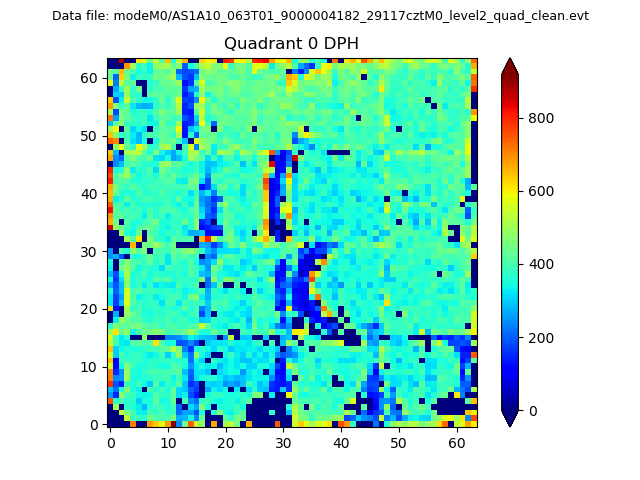 |
 |
Quadrant B |
|---|---|---|---|
| Quadrant D | 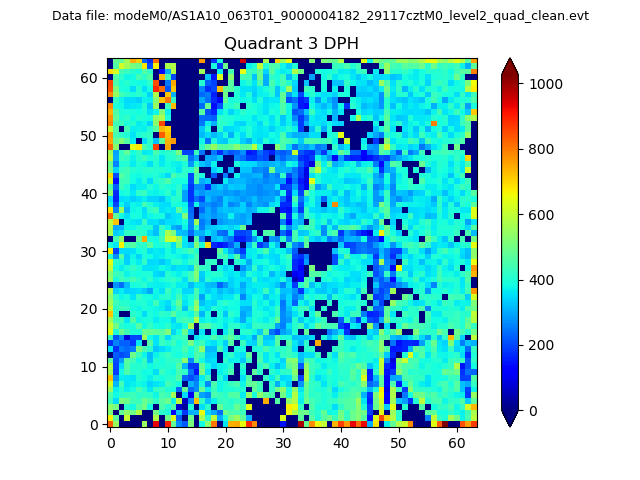 |
 |
Quadrant C |
| Plot type | Count rate plots | Images |
|---|---|---|
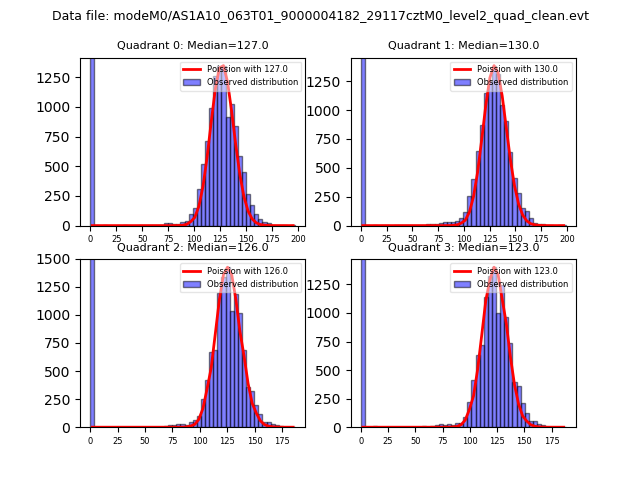
| Comparison with Poisson distribution Blue bars denote a histogram of data divided into 1 sec bins. Red curve is a Poisson curve with rate = median count rate of data. |
 |
 |
| Quadrant-wise count rates Data is divided into 100 sec bins |
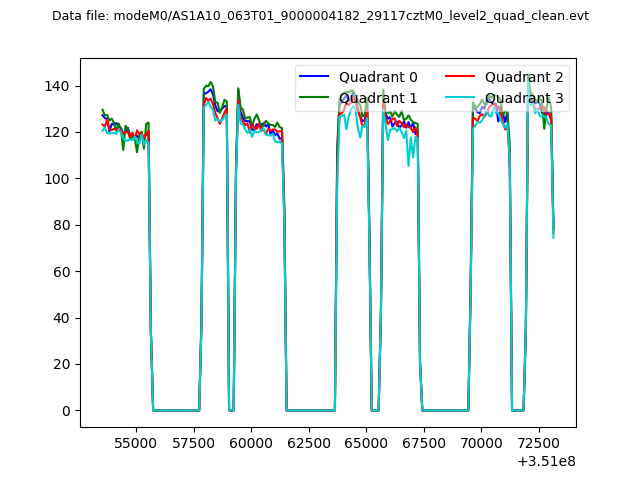 |
|
| Module-wise count rates for Quadrant A Data is divided into 100 sec bins |
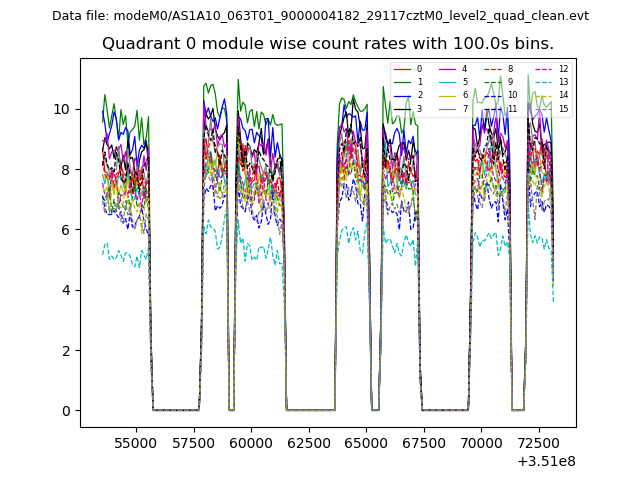 |
 |
| Module-wise count rates for Quadrant B Data is divided into 100 sec bins |
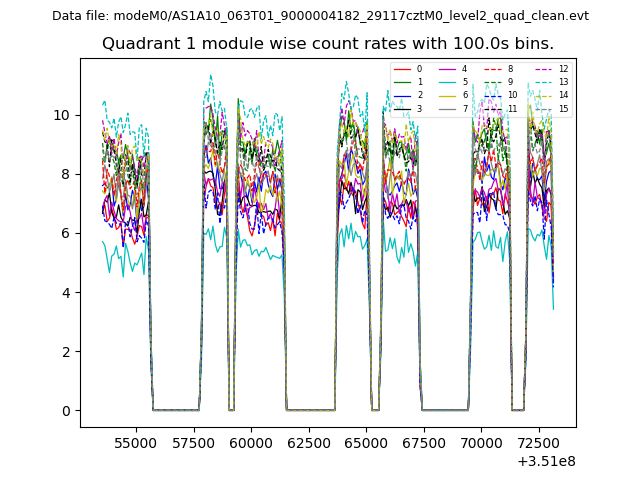 |
 |
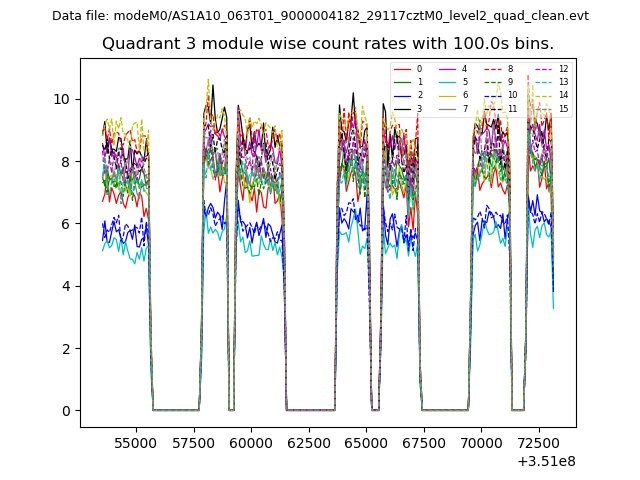
| Module-wise count rates for Quadrant C Data is divided into 100 sec bins |
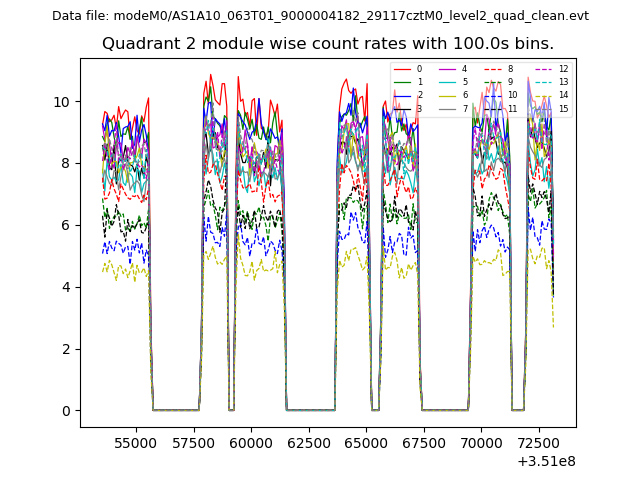 |
 |
| Module-wise count rates for Quadrant D Data is divided into 100 sec bins |
 |
 |
| Parameter | Plot |
|---|---|
| CZT HV Monitor | 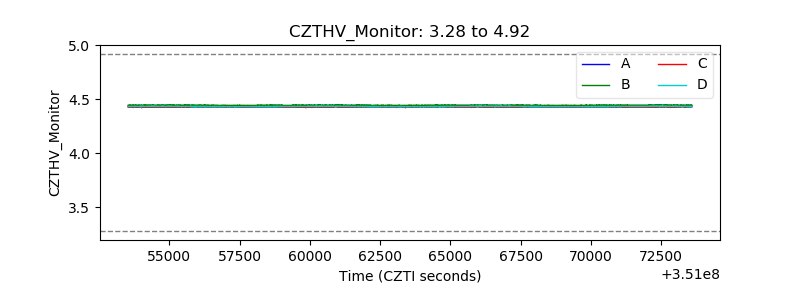 |
| D_VDD | 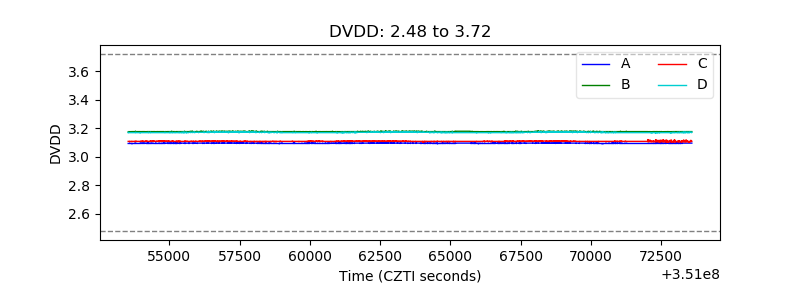 |
| Temperature 1 | 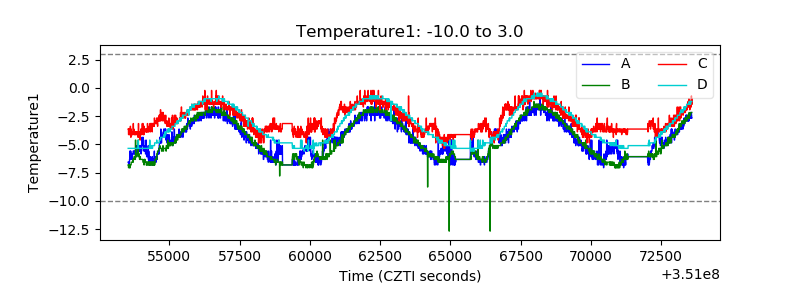 |
| Veto HV Monitor | 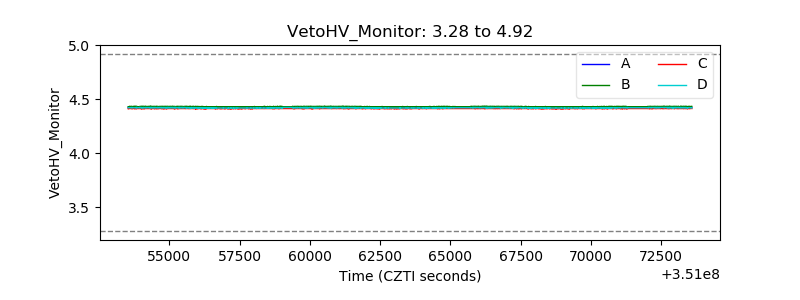 |
| Veto LLD | 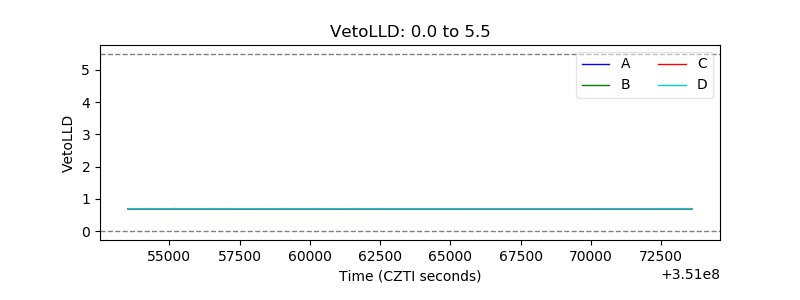 |
| Alpha Counter |  |
| _CPM_Rate | 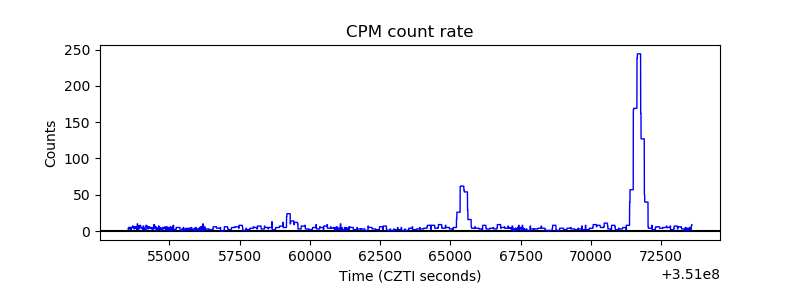 |
| CZT Counter | 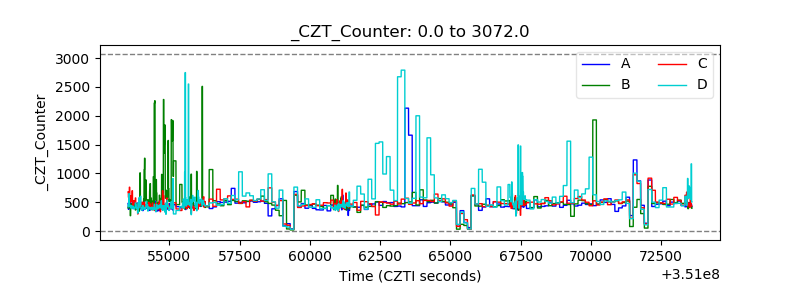 |
| +2.5 Volts monitor |  |
| +5 Volts monitor |  |
| _ROLL_ROT | 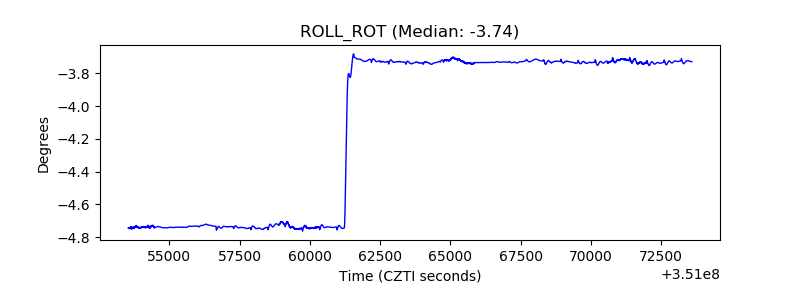 |
| _Roll_DEC | 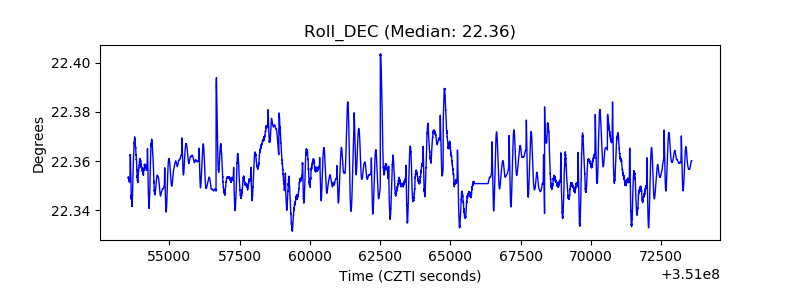 |
| _Roll_RA | 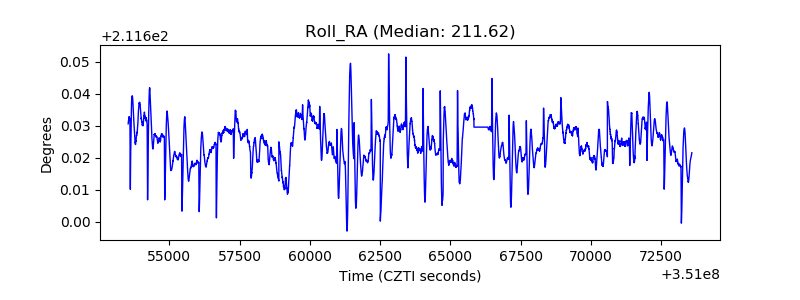 |
| Veto Counter | 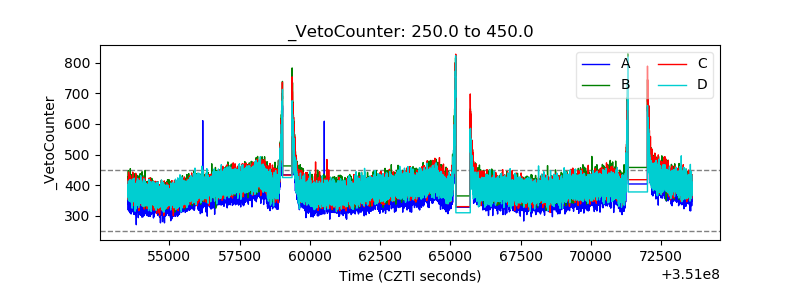 |