| Param | Original file | Final file |
|---|---|---|
| Filename | modeM0/AS1A10_063T01_9000004182_29118cztM0_level2.evt | modeM0/AS1A10_063T01_9000004182_29118cztM0_level2_quad_clean.evt |
| Size (bytes) | 499,129,920 | 77,834,880 |
| Size | 476.0 MB | 74.2 MB |
| Events in quadrant A | 3,188,125 | 477,806 |
| Events in quadrant B | 3,294,604 | 488,447 |
| Events in quadrant C | 3,546,548 | 470,726 |
| Events in quadrant D | 4,639,284 | 459,983 |
| Mode M0 | |||
|---|---|---|---|
| Quadrant | BADHDUFLAG | Total packets | Discarded packets |
| A | 0 | 13521 | 2 |
| B | 0 | 13723 | 1 |
| C | 0 | 14350 | 1 |
| D | 0 | 17987 | 1 |
| Mode M9 | |||
|---|---|---|---|
| Quadrant | BADHDUFLAG | Total packets | Discarded packets |
| A | 0 | 9 | 0 |
| B | 0 | 9 | 0 |
| C | 0 | 9 | 0 |
| D | 0 | 9 | 0 |
| Mode SS | |||
|---|---|---|---|
| Quadrant | BADHDUFLAG | Total packets | Discarded packets |
| A | 0 | 134 | 0 |
| B | 0 | 134 | 0 |
| C | 0 | 134 | 0 |
| D | 0 | 134 | 0 |
| Quadrant | Total seconds | Saturated seconds | Saturation percentage |
|---|---|---|---|
| A | 6597 | 51 | 0.773079% |
| B | 6597 | 65 | 0.985296% |
| C | 6597 | 66 | 1.000455% |
| D | 6597 | 286 | 4.335304% |
Noise dominated data is calculated using 1-second bins in cleaned event files. If a bin has >2000 counts, and if more than 50% of those come from <1% of pixels, then it is considered to be noise-dominated and hence unusable.
| Quadrant | # 1 sec bins | Bins with >0 counts | Bins with >2000 counts | High rate bins dominated by noise | Noise dominated (total time) | Noise dominated (detector-on time) | Marked lightcurve |
|---|---|---|---|---|---|---|---|
| A | 7492 | 6598 | 2 | 2 | 0.03% | 0.03% | 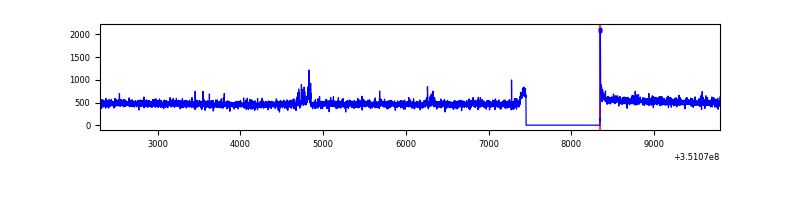 |
| B | 7492 | 6598 | 13 | 13 | 0.17% | 0.20% | 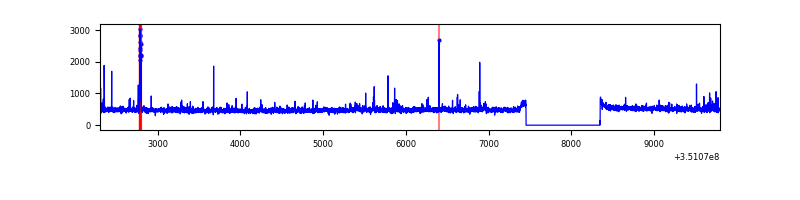 |
| C | 7492 | 6598 | 0 | 0 | 0.00% | 0.00% | 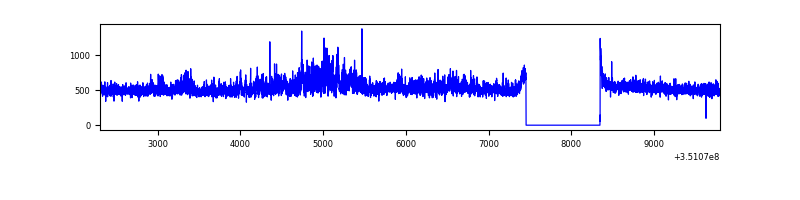 |
| D | 7492 | 6598 | 239 | 239 | 3.19% | 3.62% | 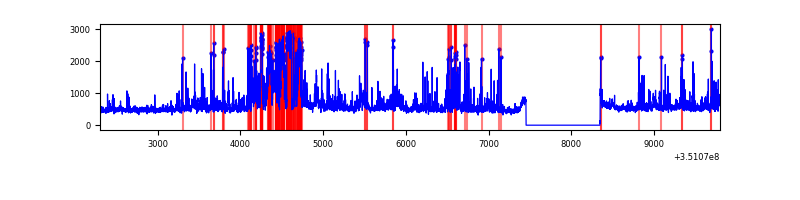 |
Top three noisy pixels from each quadrant. If the there are fewer than three noisy pixels in the level2.evt file, extra rows are filled as -1
| Pixel properties | Quadrant properties | ||||||
|---|---|---|---|---|---|---|---|
| Quadrant | DetID | PixID | Counts | Sigma | Mean | Median | Sigma |
| A | 6 | 16 | 27991 | 164.76 | 815 | 799 | 165.0 |
| A | 13 | 254 | 11340 | 63.87 | 815 | 799 | 165.0 |
| A | 15 | 174 | 9263 | 51.29 | 815 | 799 | 165.0 |
| B | 10 | 246 | 51178 | 324.23 | 805 | 783 | 155.4 |
| B | 10 | 245 | 40753 | 257.16 | 805 | 783 | 155.4 |
| B | 0 | 230 | 20102 | 124.3 | 805 | 783 | 155.4 |
| C | 3 | 233 | 350993 | 1904.18 | 778 | 782 | 183.9 |
| C | 14 | 238 | 125339 | 677.25 | 778 | 782 | 183.9 |
| C | 2 | 114 | 15828 | 81.81 | 778 | 782 | 183.9 |
| D | 1 | 52 | 1218033 | 6611.51 | 777 | 755 | 184.1 |
| D | 8 | 195 | 390301 | 2115.78 | 777 | 755 | 184.1 |
| D | 12 | 233 | 30686 | 162.57 | 777 | 755 | 184.1 |
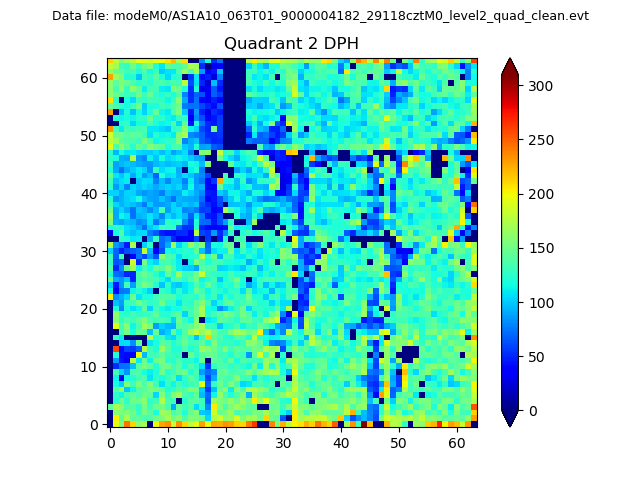
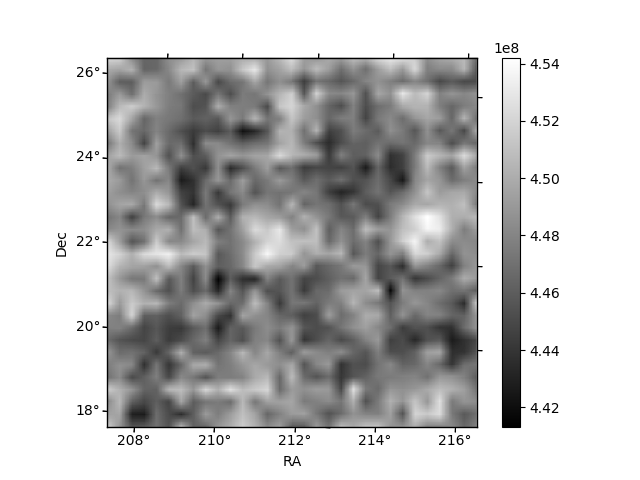
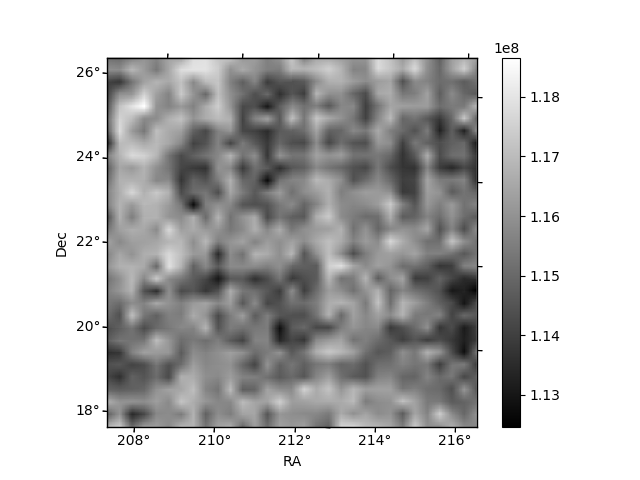
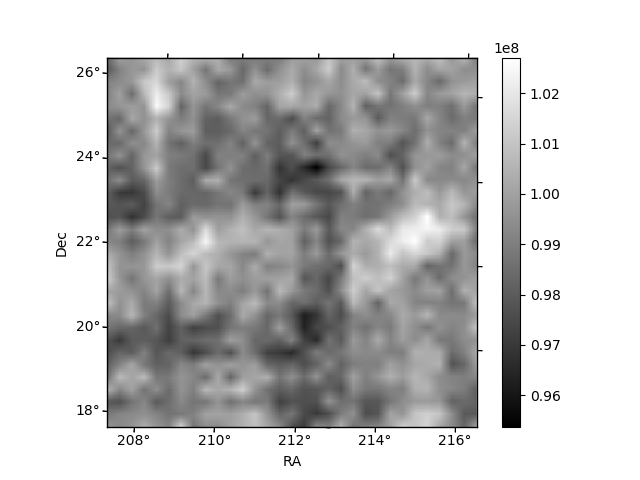
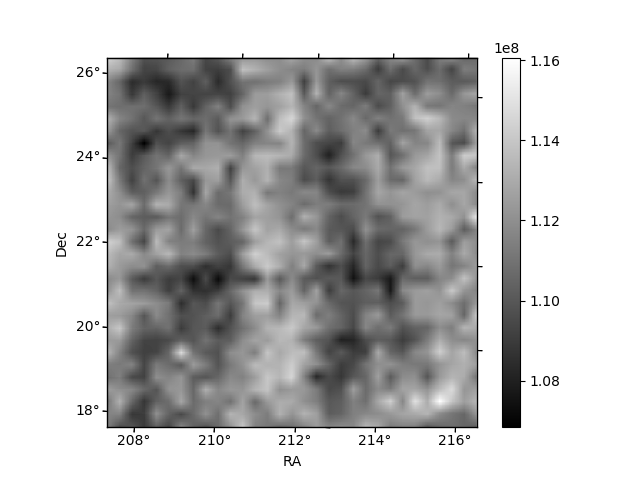
Histogram calculated using DETX and DETY for each event in the final _common_clean file
| Quadrant A | 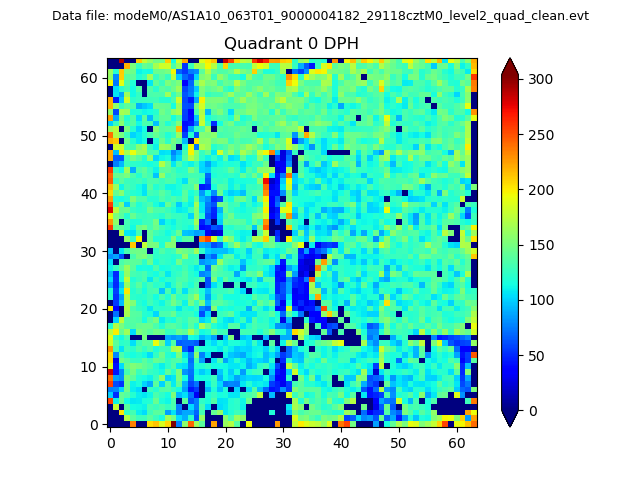 |
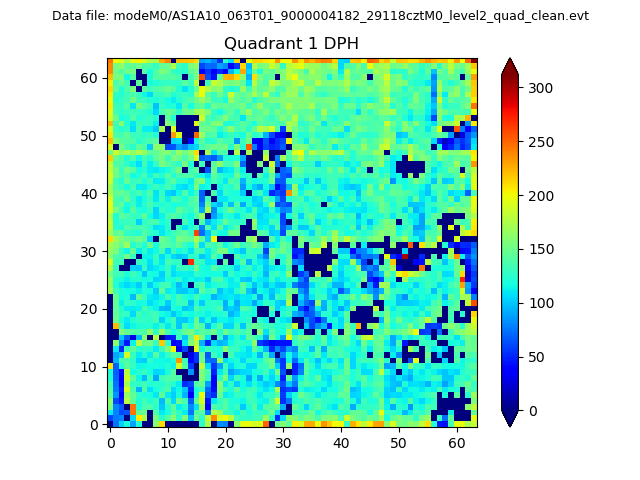 |
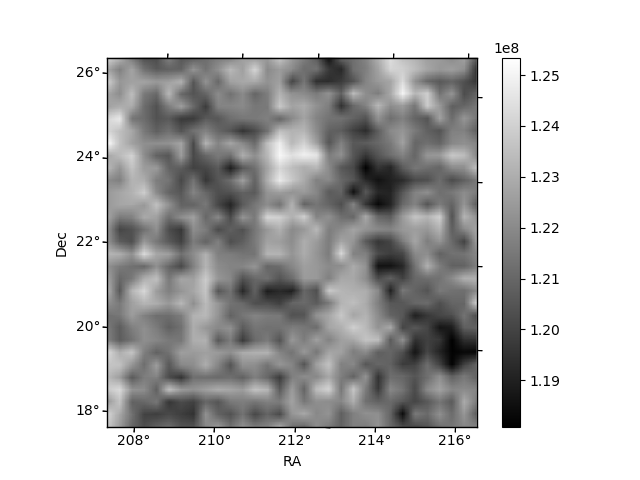
Quadrant B |
|---|---|---|---|
| Quadrant D | 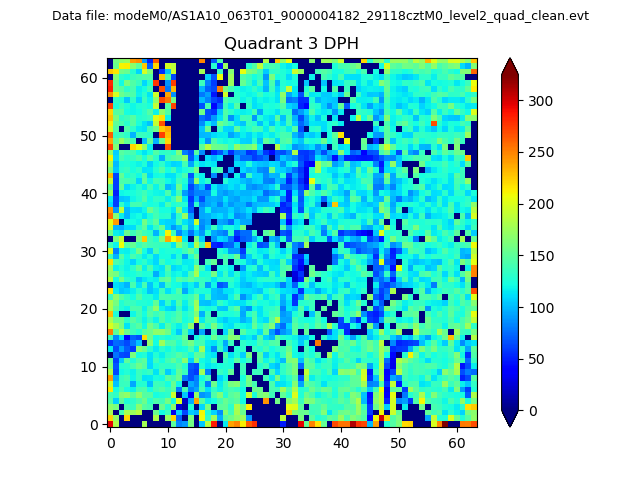 |
 |
Quadrant C |
| Plot type | Count rate plots | Images |
|---|---|---|
| Comparison with Poisson distribution Blue bars denote a histogram of data divided into 1 sec bins. Red curve is a Poisson curve with rate = median count rate of data. |
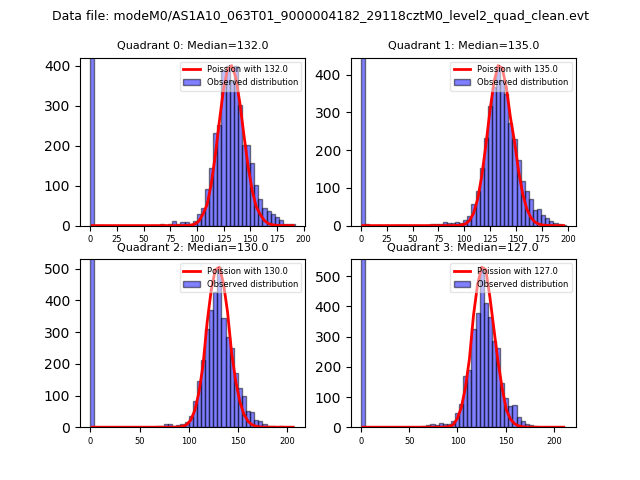 |
 |
| Quadrant-wise count rates Data is divided into 100 sec bins |
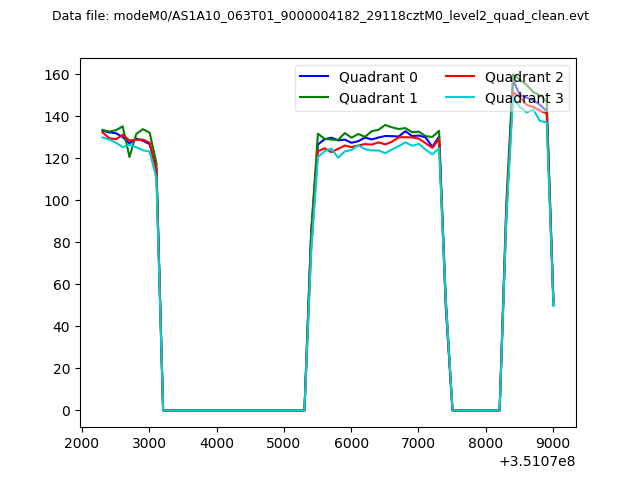 |
|
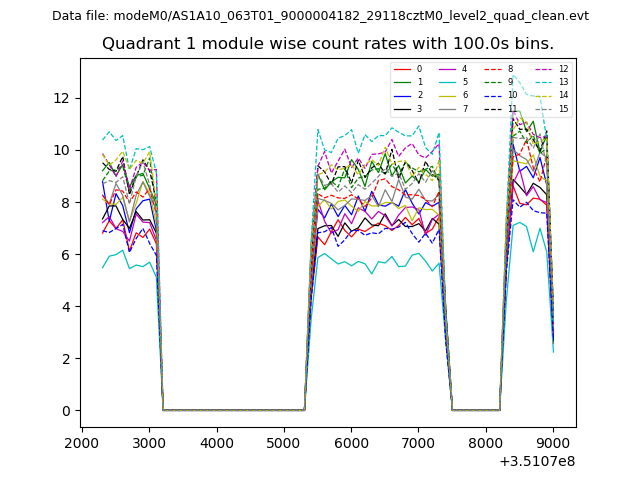
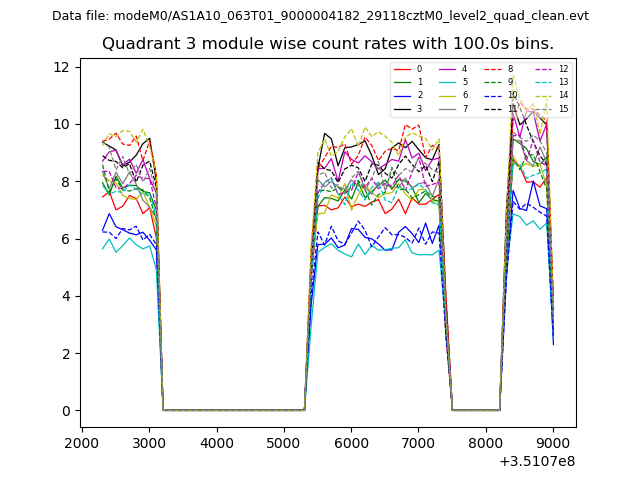
| Module-wise count rates for Quadrant A Data is divided into 100 sec bins |
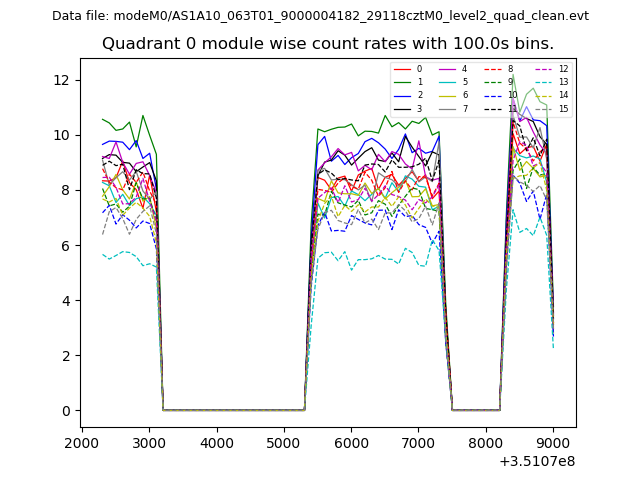 |
 |
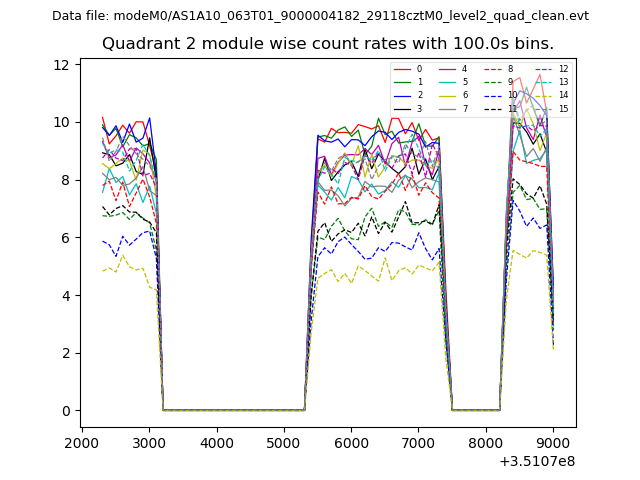
| Module-wise count rates for Quadrant B Data is divided into 100 sec bins |
 |
 |
| Module-wise count rates for Quadrant C Data is divided into 100 sec bins |
 |
 |
| Module-wise count rates for Quadrant D Data is divided into 100 sec bins |
 |
 |
| Parameter | Plot |
|---|---|
| CZT HV Monitor | 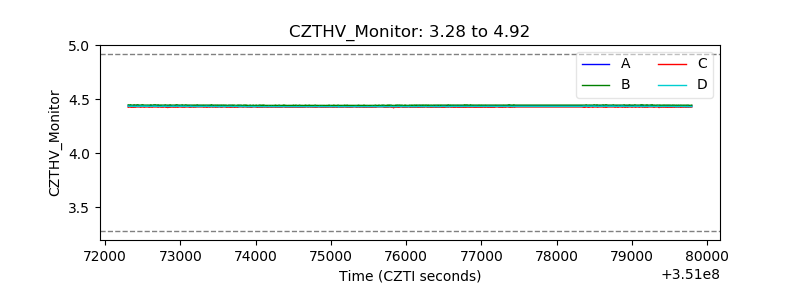 |
| D_VDD | 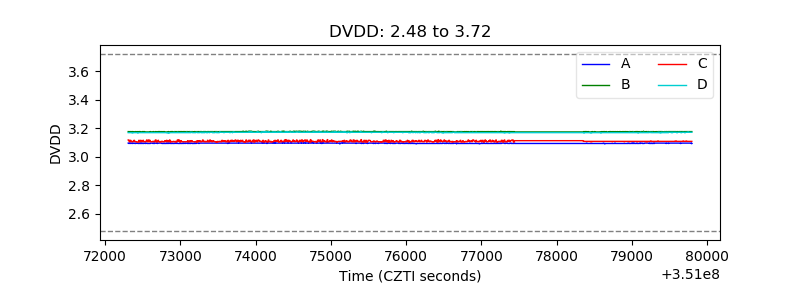 |
| Temperature 1 | 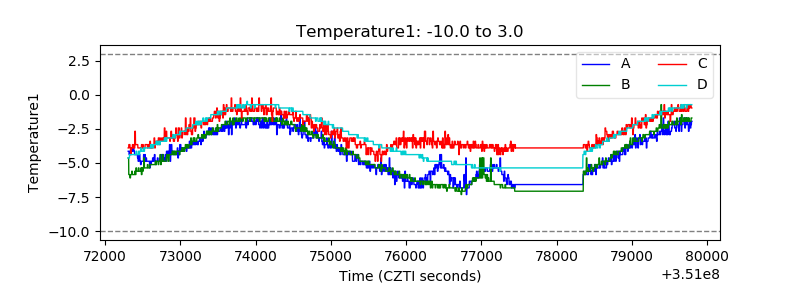 |
| Veto HV Monitor | 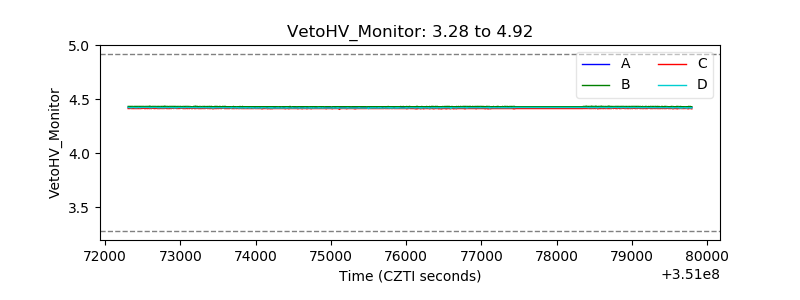 |
| Veto LLD | 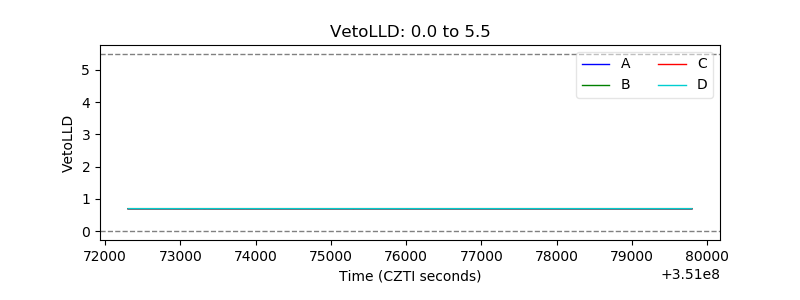 |
| Alpha Counter | 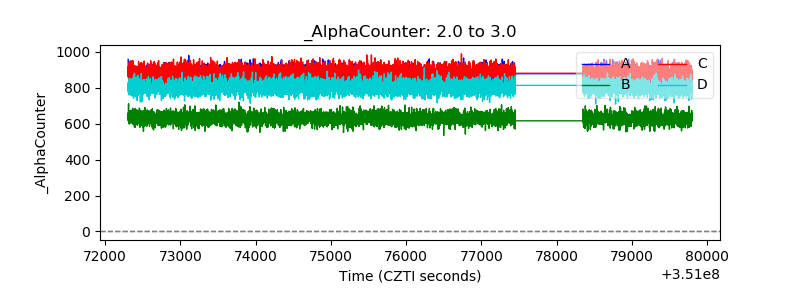 |
| _CPM_Rate | 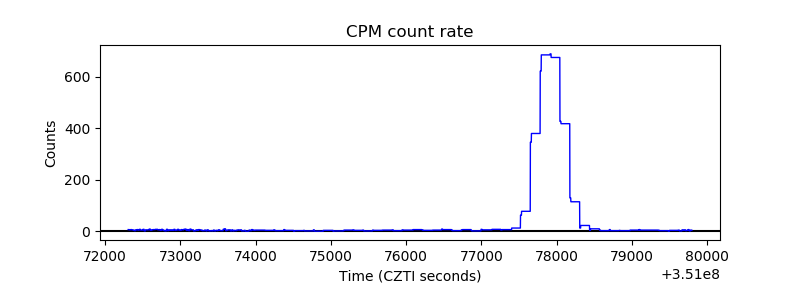 |
| CZT Counter | 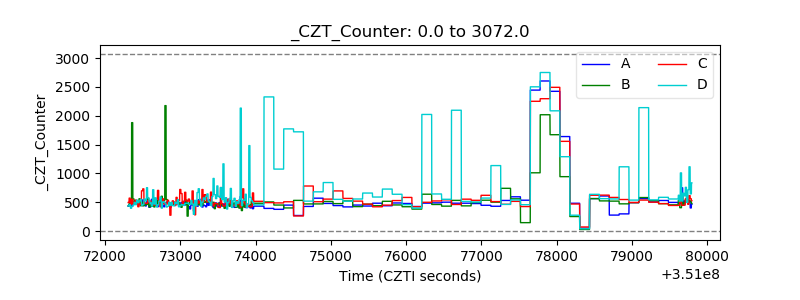 |
| +2.5 Volts monitor |  |
| +5 Volts monitor |  |
| _ROLL_ROT | 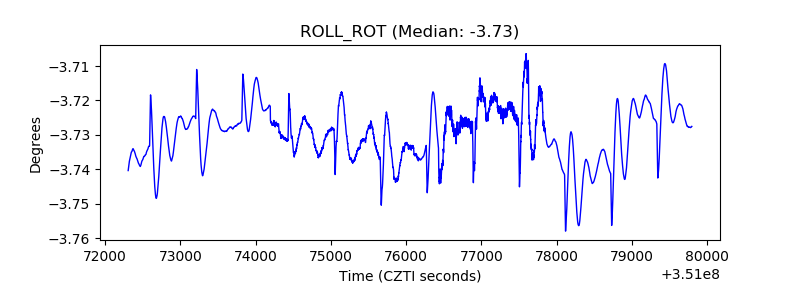 |
| _Roll_DEC | 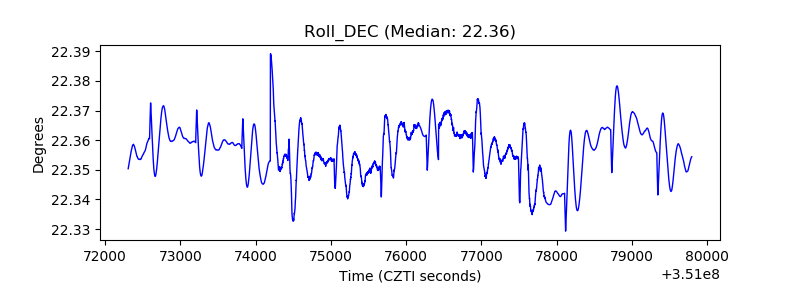 |
| _Roll_RA | 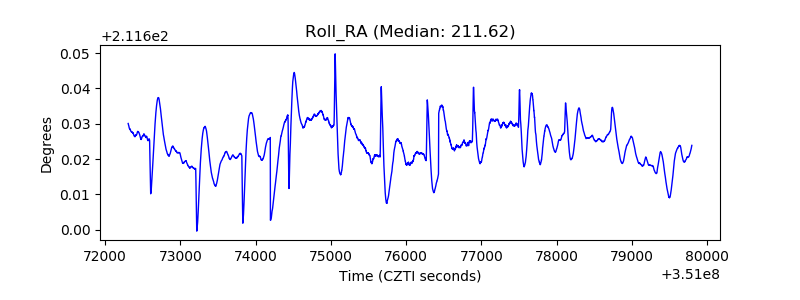 |
| Veto Counter | 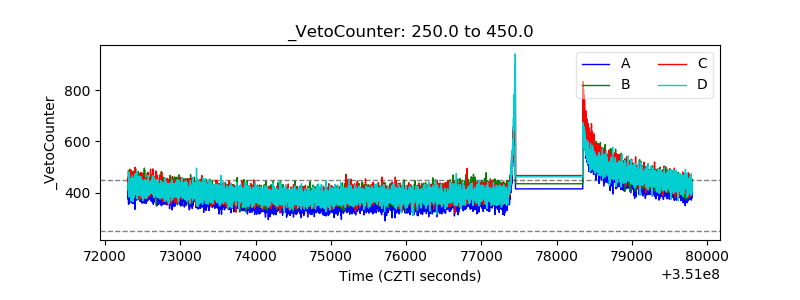 |