| Param | Original file | Final file |
|---|---|---|
| Filename | modeM0/AS1T03_275T01_9000004180cztM0_level2.fits | modeM0/AS1T03_275T01_9000004180cztM0_level2_quad_clean.evt |
| Size (bytes) | 617,950,080 | 503,452,800 |
| Size | 589.3 MB | 480.1 MB |
| Events in quadrant A | 3,899,306 | 2,934,790 |
| Events in quadrant B | 3,716,146 | 2,932,007 |
| Events in quadrant C | 3,706,972 | 2,744,385 |
| Events in quadrant D | 3,196,778 | 2,439,541 |
| Mode M9 | |||
|---|---|---|---|
| Quadrant | BADHDUFLAG | Total packets | Discarded packets |
| A | 0 | 90 | 0 |
| B | 0 | 90 | 0 |
| C | 0 | 90 | 0 |
| D | 0 | 90 | 0 |
| Mode M0 | |||
|---|---|---|---|
| Quadrant | BADHDUFLAG | Total packets | Discarded packets |
| A | 0 | 128274 | 0 |
| B | 0 | 134962 | 0 |
| C | 0 | 136977 | 0 |
| D | 0 | 195148 | 0 |
| Mode SS | |||
|---|---|---|---|
| Quadrant | BADHDUFLAG | Total packets | Discarded packets |
| A | 0 | 1248 | 0 |
| B | 0 | 1248 | 0 |
| C | 0 | 1248 | 0 |
| D | 0 | 1248 | 0 |
| Quadrant | Total seconds | Saturated seconds | Saturation percentage |
|---|---|---|---|
| A | 61144 | 540 | 0.883161% |
| B | 61144 | 1064 | 1.740154% |
| C | 61144 | 1055 | 1.725435% |
| D | 61144 | 3764 | 6.155960% |
Noise dominated data is calculated using 1-second bins in cleaned event files. If a bin has >2000 counts, and if more than 50% of those come from <1% of pixels, then it is considered to be noise-dominated and hence unusable.
| Quadrant | # 1 sec bins | Bins with >0 counts | Bins with >2000 counts | High rate bins dominated by noise | Noise dominated (total time) | Noise dominated (detector-on time) | Marked lightcurve |
|---|---|---|---|---|---|---|---|
| A | 70298 | 61133 | 0 | 0 | 0.00% | 0.00% |  |
| B | 70298 | 61128 | 0 | 0 | 0.00% | 0.00% | 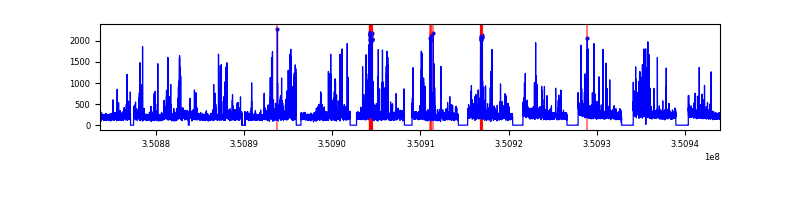 |
| C | 70298 | 61131 | 0 | 0 | 0.00% | 0.00% |  |
| D | 70298 | 61104 | 0 | 0 | 0.00% | 0.00% |  |
Top three noisy pixels from each quadrant. If the there are fewer than three noisy pixels in the level2.evt file, extra rows are filled as -1
| Pixel properties | Quadrant properties | ||||||
|---|---|---|---|---|---|---|---|
| Quadrant | DetID | PixID | Counts | Sigma | Mean | Median | Sigma |
| A | 0 | 29 | 3175 | 8.96 | 1017 | 961 | 247.0 |
| A | 7 | 110 | 3118 | 8.73 | 1017 | 961 | 247.0 |
| A | 9 | 19 | 2957 | 8.08 | 1017 | 961 | 247.0 |
| B | 2 | 9 | 2913 | 10.38 | 984 | 945 | 189.5 |
| B | 2 | 8 | 2545 | 8.44 | 984 | 945 | 189.5 |
| B | 5 | 128 | 2447 | 7.92 | 984 | 945 | 189.5 |
| C | 12 | 241 | 2643 | 6.88 | 981 | 923 | 250.0 |
| C | 9 | 209 | 2525 | 6.41 | 981 | 923 | 250.0 |
| C | 3 | 187 | 2487 | 6.25 | 981 | 923 | 250.0 |
| D | 15 | 46 | 2431 | 6.58 | 913 | 834 | 242.7 |
| D | 10 | 189 | 2259 | 5.87 | 913 | 834 | 242.7 |
| D | 6 | 67 | 2253 | 5.85 | 913 | 834 | 242.7 |
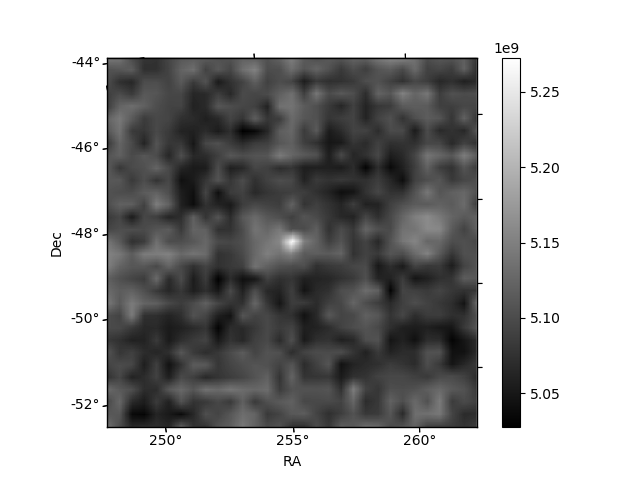
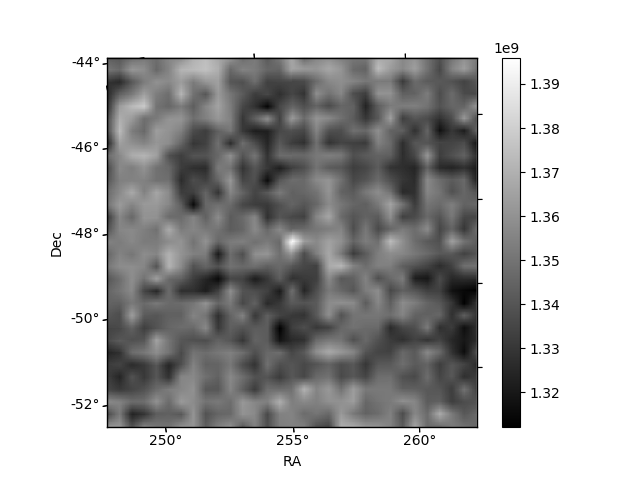
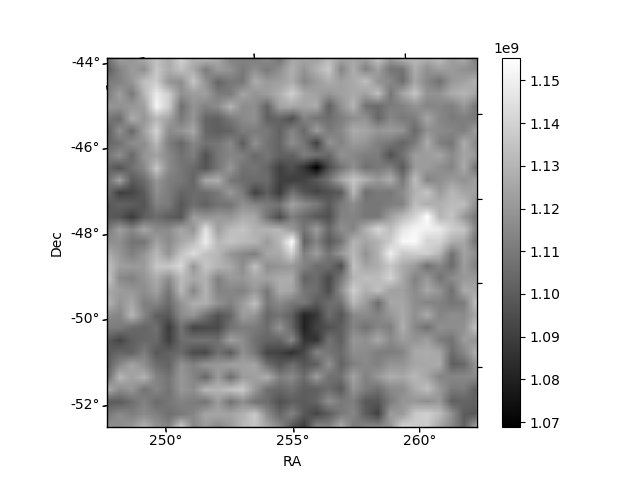
Histogram calculated using DETX and DETY for each event in the final _common_clean file
| Quadrant A | 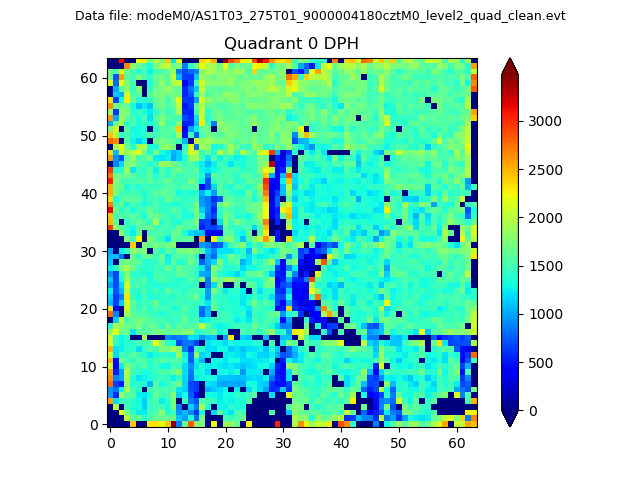 |
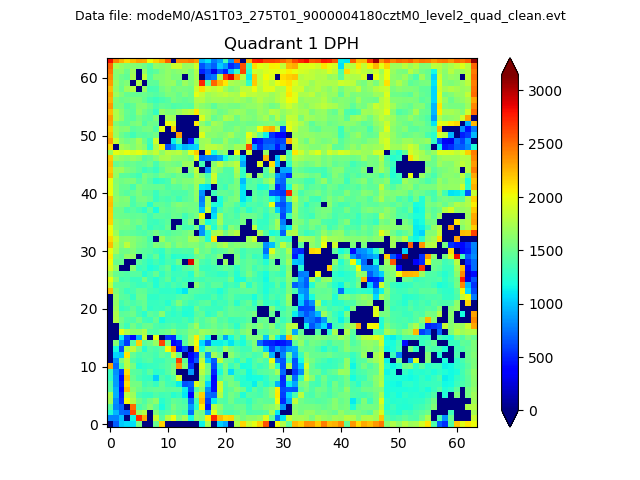 |
Quadrant B |
|---|---|---|---|
| Quadrant D | 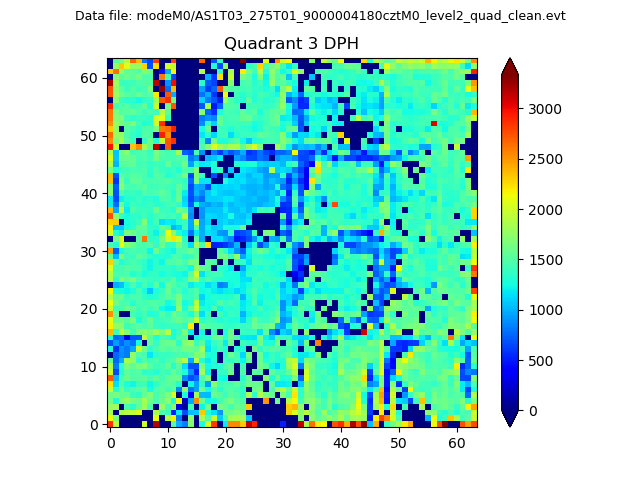 |
 |
Quadrant C |
| Plot type | Count rate plots | Images |
|---|---|---|
| Comparison with Poisson distribution Blue bars denote a histogram of data divided into 1 sec bins. Red curve is a Poisson curve with rate = median count rate of data. |
 |
 |
| Quadrant-wise count rates Data is divided into 100 sec bins |
 |
|
| Module-wise count rates for Quadrant A Data is divided into 100 sec bins |
 |
 |
| Module-wise count rates for Quadrant B Data is divided into 100 sec bins |
 |
 |
| Module-wise count rates for Quadrant C Data is divided into 100 sec bins |
 |
 |
| Module-wise count rates for Quadrant D Data is divided into 100 sec bins |
 |
 |
| Parameter | Plot |
|---|---|
| CZT HV Monitor | 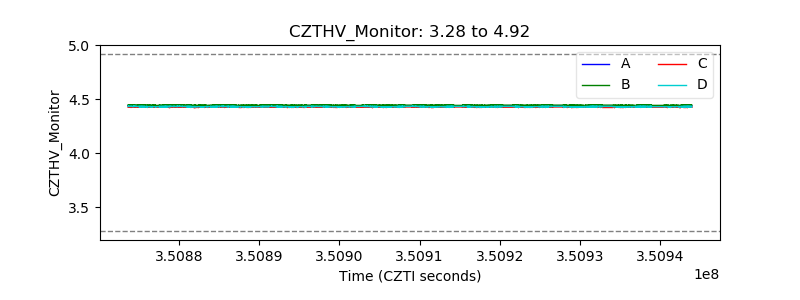 |
| D_VDD | 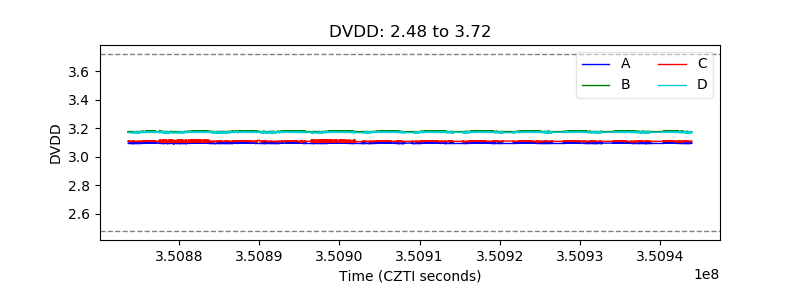 |
| Temperature 1 | 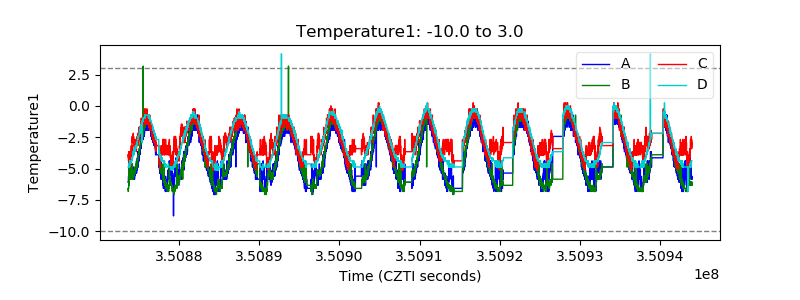 |
| Veto HV Monitor |  |
| Veto LLD |  |
| Alpha Counter |  |
| _CPM_Rate | 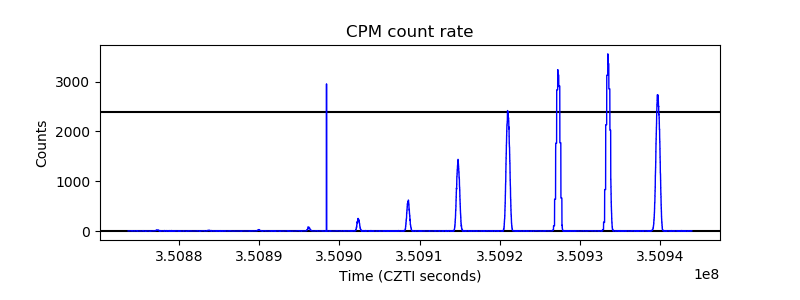 |
| CZT Counter |  |
| +2.5 Volts monitor |  |
| +5 Volts monitor | 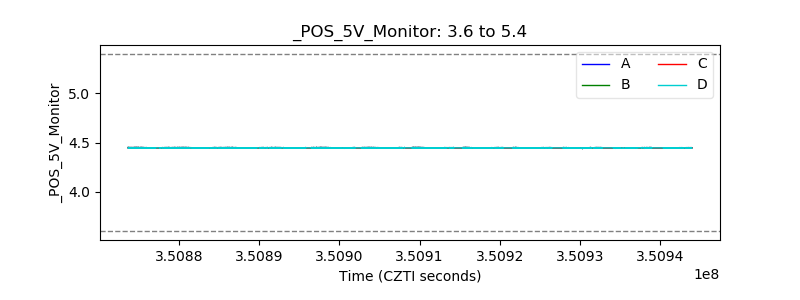 |
| _ROLL_ROT |  |
| _Roll_DEC |  |
| _Roll_RA |  |
| Veto Counter |  |