| Param | Original file | Final file |
|---|---|---|
| Filename | modeM0/AS1T03_275T01_9000004180_29084cztM0_level2.evt | modeM0/AS1T03_275T01_9000004180_29084cztM0_level2_quad_clean.evt |
| Size (bytes) | 392,984,640 | 70,611,840 |
| Size | 374.8 MB | 67.3 MB |
| Events in quadrant A | 2,409,770 | 457,331 |
| Events in quadrant B | 2,502,922 | 464,596 |
| Events in quadrant C | 2,459,848 | 442,032 |
| Events in quadrant D | 4,186,680 | 421,348 |
| Mode M9 | |||
|---|---|---|---|
| Quadrant | BADHDUFLAG | Total packets | Discarded packets |
| A | 0 | 3 | 0 |
| B | 0 | 3 | 0 |
| C | 0 | 3 | 0 |
| D | 0 | 3 | 0 |
| Mode M0 | |||
|---|---|---|---|
| Quadrant | BADHDUFLAG | Total packets | Discarded packets |
| A | 0 | 10304 | 1 |
| B | 0 | 10549 | 1 |
| C | 0 | 10342 | 1 |
| D | 0 | 15852 | 1 |
| Mode SS | |||
|---|---|---|---|
| Quadrant | BADHDUFLAG | Total packets | Discarded packets |
| A | 0 | 104 | 0 |
| B | 0 | 104 | 0 |
| C | 0 | 104 | 0 |
| D | 0 | 104 | 0 |
| Quadrant | Total seconds | Saturated seconds | Saturation percentage |
|---|---|---|---|
| A | 5028 | 15 | 0.298329% |
| B | 5028 | 50 | 0.994431% |
| C | 5028 | 47 | 0.934765% |
| D | 5028 | 419 | 8.333333% |
Noise dominated data is calculated using 1-second bins in cleaned event files. If a bin has >2000 counts, and if more than 50% of those come from <1% of pixels, then it is considered to be noise-dominated and hence unusable.
| Quadrant | # 1 sec bins | Bins with >0 counts | Bins with >2000 counts | High rate bins dominated by noise | Noise dominated (total time) | Noise dominated (detector-on time) | Marked lightcurve |
|---|---|---|---|---|---|---|---|
| A | 5378 | 5029 | 0 | 0 | 0.00% | 0.00% | 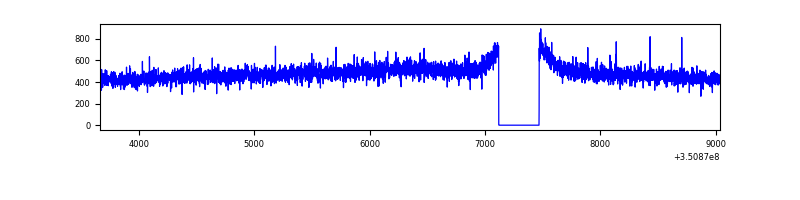 |
| B | 5378 | 5029 | 9 | 9 | 0.17% | 0.18% | 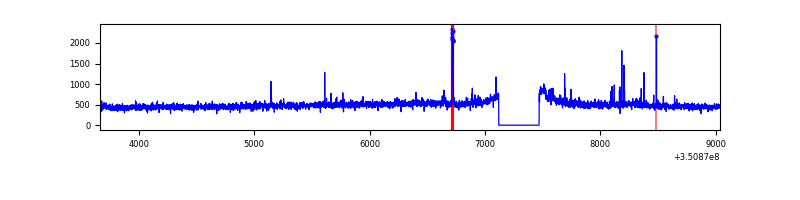 |
| C | 5378 | 5028 | 0 | 0 | 0.00% | 0.00% | 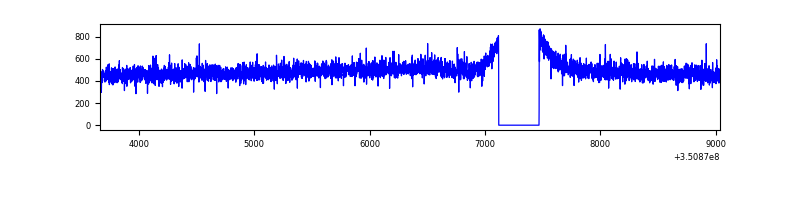 |
| D | 5378 | 5028 | 330 | 330 | 6.14% | 6.56% | 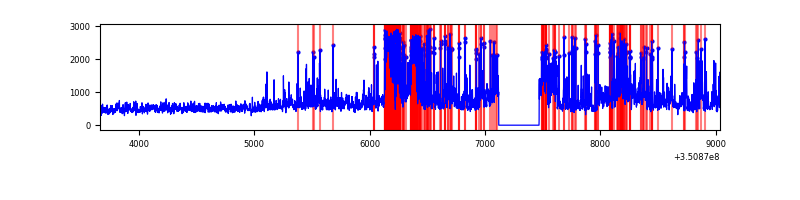 |
Top three noisy pixels from each quadrant. If the there are fewer than three noisy pixels in the level2.evt file, extra rows are filled as -1
| Pixel properties | Quadrant properties | ||||||
|---|---|---|---|---|---|---|---|
| Quadrant | DetID | PixID | Counts | Sigma | Mean | Median | Sigma |
| A | 13 | 6 | 9154 | 67.46 | 621 | 609 | 126.7 |
| A | 13 | 254 | 8444 | 61.86 | 621 | 609 | 126.7 |
| A | 3 | 137 | 6019 | 42.71 | 621 | 609 | 126.7 |
| B | 5 | 172 | 29008 | 241.14 | 617 | 601 | 117.8 |
| B | 10 | 246 | 18145 | 148.92 | 617 | 601 | 117.8 |
| B | 12 | 111 | 14465 | 117.69 | 617 | 601 | 117.8 |
| C | 14 | 238 | 95536 | 669.12 | 598 | 602 | 141.9 |
| C | 3 | 233 | 14328 | 96.74 | 598 | 602 | 141.9 |
| C | 2 | 114 | 11963 | 80.07 | 598 | 602 | 141.9 |
| D | 1 | 52 | 1227694 | 8801.61 | 582 | 567 | 139.4 |
| D | 8 | 195 | 579529 | 4152.63 | 582 | 567 | 139.4 |
| D | 2 | 250 | 131682 | 940.43 | 582 | 567 | 139.4 |
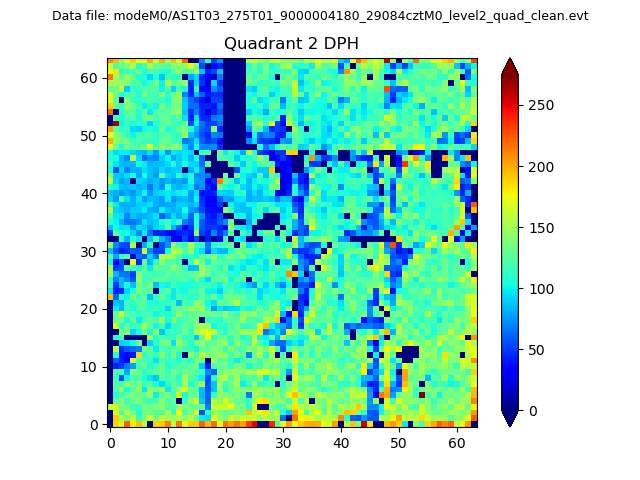
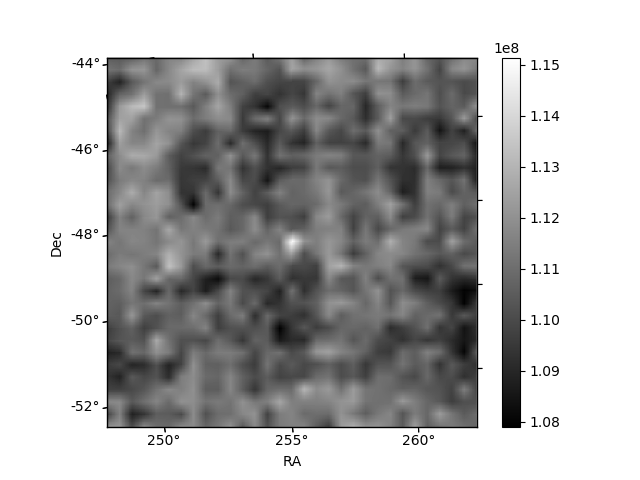
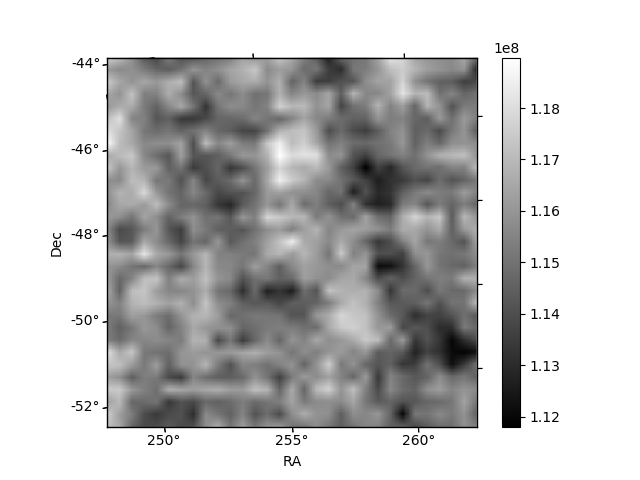
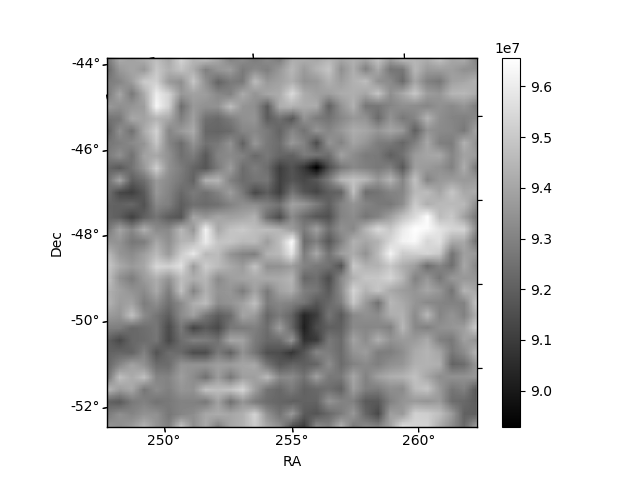
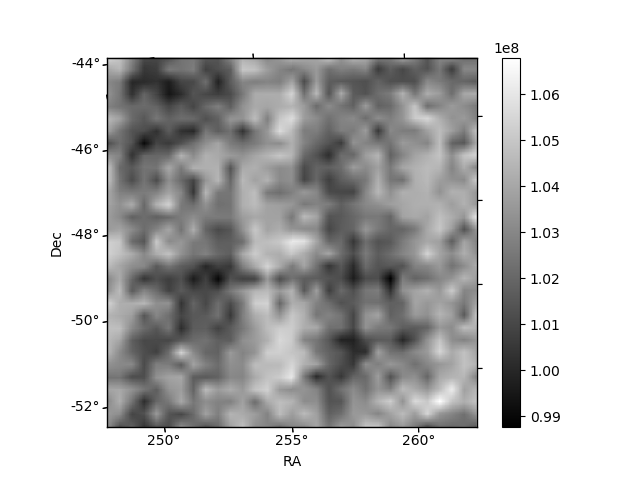
Histogram calculated using DETX and DETY for each event in the final _common_clean file
| Quadrant A |  |
 |
Quadrant B |
|---|---|---|---|
| Quadrant D | 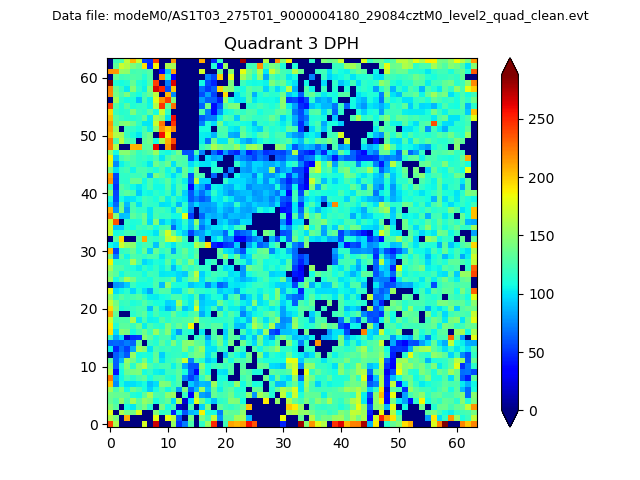 |
 |
Quadrant C |
| Plot type | Count rate plots | Images |
|---|---|---|
| Comparison with Poisson distribution Blue bars denote a histogram of data divided into 1 sec bins. Red curve is a Poisson curve with rate = median count rate of data. |
 |
 |
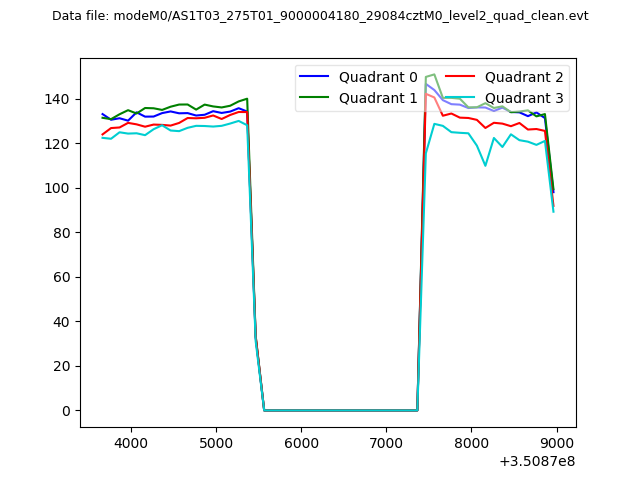
| Quadrant-wise count rates Data is divided into 100 sec bins |
 |
|
| Module-wise count rates for Quadrant A Data is divided into 100 sec bins |
 |
 |
| Module-wise count rates for Quadrant B Data is divided into 100 sec bins |
 |
 |
| Module-wise count rates for Quadrant C Data is divided into 100 sec bins |
 |
 |
| Module-wise count rates for Quadrant D Data is divided into 100 sec bins |
 |
 |
| Parameter | Plot |
|---|---|
| CZT HV Monitor |  |
| D_VDD | 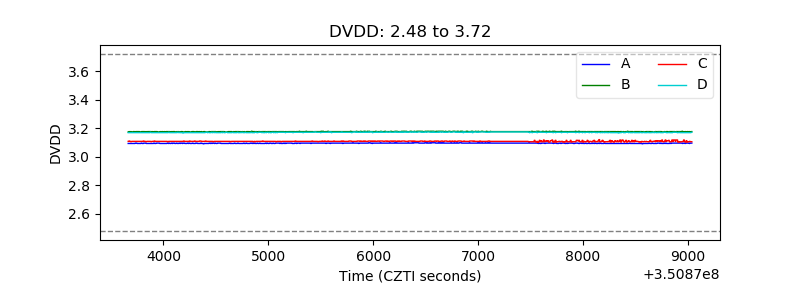 |
| Temperature 1 | 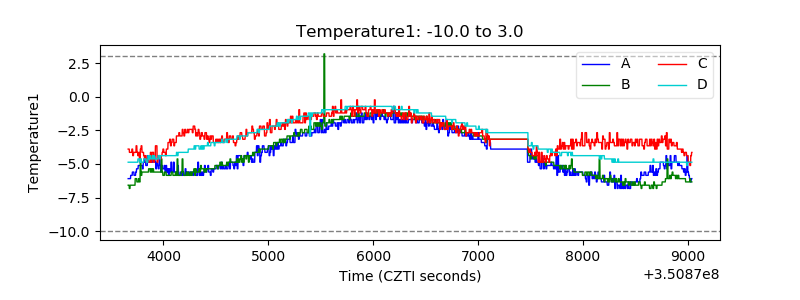 |
| Veto HV Monitor | 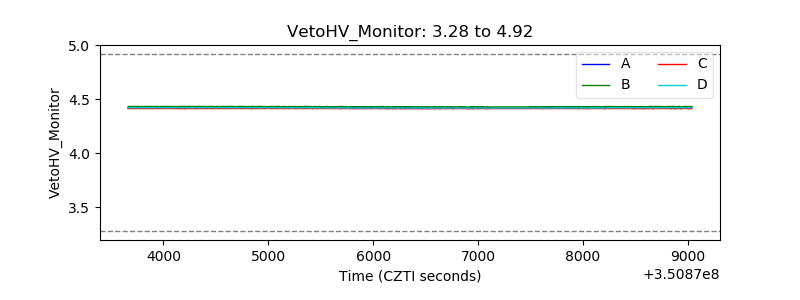 |
| Veto LLD | 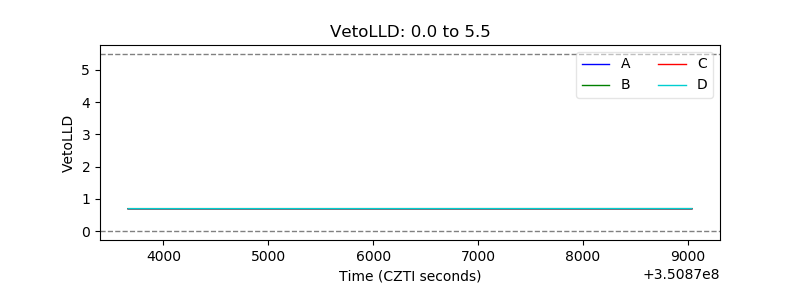 |
| Alpha Counter | 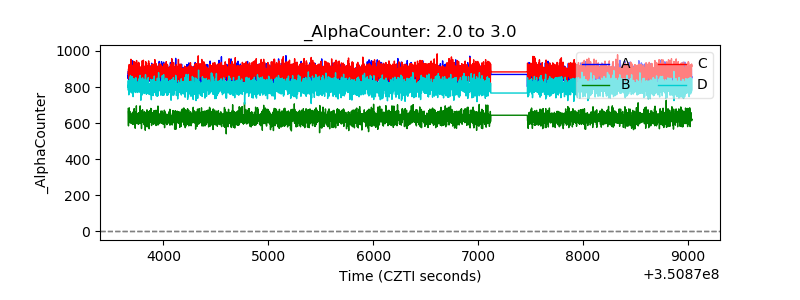 |
| _CPM_Rate | 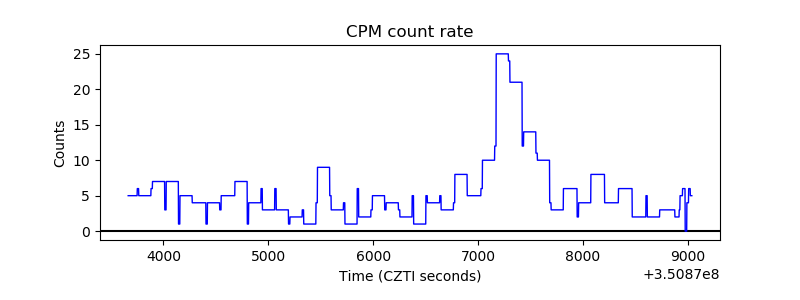 |
| CZT Counter | 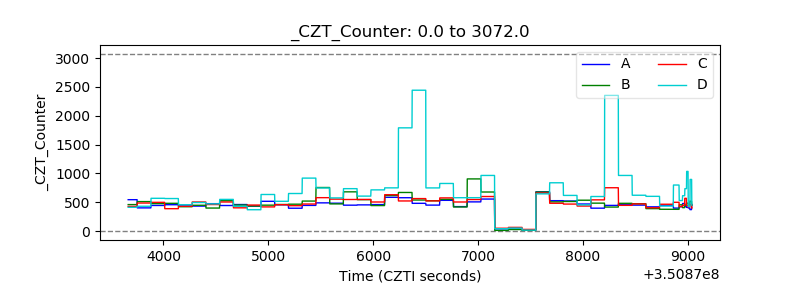 |
| +2.5 Volts monitor |  |
| +5 Volts monitor |  |
| _ROLL_ROT | 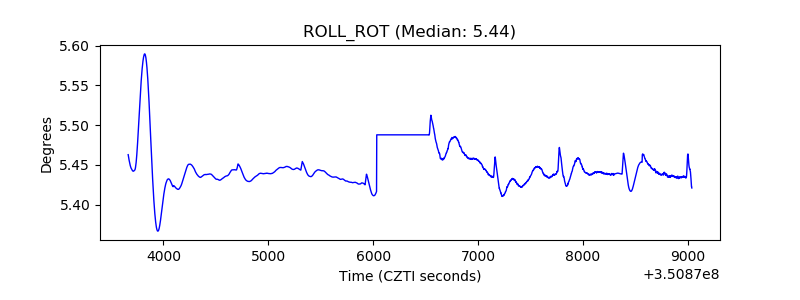 |
| _Roll_DEC | 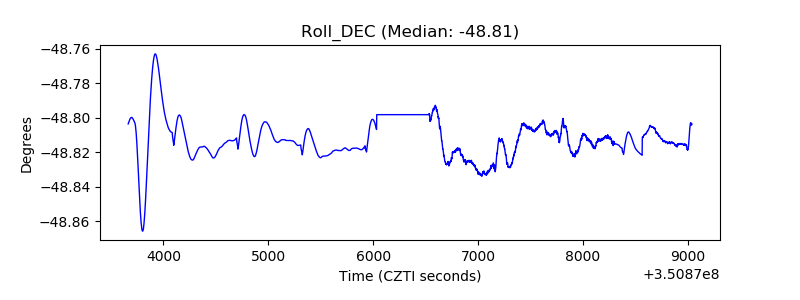 |
| _Roll_RA | 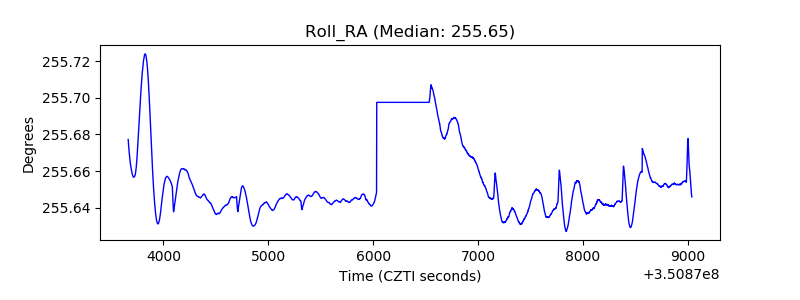 |
| Veto Counter | 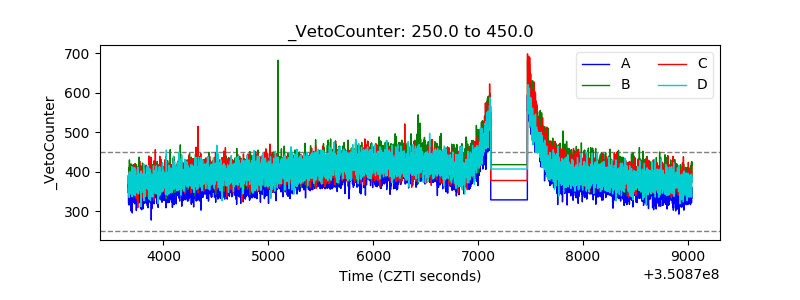 |