| Param | Original file | Final file |
|---|---|---|
| Filename | modeM0/AS1T03_275T01_9000004180_29085cztM0_level2.evt | modeM0/AS1T03_275T01_9000004180_29085cztM0_level2_quad_clean.evt |
| Size (bytes) | 580,109,760 | 104,679,360 |
| Size | 553.2 MB | 99.8 MB |
| Events in quadrant A | 3,359,790 | 692,815 |
| Events in quadrant B | 3,571,282 | 704,381 |
| Events in quadrant C | 3,463,638 | 664,960 |
| Events in quadrant D | 6,690,099 | 610,785 |
| Mode M9 | |||
|---|---|---|---|
| Quadrant | BADHDUFLAG | Total packets | Discarded packets |
| A | 0 | 2 | 0 |
| B | 0 | 2 | 0 |
| C | 0 | 2 | 0 |
| D | 0 | 2 | 0 |
| Mode M0 | |||
|---|---|---|---|
| Quadrant | BADHDUFLAG | Total packets | Discarded packets |
| A | 0 | 14673 | 1 |
| B | 0 | 15136 | 1 |
| C | 0 | 14745 | 1 |
| D | 0 | 24862 | 1 |
| Mode SS | |||
|---|---|---|---|
| Quadrant | BADHDUFLAG | Total packets | Discarded packets |
| A | 0 | 142 | 0 |
| B | 0 | 142 | 0 |
| C | 0 | 142 | 0 |
| D | 0 | 142 | 0 |
| Quadrant | Total seconds | Saturated seconds | Saturation percentage |
|---|---|---|---|
| A | 7146 | 78 | 1.091520% |
| B | 7147 | 127 | 1.776969% |
| C | 7146 | 165 | 2.308984% |
| D | 7146 | 798 | 11.167086% |
Noise dominated data is calculated using 1-second bins in cleaned event files. If a bin has >2000 counts, and if more than 50% of those come from <1% of pixels, then it is considered to be noise-dominated and hence unusable.
| Quadrant | # 1 sec bins | Bins with >0 counts | Bins with >2000 counts | High rate bins dominated by noise | Noise dominated (total time) | Noise dominated (detector-on time) | Marked lightcurve |
|---|---|---|---|---|---|---|---|
| A | 7261 | 7146 | 0 | 0 | 0.00% | 0.00% | 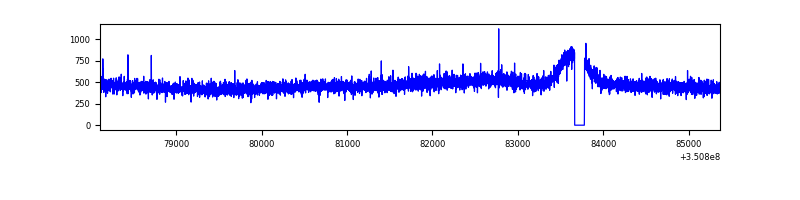 |
| B | 7262 | 7147 | 7 | 7 | 0.10% | 0.10% | 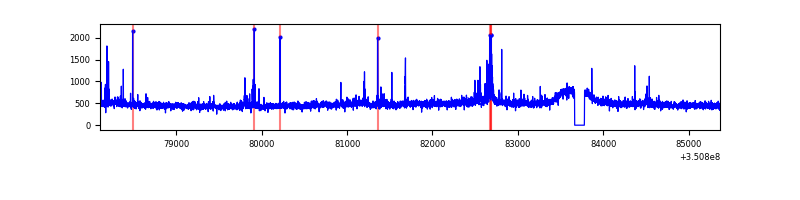 |
| C | 7260 | 7145 | 0 | 0 | 0.00% | 0.00% | 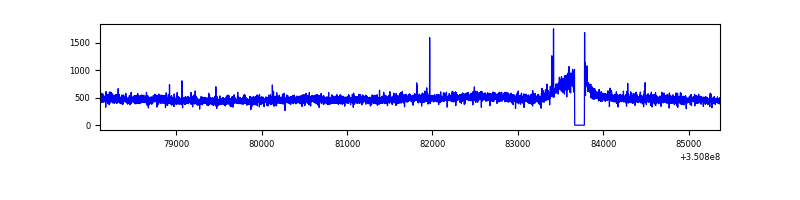 |
| D | 7261 | 7146 | 658 | 658 | 9.06% | 9.21% | 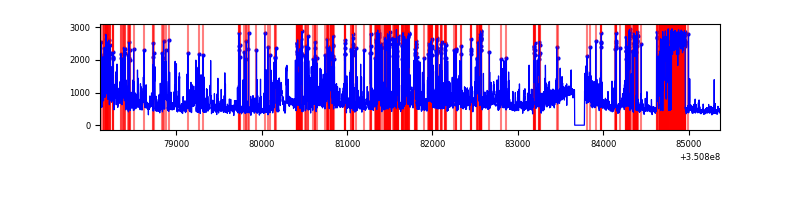 |
Top three noisy pixels from each quadrant. If the there are fewer than three noisy pixels in the level2.evt file, extra rows are filled as -1
| Pixel properties | Quadrant properties | ||||||
|---|---|---|---|---|---|---|---|
| Quadrant | DetID | PixID | Counts | Sigma | Mean | Median | Sigma |
| A | 13 | 6 | 16548 | 89.56 | 865 | 846 | 175.3 |
| A | 13 | 254 | 12663 | 67.4 | 865 | 846 | 175.3 |
| A | 3 | 137 | 8539 | 43.88 | 865 | 846 | 175.3 |
| B | 5 | 172 | 62152 | 373.28 | 864 | 844 | 164.2 |
| B | 10 | 245 | 37738 | 224.63 | 864 | 844 | 164.2 |
| B | 12 | 16 | 22528 | 132.02 | 864 | 844 | 164.2 |
| C | 14 | 238 | 133974 | 674.94 | 836 | 840 | 197.3 |
| C | 3 | 233 | 24468 | 119.79 | 836 | 840 | 197.3 |
| C | 2 | 114 | 17271 | 83.3 | 836 | 840 | 197.3 |
| D | 1 | 52 | 2811869 | 14434.51 | 810 | 786 | 194.7 |
| D | 8 | 195 | 609552 | 3125.93 | 810 | 786 | 194.7 |
| D | 2 | 250 | 116389 | 593.6 | 810 | 786 | 194.7 |
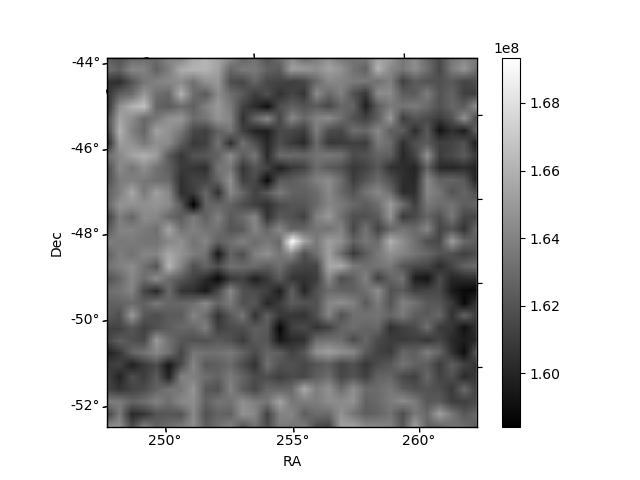
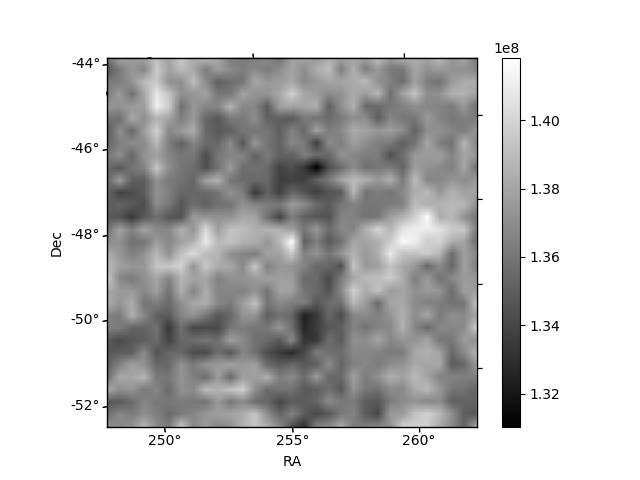
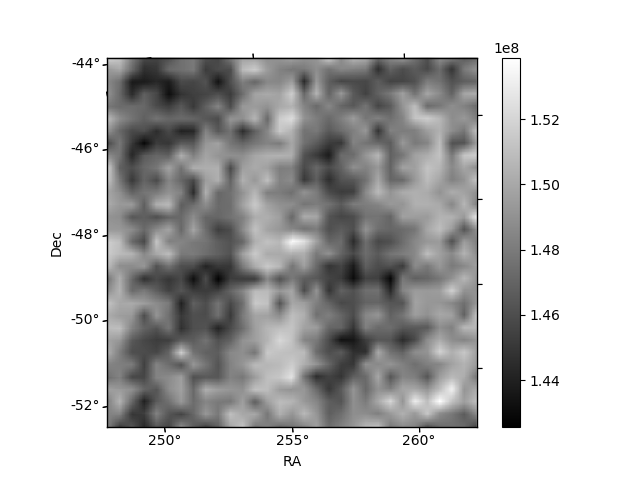
Histogram calculated using DETX and DETY for each event in the final _common_clean file
| Quadrant A |  |
 |
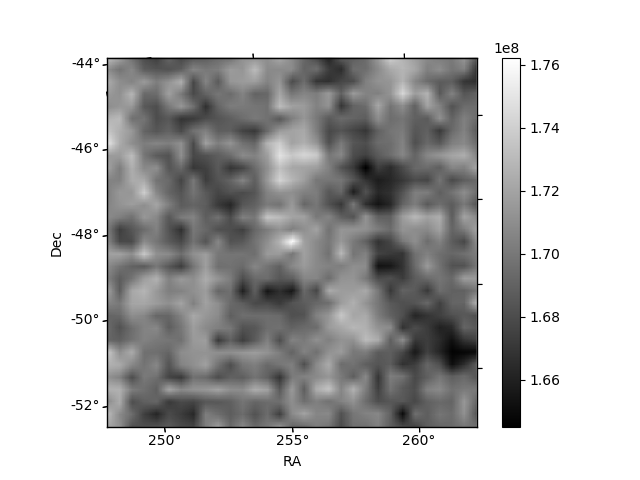
Quadrant B |
|---|---|---|---|
| Quadrant D |  |
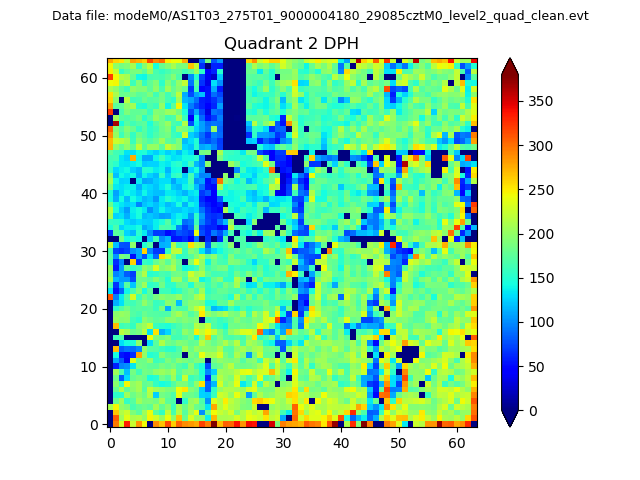 |
Quadrant C |
| Plot type | Count rate plots | Images |
|---|---|---|
| Comparison with Poisson distribution Blue bars denote a histogram of data divided into 1 sec bins. Red curve is a Poisson curve with rate = median count rate of data. |
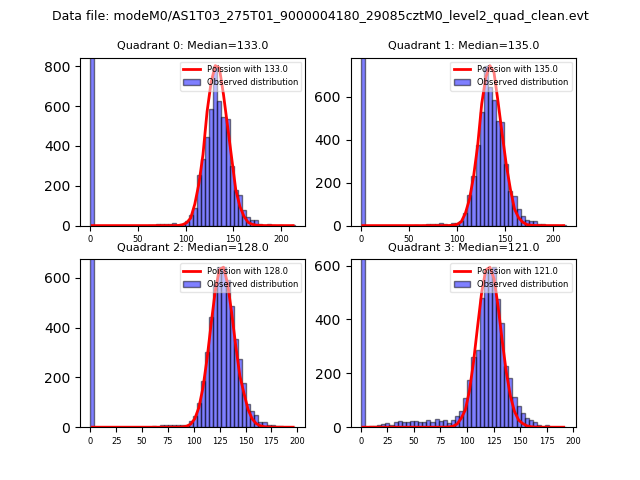 |
 |
| Quadrant-wise count rates Data is divided into 100 sec bins |
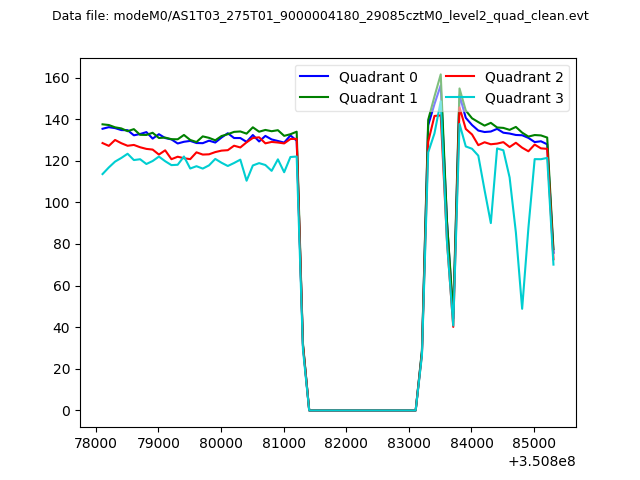 |
|
| Module-wise count rates for Quadrant A Data is divided into 100 sec bins |
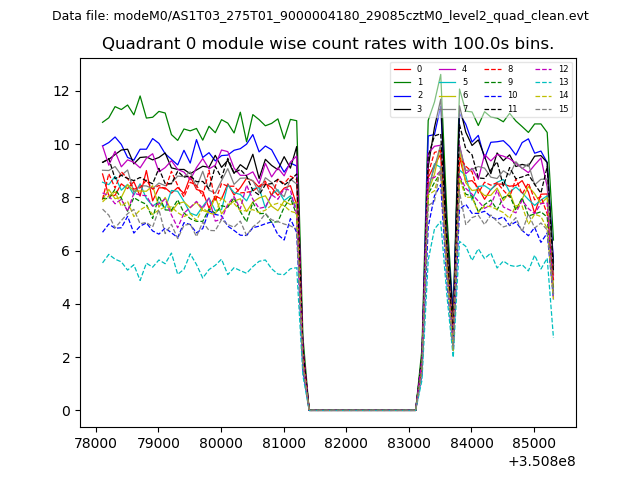 |
 |
| Module-wise count rates for Quadrant B Data is divided into 100 sec bins |
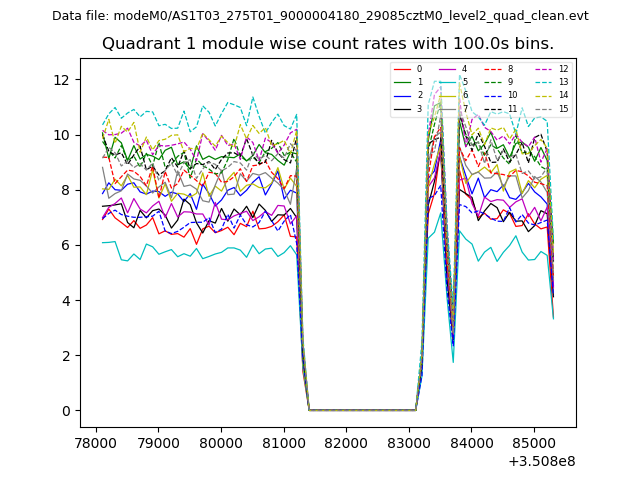 |
 |
| Module-wise count rates for Quadrant C Data is divided into 100 sec bins |
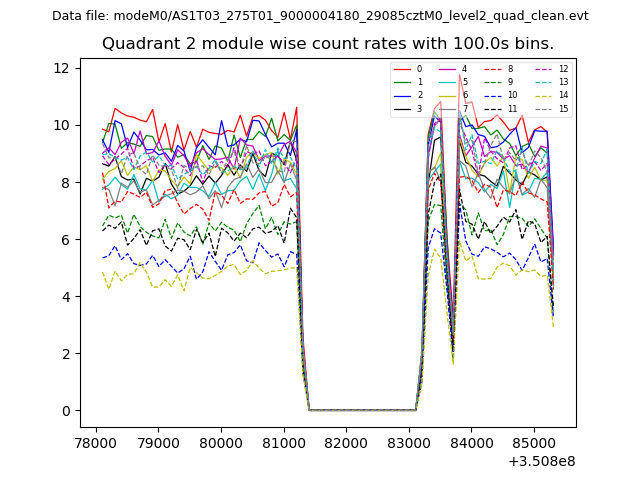 |
 |
| Module-wise count rates for Quadrant D Data is divided into 100 sec bins |
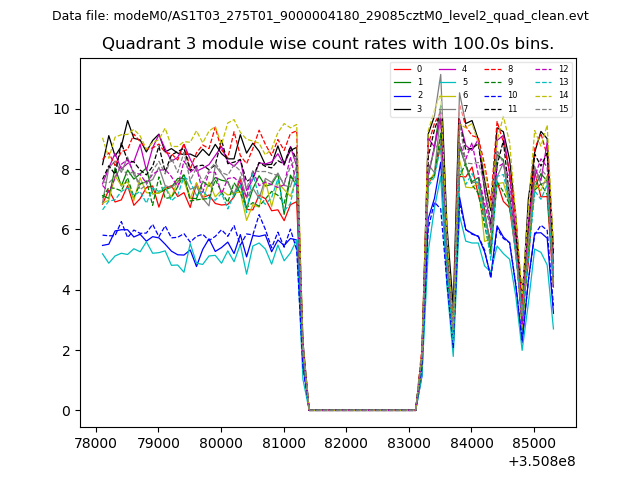 |
 |
| Parameter | Plot |
|---|---|
| CZT HV Monitor | 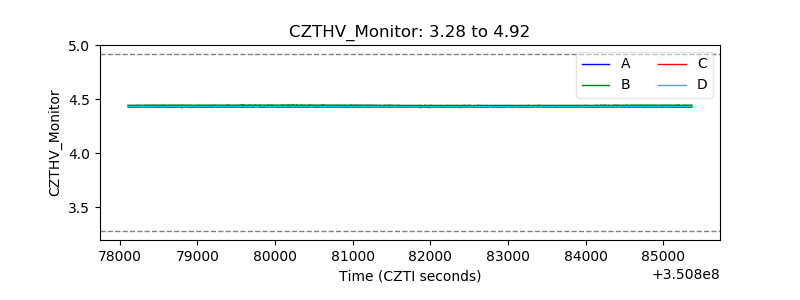 |
| D_VDD |  |
| Temperature 1 | 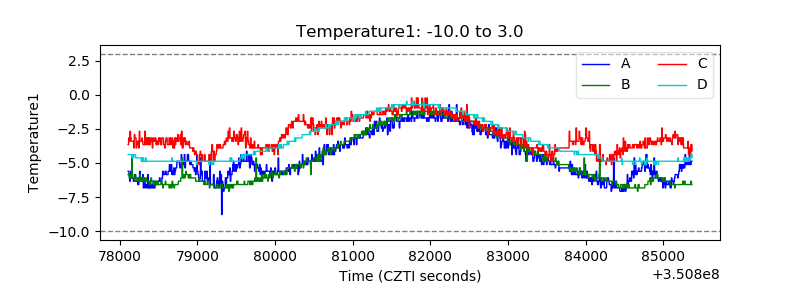 |
| Veto HV Monitor | 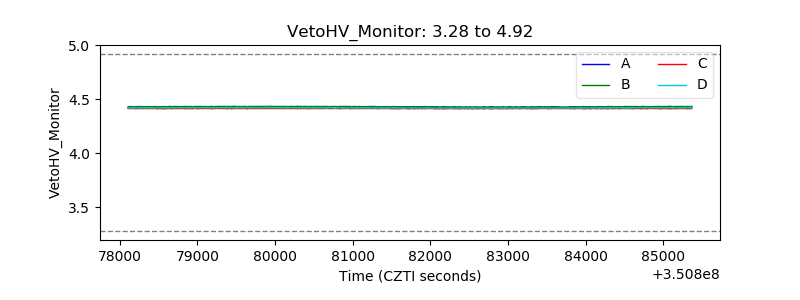 |
| Veto LLD |  |
| Alpha Counter | 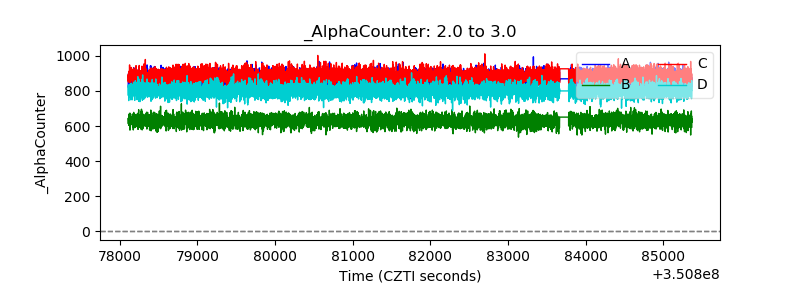 |
| _CPM_Rate | 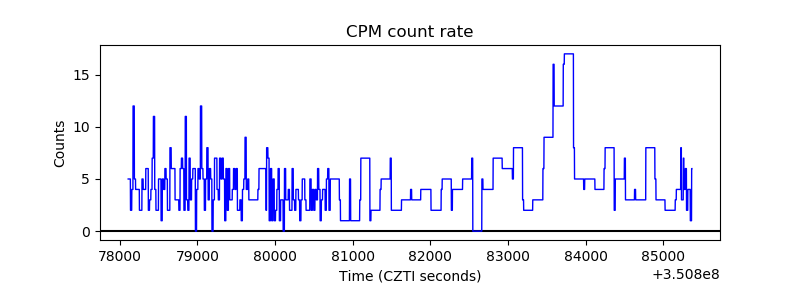 |
| CZT Counter | 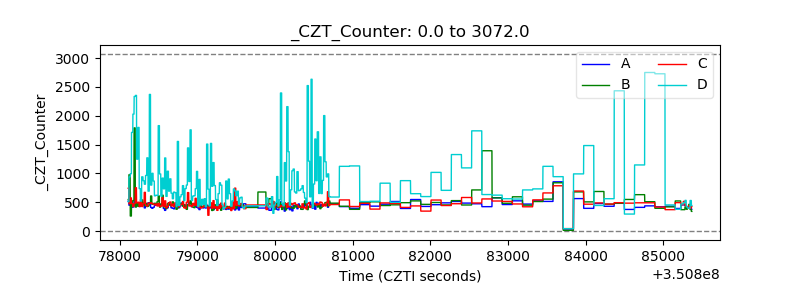 |
| +2.5 Volts monitor |  |
| +5 Volts monitor | 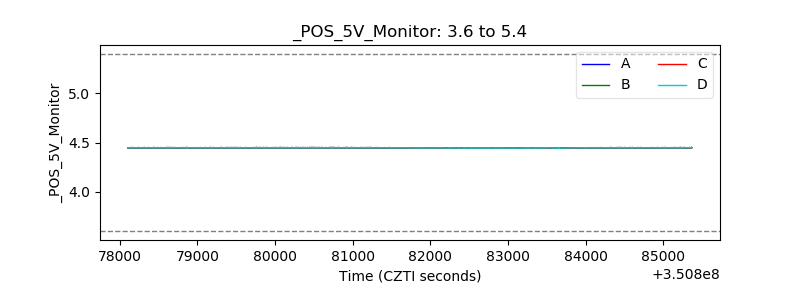 |
| _ROLL_ROT | 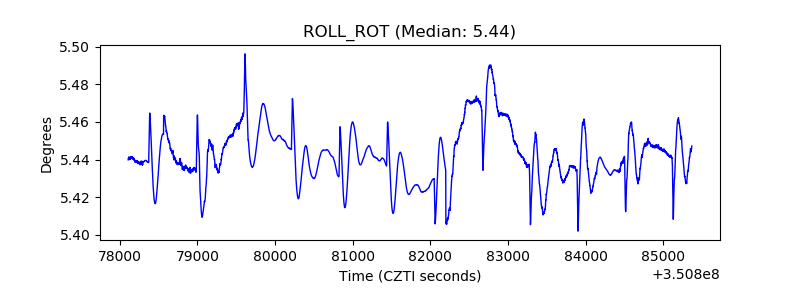 |
| _Roll_DEC | 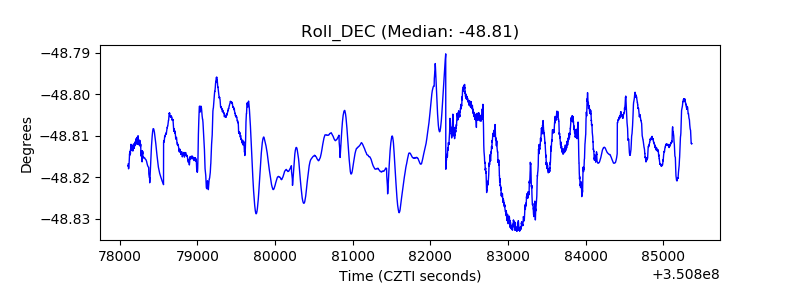 |
| _Roll_RA | 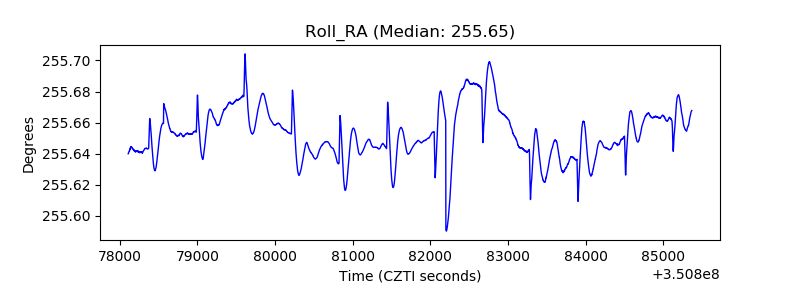 |
| Veto Counter | 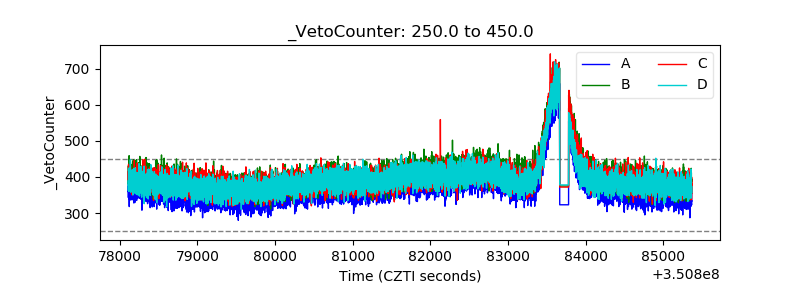 |