| Param | Original file | Final file |
|---|---|---|
| Filename | modeM0/AS1T03_275T01_9000004180_29089cztM0_level2.evt | modeM0/AS1T03_275T01_9000004180_29089cztM0_level2_quad_clean.evt |
| Size (bytes) | 1,242,267,840 | 221,544,000 |
| Size | 1.2 GB | 211.3 MB |
| Events in quadrant A | 7,756,051 | 1,422,659 |
| Events in quadrant B | 8,392,717 | 1,445,174 |
| Events in quadrant C | 8,013,152 | 1,380,462 |
| Events in quadrant D | 12,335,273 | 1,313,124 |
| Mode M9 | |||
|---|---|---|---|
| Quadrant | BADHDUFLAG | Total packets | Discarded packets |
| A | 0 | 15 | 0 |
| B | 0 | 15 | 0 |
| C | 0 | 15 | 0 |
| D | 0 | 15 | 0 |
| Mode M0 | |||
|---|---|---|---|
| Quadrant | BADHDUFLAG | Total packets | Discarded packets |
| A | 0 | 33807 | 2 |
| B | 0 | 35608 | 2 |
| C | 0 | 34005 | 2 |
| D | 0 | 47996 | 2 |
| Mode SS | |||
|---|---|---|---|
| Quadrant | BADHDUFLAG | Total packets | Discarded packets |
| A | 0 | 338 | 0 |
| B | 0 | 338 | 0 |
| C | 0 | 338 | 0 |
| D | 0 | 338 | 0 |
| Quadrant | Total seconds | Saturated seconds | Saturation percentage |
|---|---|---|---|
| A | 16657 | 98 | 0.588341% |
| B | 16657 | 179 | 1.074623% |
| C | 16658 | 198 | 1.188618% |
| D | 16658 | 718 | 4.310241% |
Noise dominated data is calculated using 1-second bins in cleaned event files. If a bin has >2000 counts, and if more than 50% of those come from <1% of pixels, then it is considered to be noise-dominated and hence unusable.
| Quadrant | # 1 sec bins | Bins with >0 counts | Bins with >2000 counts | High rate bins dominated by noise | Noise dominated (total time) | Noise dominated (detector-on time) | Marked lightcurve |
|---|---|---|---|---|---|---|---|
| A | 17526 | 16657 | 0 | 0 | 0.00% | 0.00% | 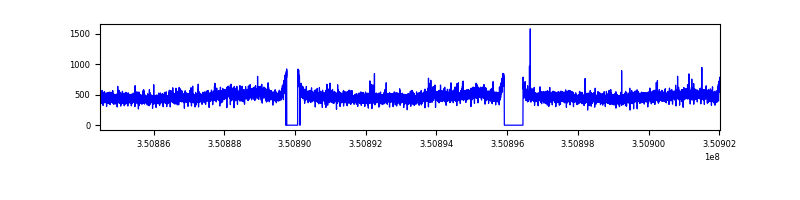 |
| B | 17526 | 16657 | 44 | 44 | 0.25% | 0.26% | 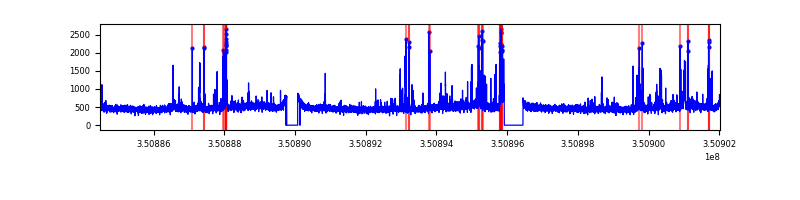 |
| C | 17527 | 16659 | 0 | 0 | 0.00% | 0.00% | 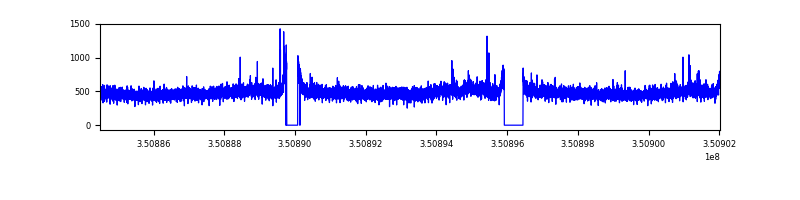 |
| D | 17528 | 16660 | 583 | 583 | 3.33% | 3.50% | 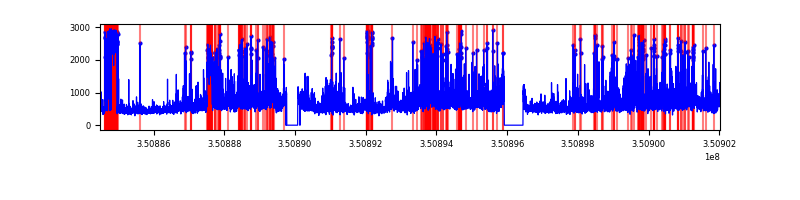 |
Top three noisy pixels from each quadrant. If the there are fewer than three noisy pixels in the level2.evt file, extra rows are filled as -1
| Pixel properties | Quadrant properties | ||||||
|---|---|---|---|---|---|---|---|
| Quadrant | DetID | PixID | Counts | Sigma | Mean | Median | Sigma |
| A | 13 | 254 | 31850 | 74.69 | 1995 | 1950 | 400.3 |
| A | 6 | 16 | 23178 | 53.03 | 1995 | 1950 | 400.3 |
| A | 13 | 6 | 21132 | 47.92 | 1995 | 1950 | 400.3 |
| B | 5 | 255 | 163289 | 434.1 | 1977 | 1924 | 371.7 |
| B | 5 | 172 | 149939 | 398.19 | 1977 | 1924 | 371.7 |
| B | 10 | 245 | 127813 | 338.67 | 1977 | 1924 | 371.7 |
| C | 14 | 238 | 309365 | 682.15 | 1919 | 1930 | 450.7 |
| C | 3 | 233 | 149853 | 328.22 | 1919 | 1930 | 450.7 |
| C | 2 | 114 | 39312 | 82.94 | 1919 | 1930 | 450.7 |
| D | 1 | 52 | 2737485 | 6024.59 | 1906 | 1851 | 454.1 |
| D | 8 | 195 | 1929441 | 4245.06 | 1906 | 1851 | 454.1 |
| D | 12 | 233 | 174600 | 380.44 | 1906 | 1851 | 454.1 |
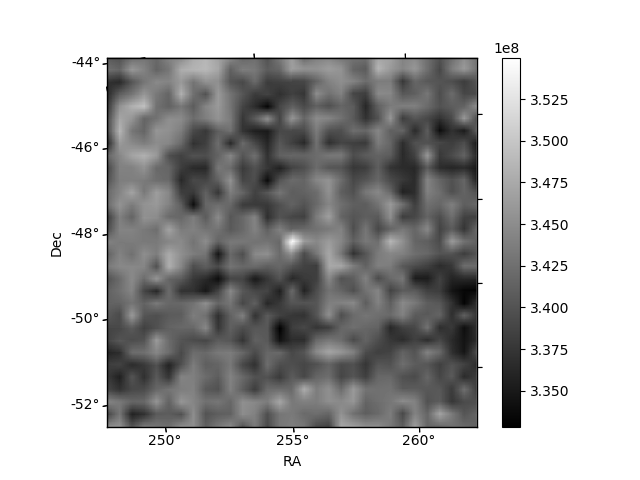
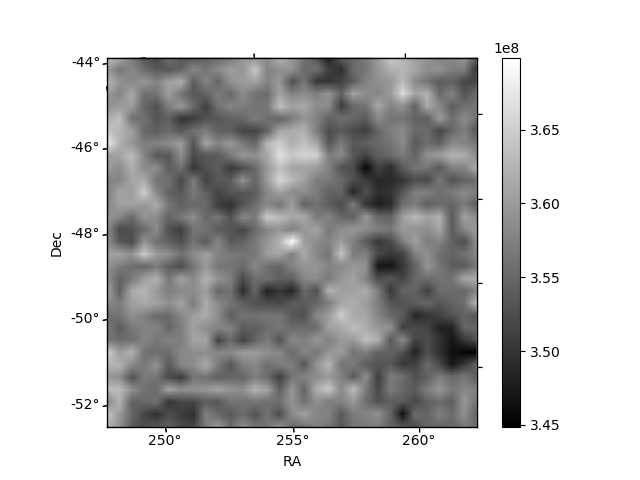
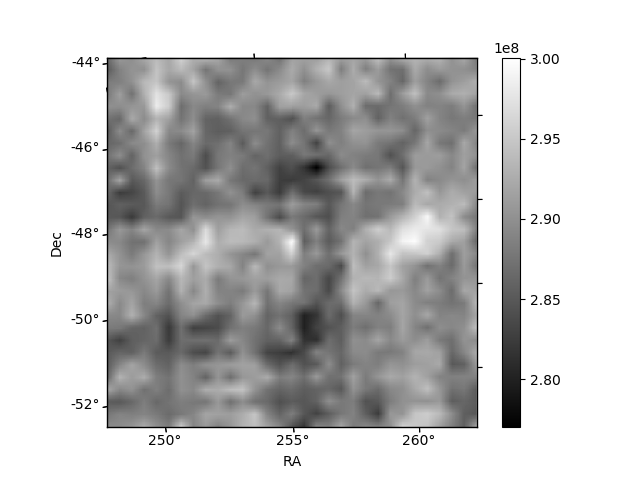
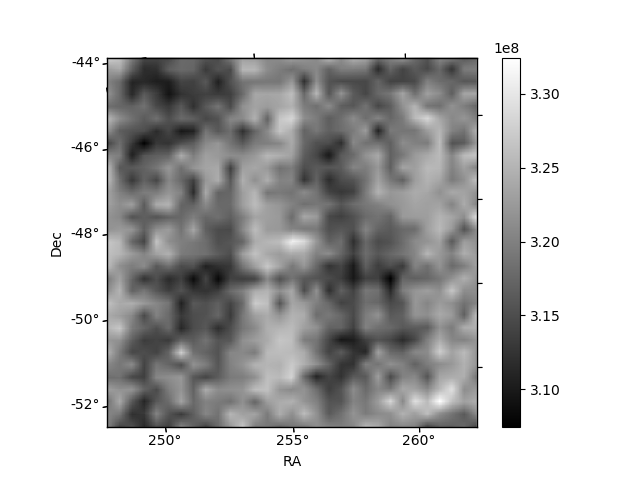
Histogram calculated using DETX and DETY for each event in the final _common_clean file
| Quadrant A | 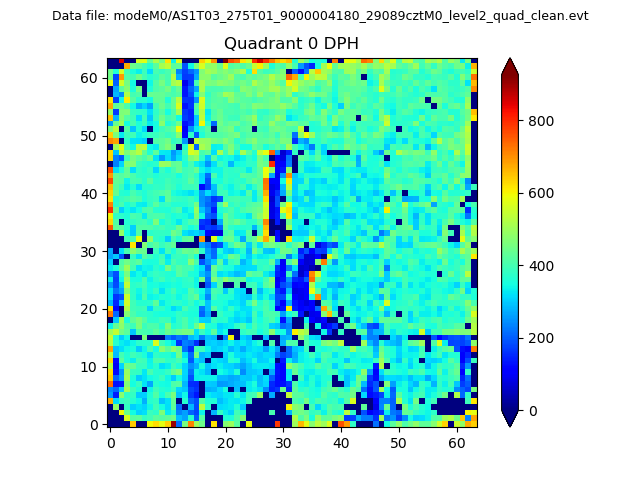 |
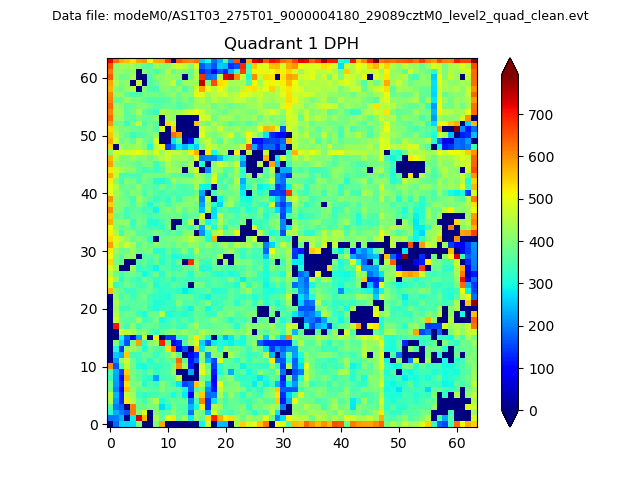 |
Quadrant B |
|---|---|---|---|
| Quadrant D | 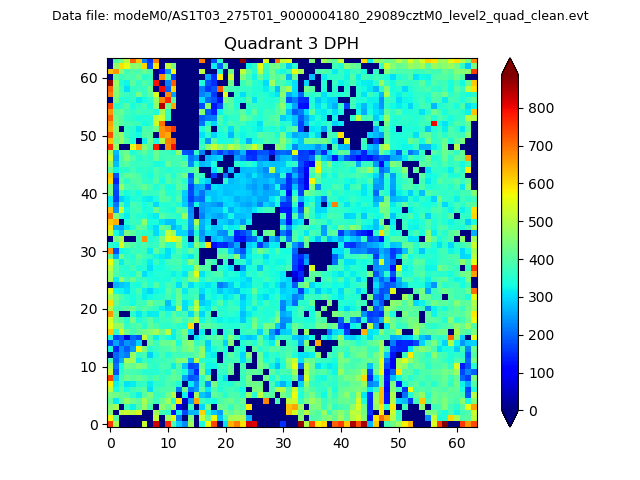 |
 |
Quadrant C |
| Plot type | Count rate plots | Images |
|---|---|---|
| Comparison with Poisson distribution Blue bars denote a histogram of data divided into 1 sec bins. Red curve is a Poisson curve with rate = median count rate of data. |
 |
 |
| Quadrant-wise count rates Data is divided into 100 sec bins |
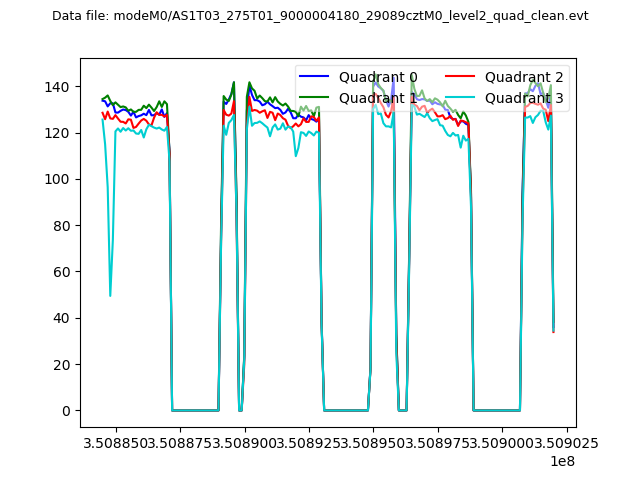 |
|
| Module-wise count rates for Quadrant A Data is divided into 100 sec bins |
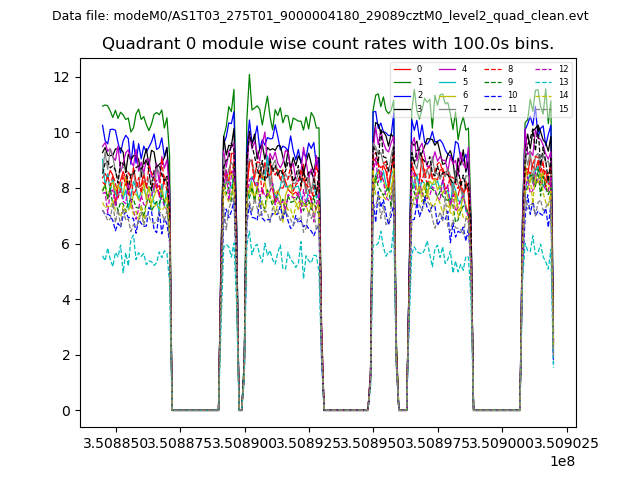 |
 |
| Module-wise count rates for Quadrant B Data is divided into 100 sec bins |
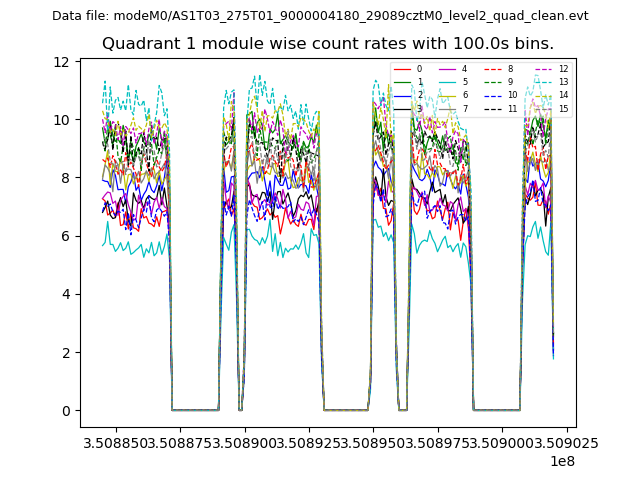 |
 |
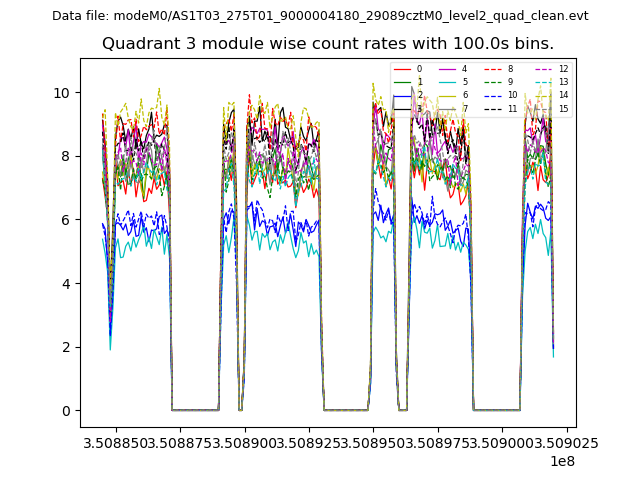
| Module-wise count rates for Quadrant C Data is divided into 100 sec bins |
 |
 |
| Module-wise count rates for Quadrant D Data is divided into 100 sec bins |
 |
 |
| Parameter | Plot |
|---|---|
| CZT HV Monitor | 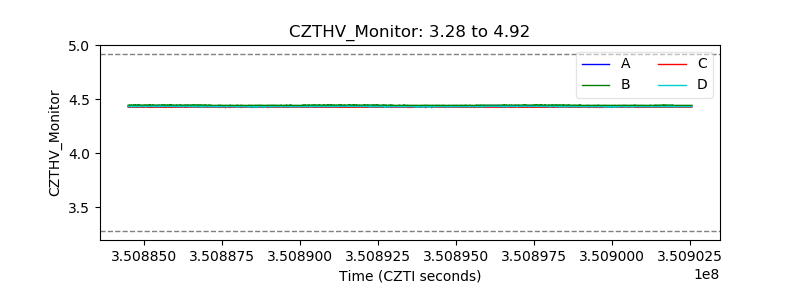 |
| D_VDD | 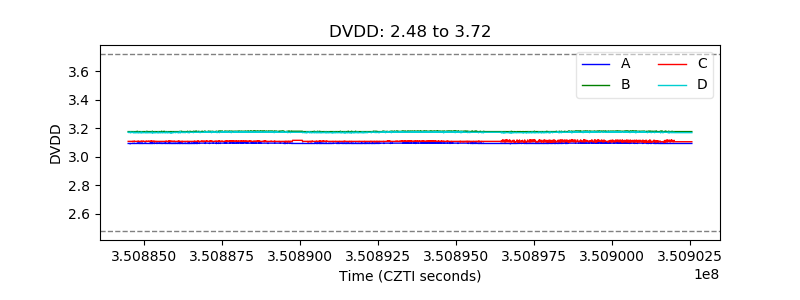 |
| Temperature 1 | 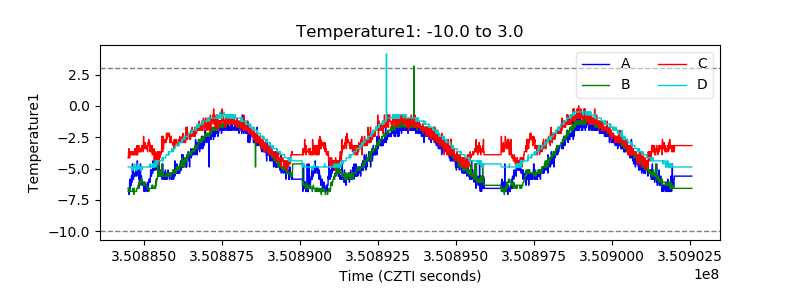 |
| Veto HV Monitor | 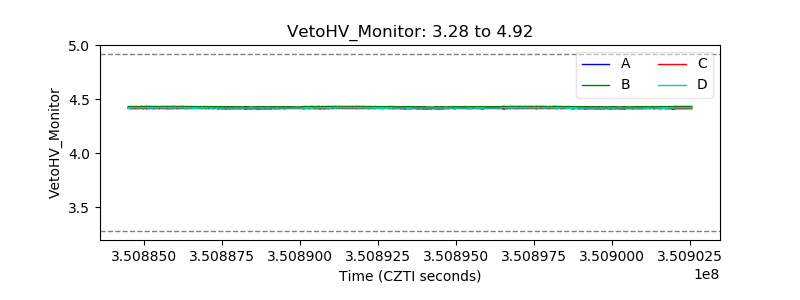 |
| Veto LLD | 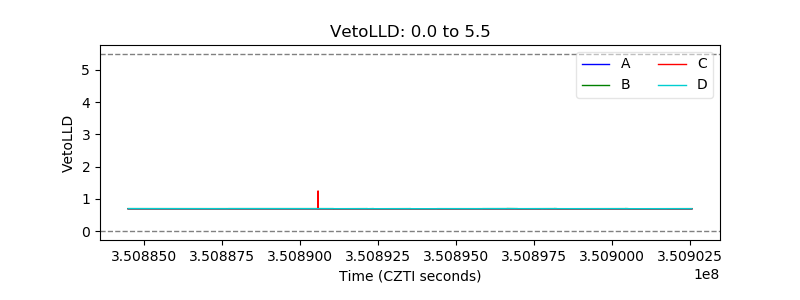 |
| Alpha Counter |  |
| _CPM_Rate | 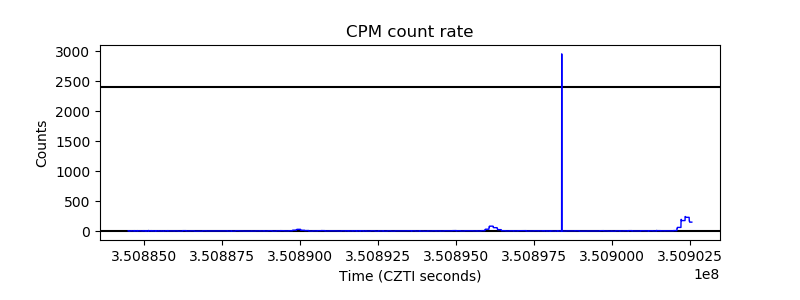 |
| CZT Counter |  |
| +2.5 Volts monitor |  |
| +5 Volts monitor |  |
| _ROLL_ROT | 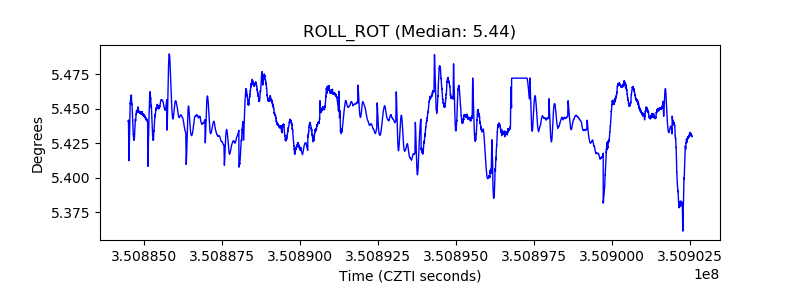 |
| _Roll_DEC | 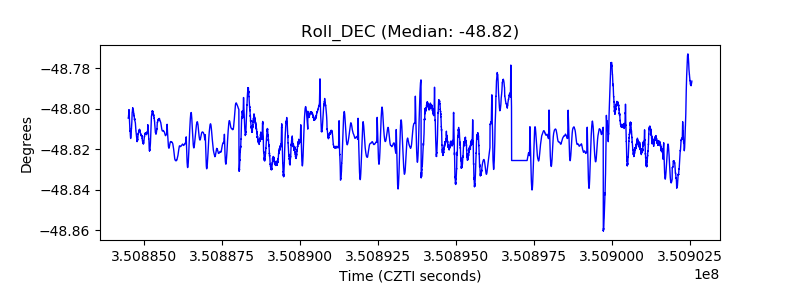 |
| _Roll_RA | 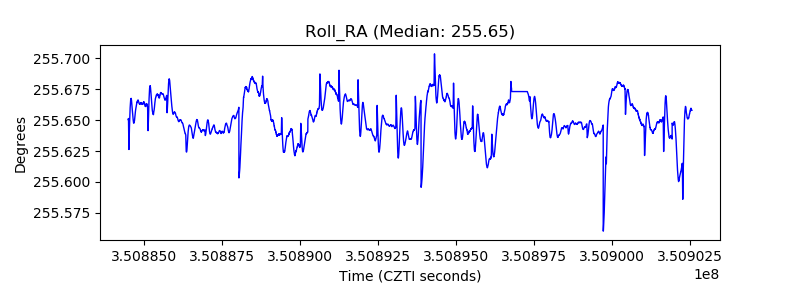 |
| Veto Counter | 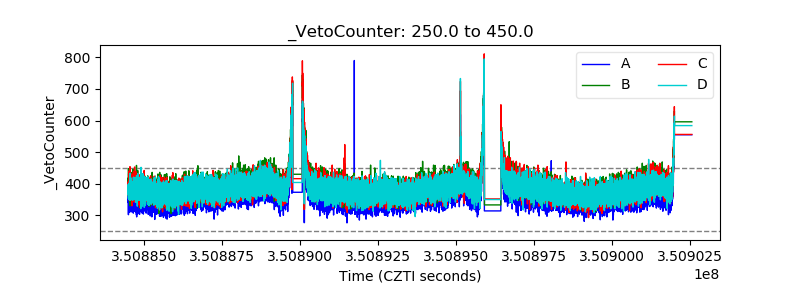 |