| Param | Original file | Final file |
|---|---|---|
| Filename | modeM0/AS1T03_275T01_9000004180_29090cztM0_level2.evt | modeM0/AS1T03_275T01_9000004180_29090cztM0_level2_quad_clean.evt |
| Size (bytes) | 1,002,133,440 | 173,315,520 |
| Size | 955.7 MB | 165.3 MB |
| Events in quadrant A | 5,897,836 | 1,132,408 |
| Events in quadrant B | 6,687,314 | 1,141,929 |
| Events in quadrant C | 7,014,666 | 1,083,299 |
| Events in quadrant D | 9,924,048 | 1,045,951 |
| Mode M9 | |||
|---|---|---|---|
| Quadrant | BADHDUFLAG | Total packets | Discarded packets |
| A | 0 | 25 | 0 |
| B | 0 | 25 | 0 |
| C | 0 | 25 | 0 |
| D | 0 | 25 | 0 |
| Mode M0 | |||
|---|---|---|---|
| Quadrant | BADHDUFLAG | Total packets | Discarded packets |
| A | 0 | 25342 | 3 |
| B | 0 | 27446 | 3 |
| C | 0 | 28860 | 3 |
| D | 0 | 38095 | 4 |
| Mode SS | |||
|---|---|---|---|
| Quadrant | BADHDUFLAG | Total packets | Discarded packets |
| A | 0 | 252 | 0 |
| B | 0 | 252 | 0 |
| C | 0 | 252 | 0 |
| D | 0 | 252 | 0 |
| Quadrant | Total seconds | Saturated seconds | Saturation percentage |
|---|---|---|---|
| A | 12225 | 101 | 0.826176% |
| B | 12226 | 268 | 2.192050% |
| C | 12226 | 207 | 1.693113% |
| D | 12225 | 454 | 3.713701% |
Noise dominated data is calculated using 1-second bins in cleaned event files. If a bin has >2000 counts, and if more than 50% of those come from <1% of pixels, then it is considered to be noise-dominated and hence unusable.
| Quadrant | # 1 sec bins | Bins with >0 counts | Bins with >2000 counts | High rate bins dominated by noise | Noise dominated (total time) | Noise dominated (detector-on time) | Marked lightcurve |
|---|---|---|---|---|---|---|---|
| A | 14869 | 12224 | 0 | 0 | 0.00% | 0.00% | 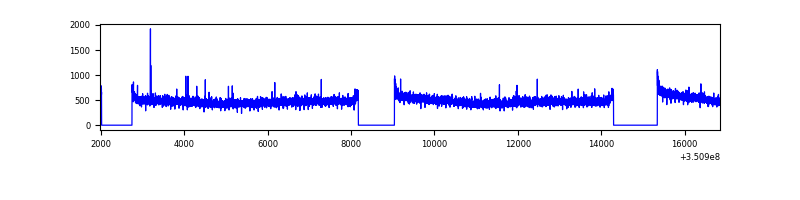 |
| B | 14870 | 12225 | 144 | 144 | 0.97% | 1.18% | 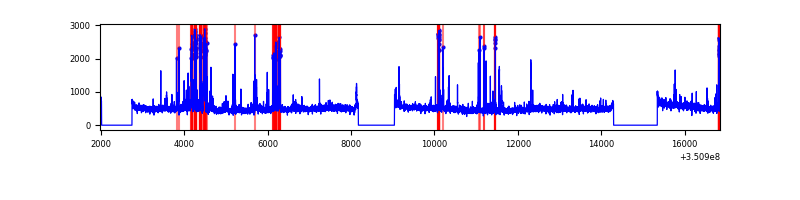 |
| C | 14870 | 12225 | 15 | 15 | 0.10% | 0.12% | 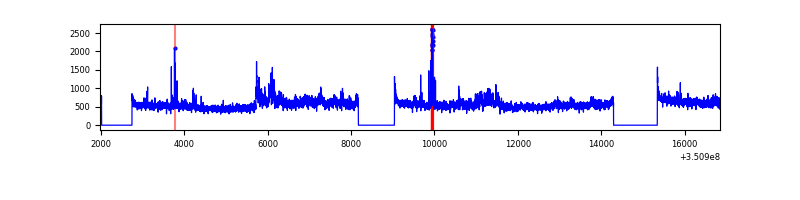 |
| D | 14869 | 12225 | 335 | 335 | 2.25% | 2.74% | 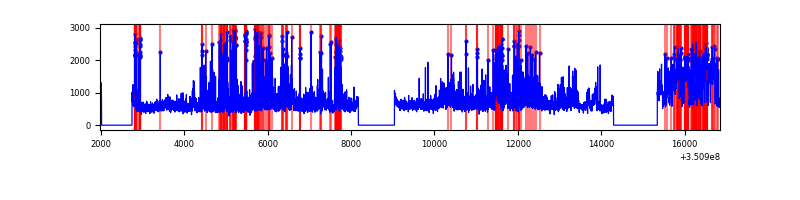 |
Top three noisy pixels from each quadrant. If the there are fewer than three noisy pixels in the level2.evt file, extra rows are filled as -1
| Pixel properties | Quadrant properties | ||||||
|---|---|---|---|---|---|---|---|
| Quadrant | DetID | PixID | Counts | Sigma | Mean | Median | Sigma |
| A | 13 | 254 | 23075 | 71.4 | 1522 | 1491 | 302.3 |
| A | 3 | 137 | 14277 | 42.3 | 1522 | 1491 | 302.3 |
| A | 13 | 6 | 13150 | 38.57 | 1522 | 1491 | 302.3 |
| B | 10 | 245 | 477449 | 1696.38 | 1499 | 1463 | 280.6 |
| B | 5 | 255 | 208120 | 736.51 | 1499 | 1463 | 280.6 |
| B | 0 | 190 | 34376 | 117.3 | 1499 | 1463 | 280.6 |
| C | 3 | 233 | 987630 | 2923.79 | 1453 | 1461 | 337.3 |
| C | 14 | 238 | 233600 | 688.25 | 1453 | 1461 | 337.3 |
| C | 10 | 22 | 99994 | 292.13 | 1453 | 1461 | 337.3 |
| D | 8 | 195 | 2654780 | 7640.26 | 1462 | 1427 | 347.3 |
| D | 1 | 52 | 1283024 | 3690.33 | 1462 | 1427 | 347.3 |
| D | 2 | 250 | 234339 | 670.66 | 1462 | 1427 | 347.3 |
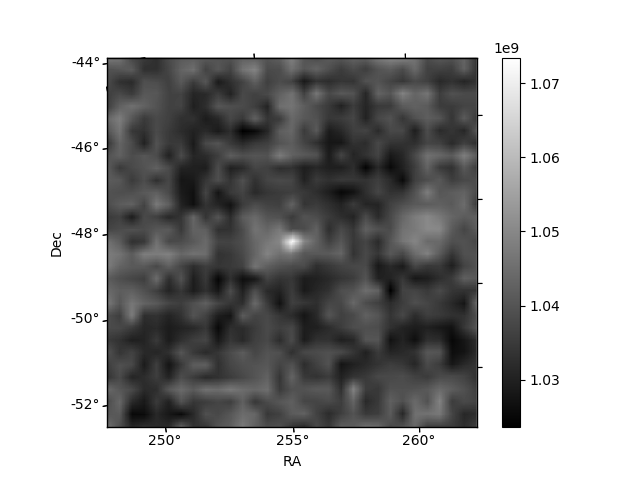
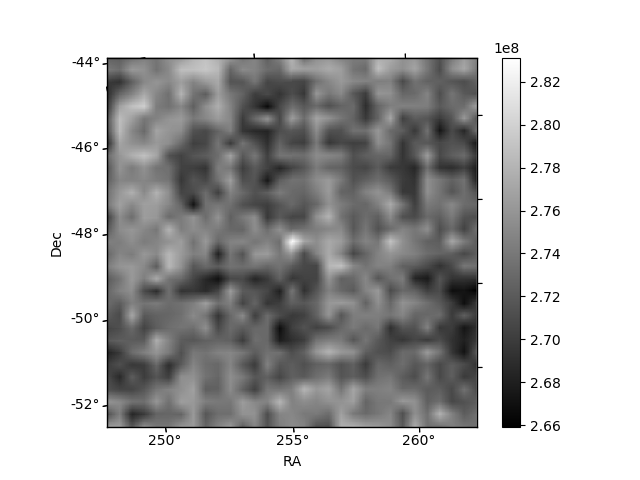
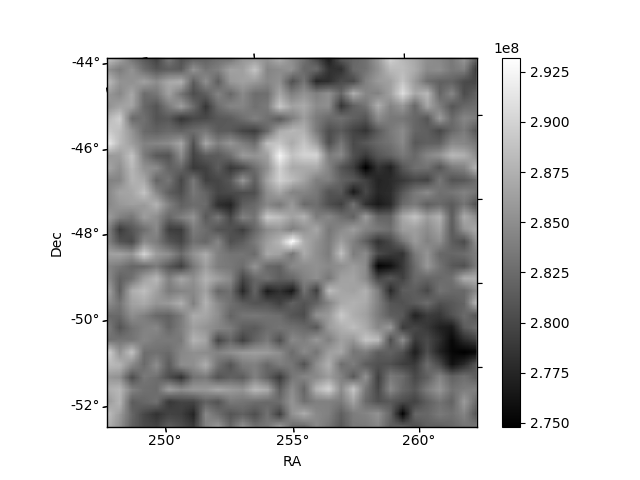
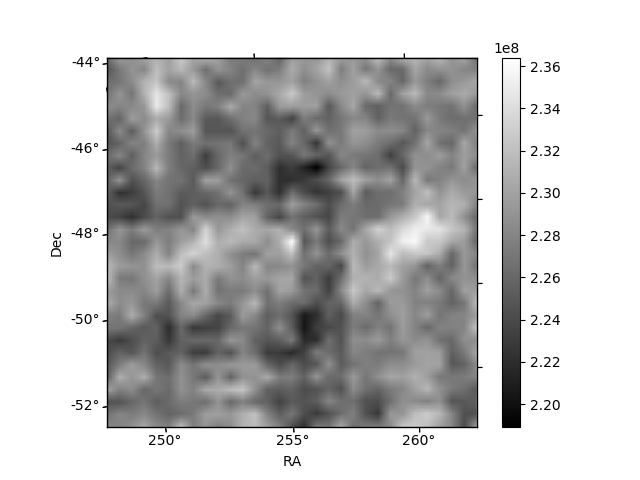
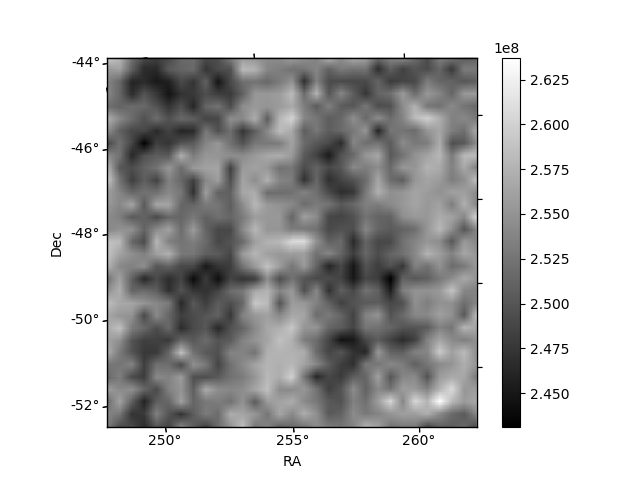
Histogram calculated using DETX and DETY for each event in the final _common_clean file
| Quadrant A |  |
 |
Quadrant B |
|---|---|---|---|
| Quadrant D |  |
 |
Quadrant C |
| Plot type | Count rate plots | Images |
|---|---|---|
| Comparison with Poisson distribution Blue bars denote a histogram of data divided into 1 sec bins. Red curve is a Poisson curve with rate = median count rate of data. |
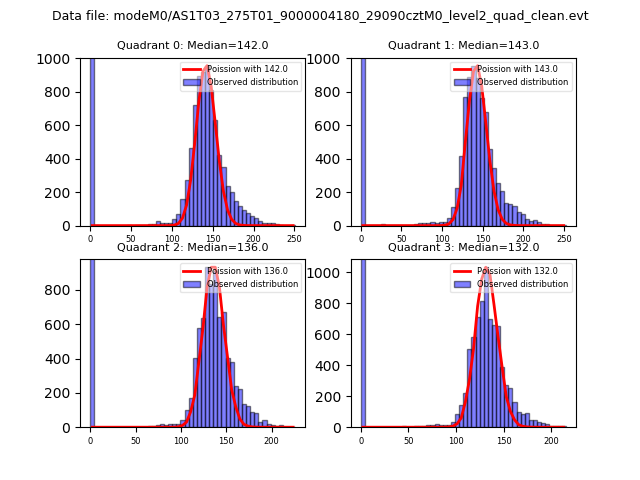 |
 |
| Quadrant-wise count rates Data is divided into 100 sec bins |
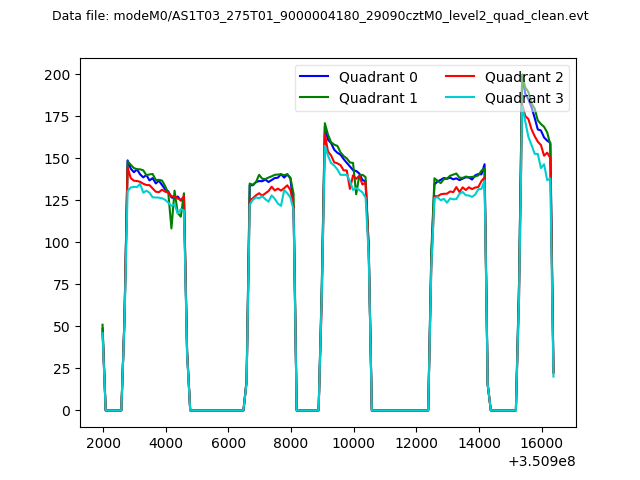 |
|
| Module-wise count rates for Quadrant A Data is divided into 100 sec bins |
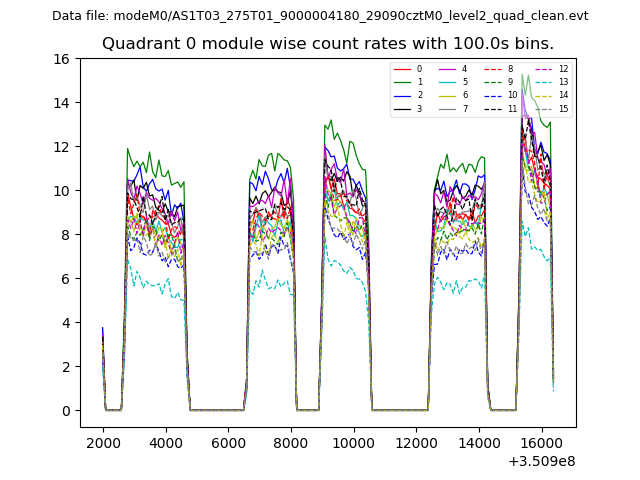 |
 |
| Module-wise count rates for Quadrant B Data is divided into 100 sec bins |
 |
 |
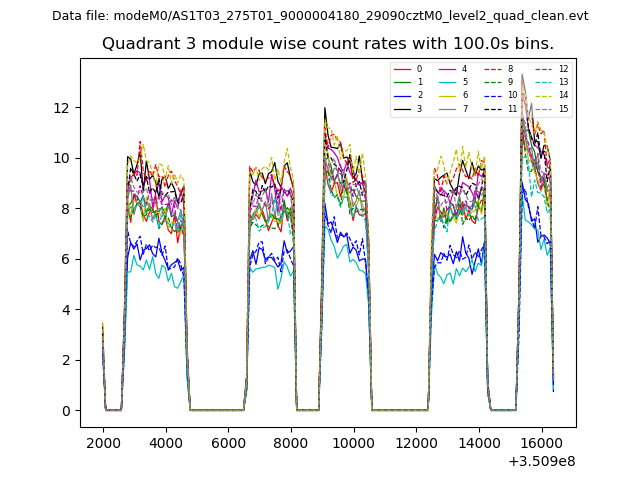
| Module-wise count rates for Quadrant C Data is divided into 100 sec bins |
 |
 |
| Module-wise count rates for Quadrant D Data is divided into 100 sec bins |
 |
 |
| Parameter | Plot |
|---|---|
| CZT HV Monitor |  |
| D_VDD | 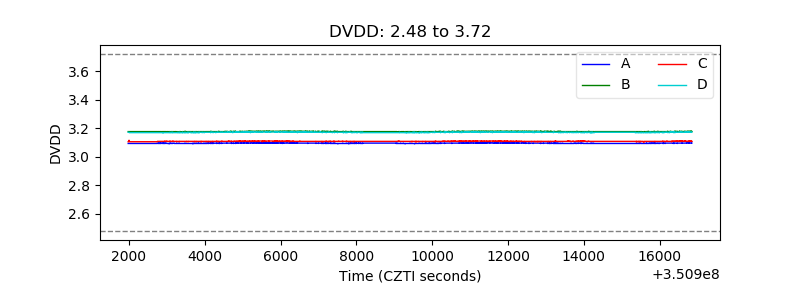 |
| Temperature 1 | 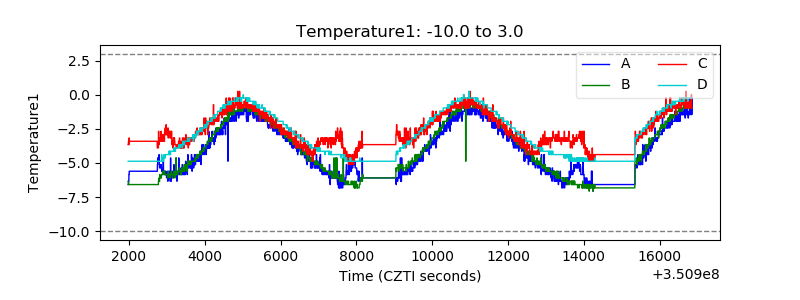 |
| Veto HV Monitor | 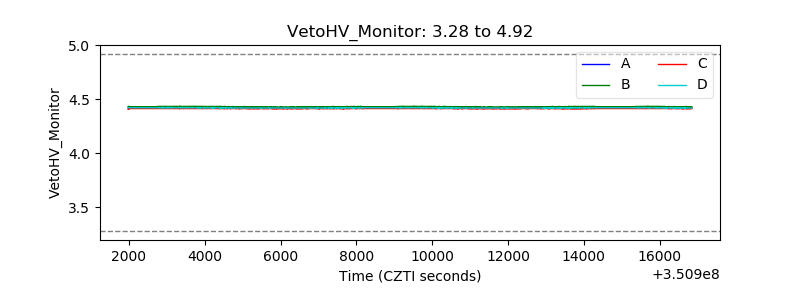 |
| Veto LLD | 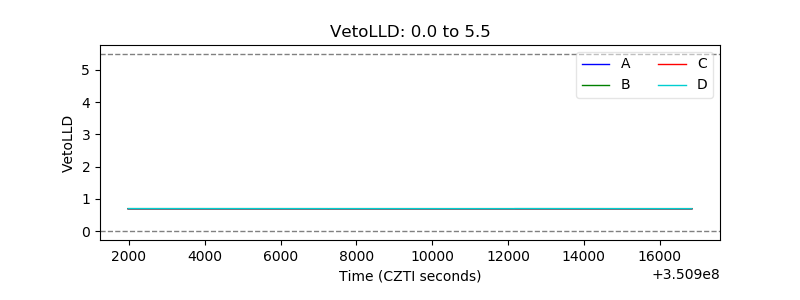 |
| Alpha Counter |  |
| _CPM_Rate | 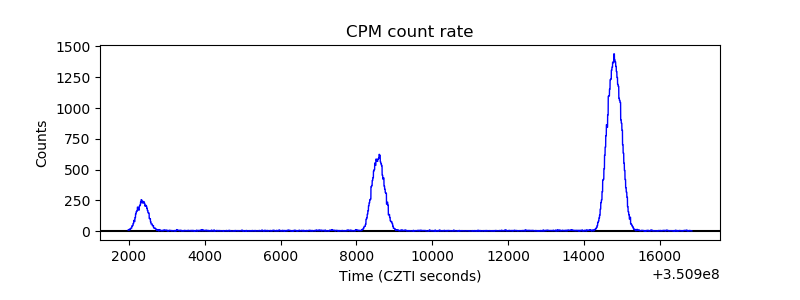 |
| CZT Counter | 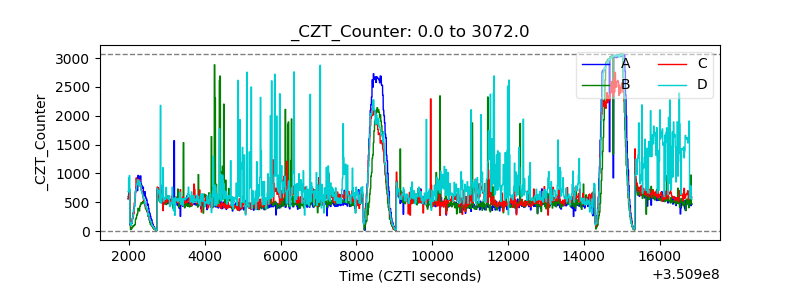 |
| +2.5 Volts monitor |  |
| +5 Volts monitor |  |
| _ROLL_ROT | 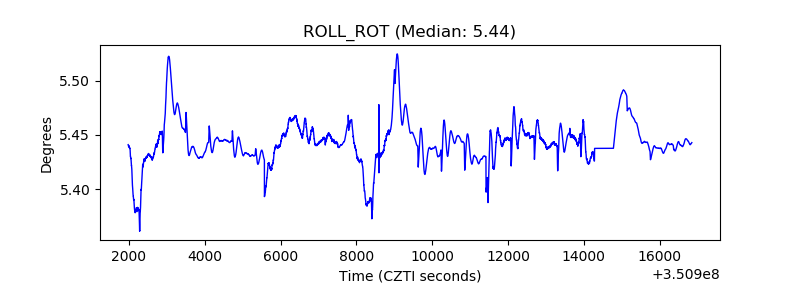 |
| _Roll_DEC | 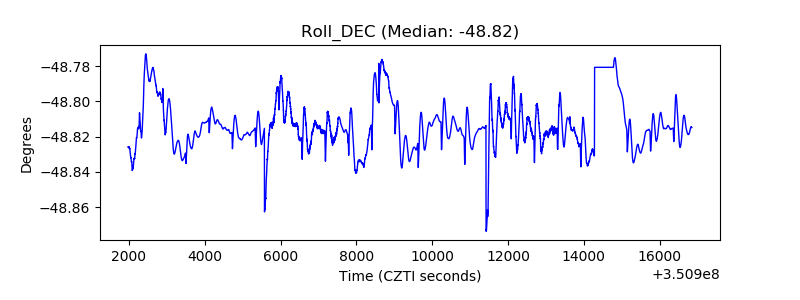 |
| _Roll_RA | 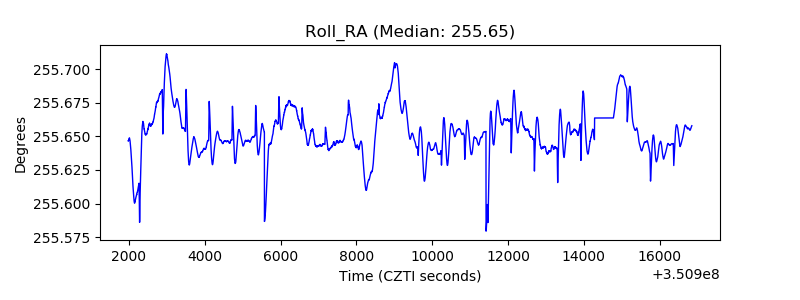 |
| Veto Counter | 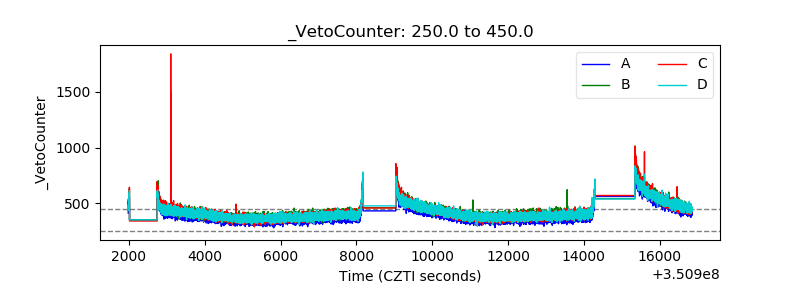 |