| Param | Original file | Final file |
|---|---|---|
| Filename | modeM0/AS1T03_275T01_9000004180_29092cztM0_level2.evt | modeM0/AS1T03_275T01_9000004180_29092cztM0_level2_quad_clean.evt |
| Size (bytes) | 620,124,480 | 77,181,120 |
| Size | 591.4 MB | 73.6 MB |
| Events in quadrant A | 3,090,035 | 504,196 |
| Events in quadrant B | 3,301,559 | 507,939 |
| Events in quadrant C | 3,465,360 | 473,425 |
| Events in quadrant D | 8,517,390 | 431,446 |
| Mode M9 | |||
|---|---|---|---|
| Quadrant | BADHDUFLAG | Total packets | Discarded packets |
| A | 0 | 12 | 0 |
| B | 0 | 12 | 0 |
| C | 0 | 12 | 0 |
| D | 0 | 12 | 0 |
| Mode M0 | |||
|---|---|---|---|
| Quadrant | BADHDUFLAG | Total packets | Discarded packets |
| A | 0 | 12972 | 1 |
| B | 0 | 13528 | 1 |
| C | 0 | 14204 | 1 |
| D | 0 | 29545 | 1 |
| Mode SS | |||
|---|---|---|---|
| Quadrant | BADHDUFLAG | Total packets | Discarded packets |
| A | 0 | 122 | 0 |
| B | 0 | 122 | 0 |
| C | 0 | 122 | 0 |
| D | 0 | 122 | 0 |
| Quadrant | Total seconds | Saturated seconds | Saturation percentage |
|---|---|---|---|
| A | 6013 | 56 | 0.931315% |
| B | 6013 | 114 | 1.895892% |
| C | 6013 | 92 | 1.530018% |
| D | 6013 | 1091 | 18.144021% |
Noise dominated data is calculated using 1-second bins in cleaned event files. If a bin has >2000 counts, and if more than 50% of those come from <1% of pixels, then it is considered to be noise-dominated and hence unusable.
| Quadrant | # 1 sec bins | Bins with >0 counts | Bins with >2000 counts | High rate bins dominated by noise | Noise dominated (total time) | Noise dominated (detector-on time) | Marked lightcurve |
|---|---|---|---|---|---|---|---|
| A | 7178 | 6013 | 0 | 0 | 0.00% | 0.00% | 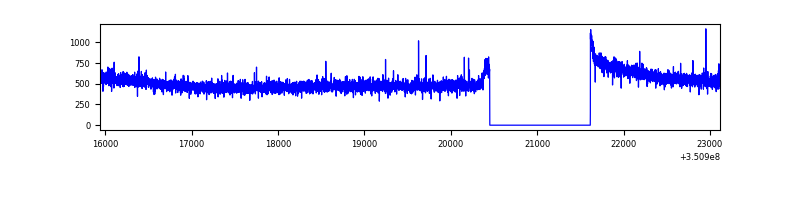 |
| B | 7178 | 6013 | 43 | 43 | 0.60% | 0.72% | 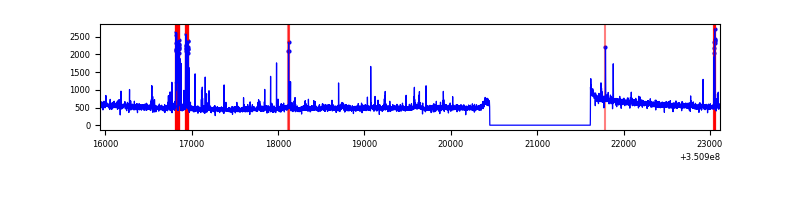 |
| C | 7178 | 6013 | 1 | 1 | 0.01% | 0.02% | 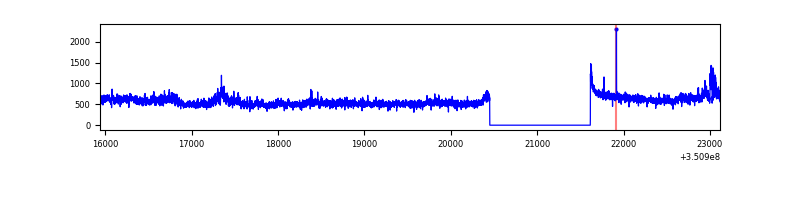 |
| D | 7178 | 6014 | 1205 | 1205 | 16.79% | 20.04% | 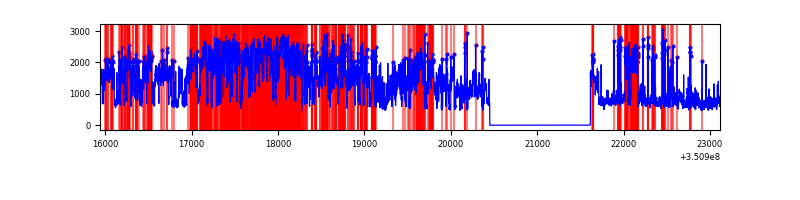 |
Top three noisy pixels from each quadrant. If the there are fewer than three noisy pixels in the level2.evt file, extra rows are filled as -1
| Pixel properties | Quadrant properties | ||||||
|---|---|---|---|---|---|---|---|
| Quadrant | DetID | PixID | Counts | Sigma | Mean | Median | Sigma |
| A | 13 | 254 | 11637 | 68.71 | 799 | 787 | 157.9 |
| A | 3 | 137 | 6941 | 38.97 | 799 | 787 | 157.9 |
| A | 0 | 226 | 6705 | 37.48 | 799 | 787 | 157.9 |
| B | 10 | 245 | 98242 | 671.68 | 784 | 768 | 145.1 |
| B | 5 | 255 | 49178 | 333.59 | 784 | 768 | 145.1 |
| B | 4 | 67 | 24361 | 162.58 | 784 | 768 | 145.1 |
| C | 3 | 233 | 412474 | 2390.38 | 745 | 750 | 172.2 |
| C | 14 | 238 | 122615 | 707.52 | 745 | 750 | 172.2 |
| C | 2 | 114 | 14424 | 79.39 | 745 | 750 | 172.2 |
| D | 8 | 195 | 4285705 | 24924.51 | 729 | 712 | 171.9 |
| D | 1 | 52 | 1289554 | 7496.8 | 729 | 712 | 171.9 |
| D | 12 | 233 | 82671 | 476.73 | 729 | 712 | 171.9 |
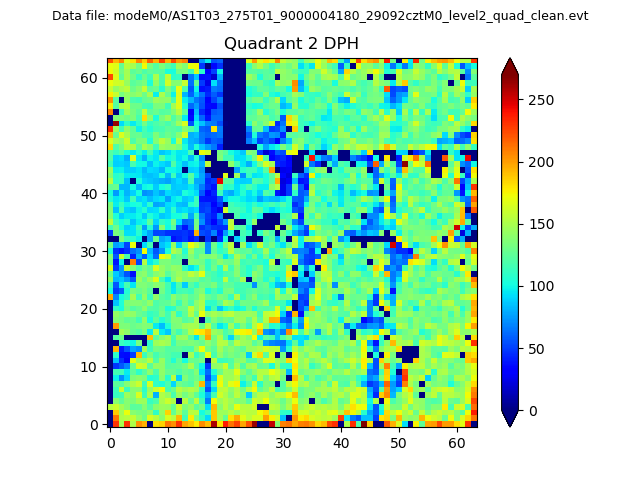
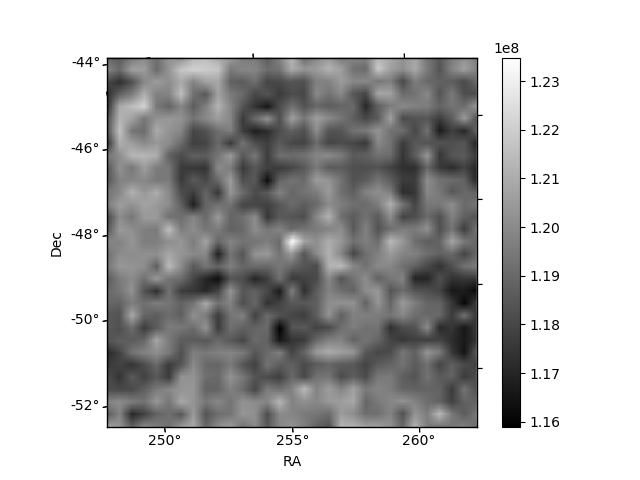
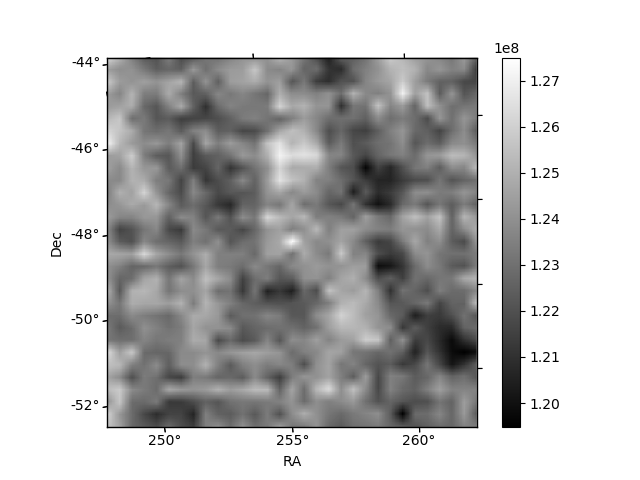
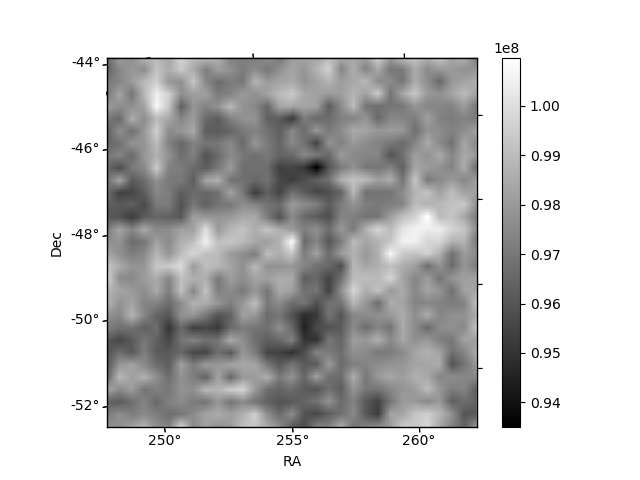
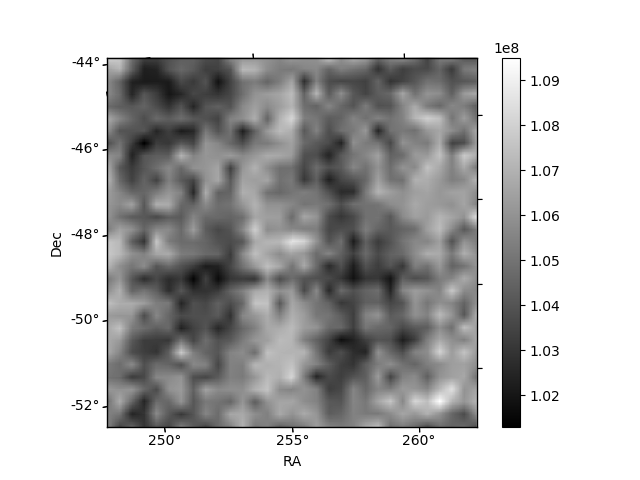
Histogram calculated using DETX and DETY for each event in the final _common_clean file
| Quadrant A | 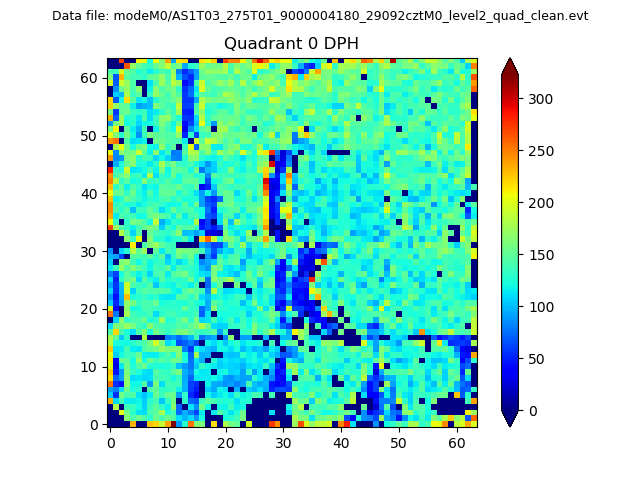 |
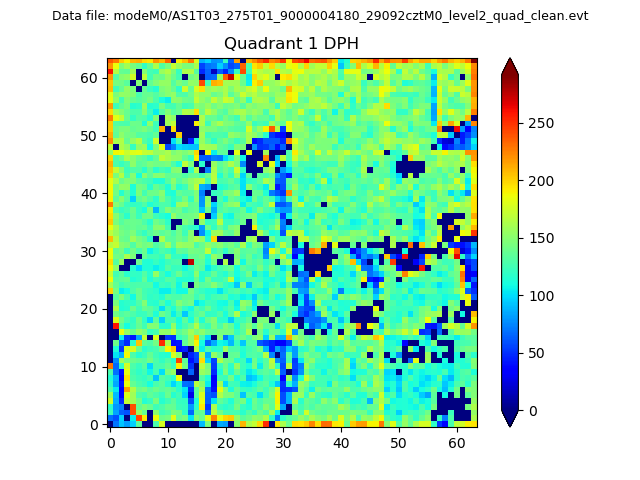 |
Quadrant B |
|---|---|---|---|
| Quadrant D | 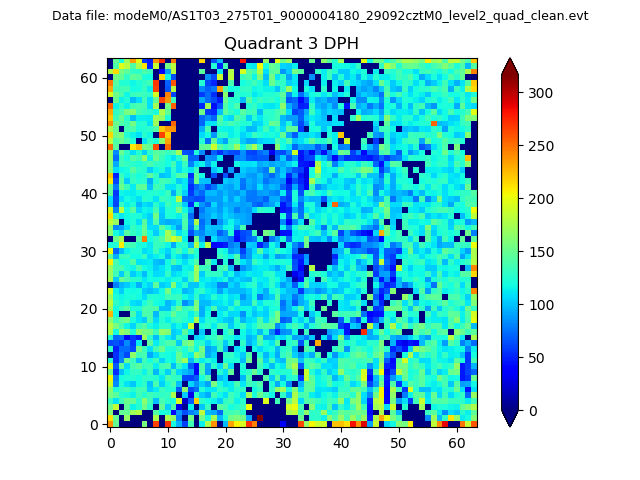 |
 |
Quadrant C |
| Plot type | Count rate plots | Images |
|---|---|---|
| Comparison with Poisson distribution Blue bars denote a histogram of data divided into 1 sec bins. Red curve is a Poisson curve with rate = median count rate of data. |
 |
 |
| Quadrant-wise count rates Data is divided into 100 sec bins |
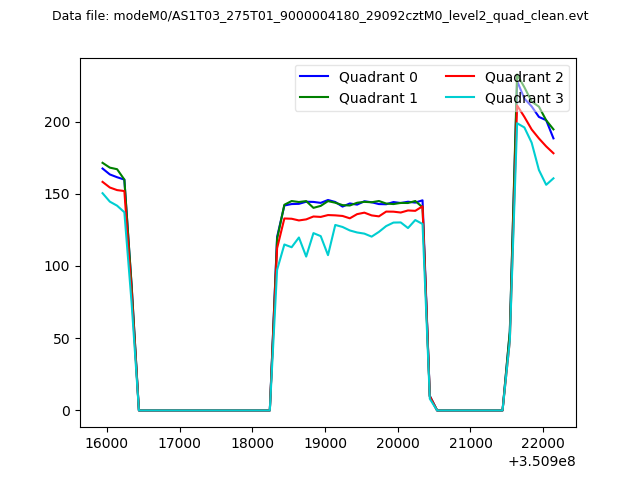 |
|
| Module-wise count rates for Quadrant A Data is divided into 100 sec bins |
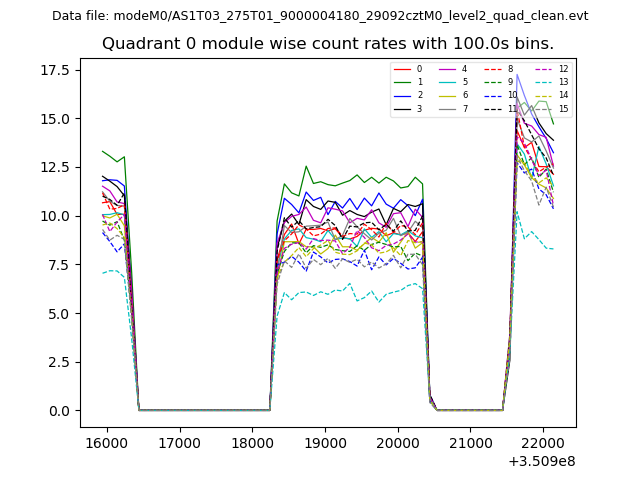 |
 |
| Module-wise count rates for Quadrant B Data is divided into 100 sec bins |
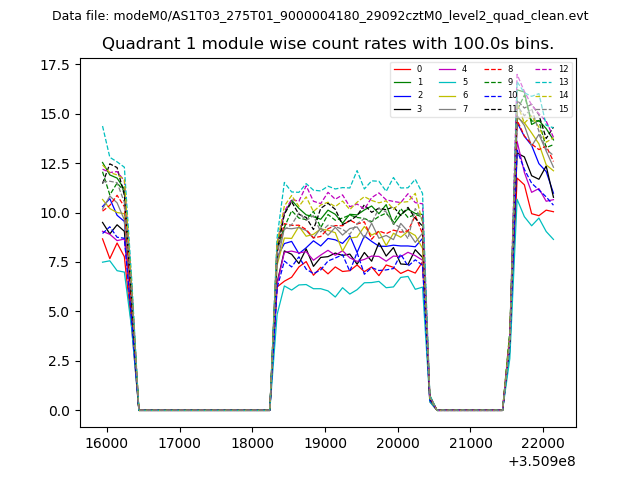 |
 |
| Module-wise count rates for Quadrant C Data is divided into 100 sec bins |
 |
 |
| Module-wise count rates for Quadrant D Data is divided into 100 sec bins |
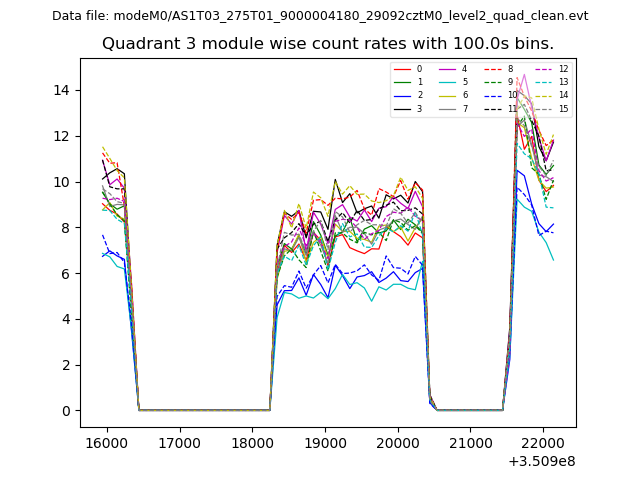 |
 |
| Parameter | Plot |
|---|---|
| CZT HV Monitor | 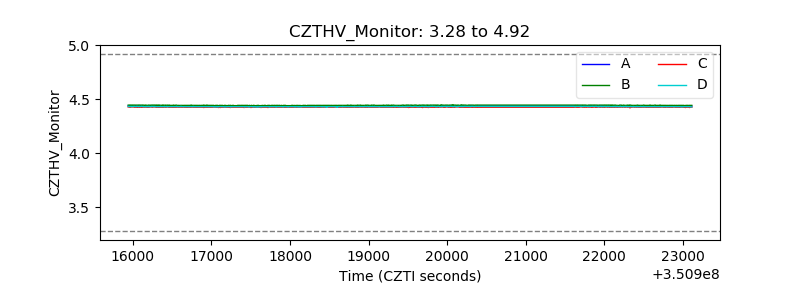 |
| D_VDD | 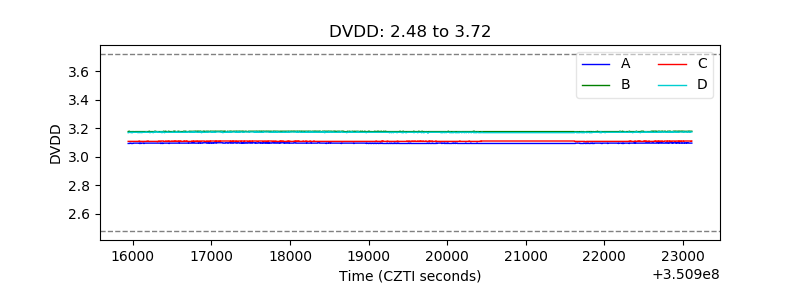 |
| Temperature 1 | 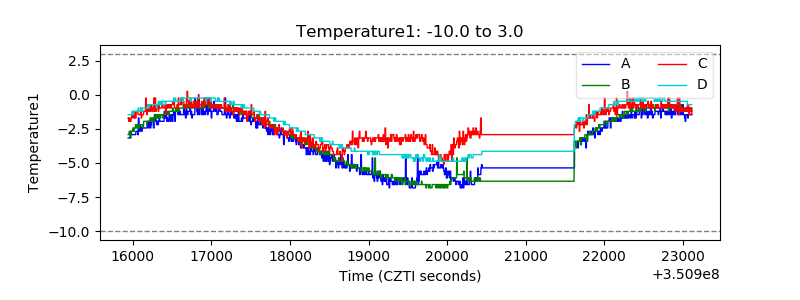 |
| Veto HV Monitor | 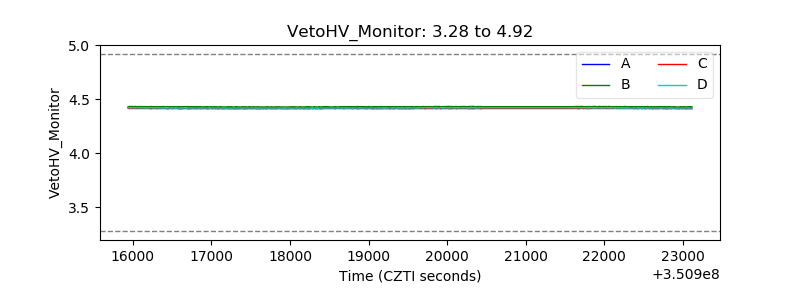 |
| Veto LLD | 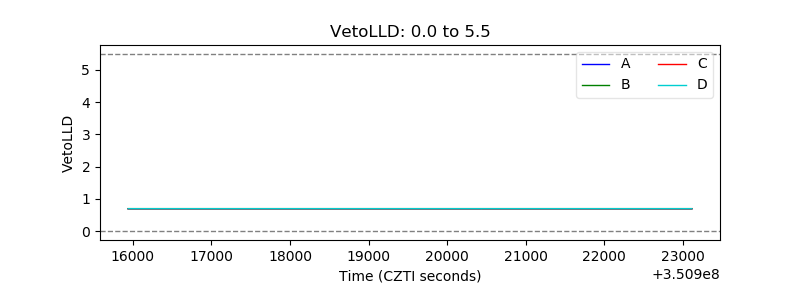 |
| Alpha Counter |  |
| _CPM_Rate | 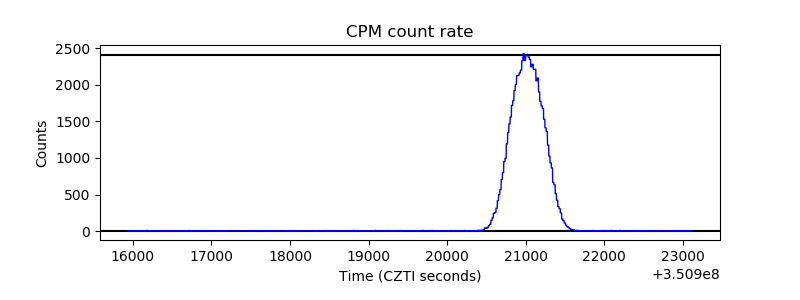 |
| CZT Counter |  |
| +2.5 Volts monitor |  |
| +5 Volts monitor |  |
| _ROLL_ROT | 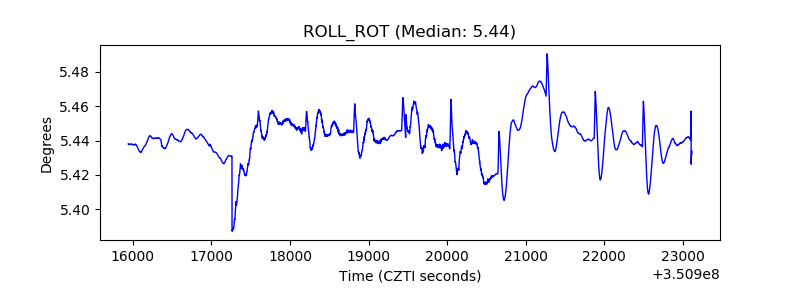 |
| _Roll_DEC | 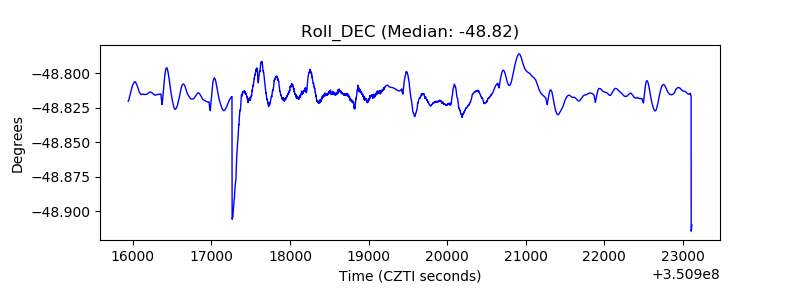 |
| _Roll_RA | 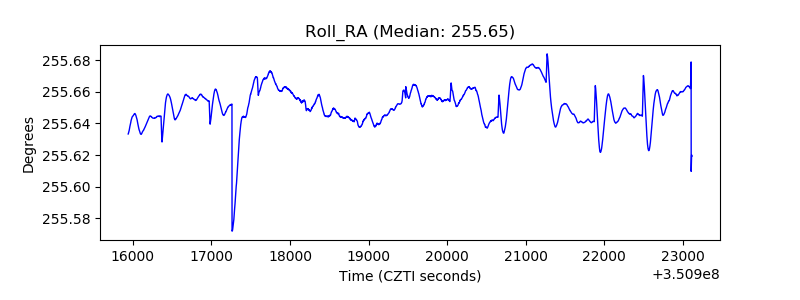 |
| Veto Counter | 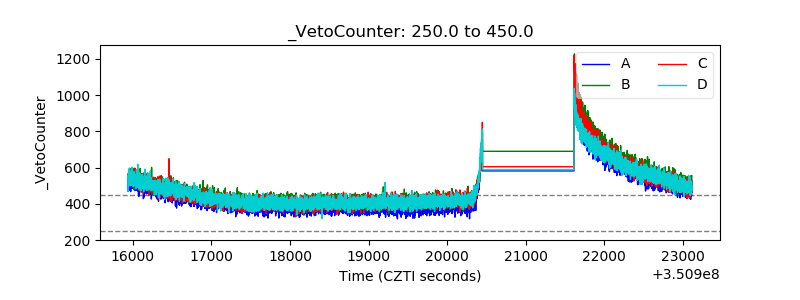 |